 |
| About Bioline | All Journals | Testimonials | Membership | News |
|
||||||
|
||||||
Electronic Journal of Biotechnology, Vol. 11, No. 2, April, 2008, pp. Visualisation of the microbial colonisation of a slow sand filter using an Environmental Scanning Electron Microscope Esther Devadhanam Joubert*1 , Balakrishna Pillay2
1Department of Environmental Sciences,
Skinner Street Campus,
University of South Africa,
P O Box 392, 0003,
South Africa
Tel: 27 012 352 4278
Fax: 27 012 352 4270
E-mail: joubeed@unisa.ac.za Code Number: ej08028 Abstract The removal of contaminants in slow sand filters occurs mainly in the colmation layer or schmutzdecke - a biologically active layer consisting of algae, bacteria, diatoms and zooplankton. A ripening period of 6 - 8 weeks is required for this layer to form, during which time filter performance is sub-optimal. In the current study, an environmental scanning electron microscope was used to visualise the ripening process of a pilot-scale slow sand filter over a period of eight weeks. To achieve this, sand particles were removed at weekly intervals and observed for biofilm development. Biological mechanisms of removal in slow sand filtration are not fully understood. A visualisation of the colonisation process would enhance the knowledge and understanding of these mechanisms. Colonisation of sand particles and increase in biomass was clearly seen during the ripening period. The mature, ripened filter exhibited a dense extracellular matrix consisting of a wide variety of microorganisms and their extracellular and breakdown products. This research demonstrated the successful use of an environmental scanning electron microscope to visualise the complex, heterogeneous nature of the schmutzdecke in a slow sand filter. Such knowledge could possibly lead to an increase in the application of slow sand filtration, especially for rural communities. Keywords: biofilm, microbial biodiversity, schmutzdecke.
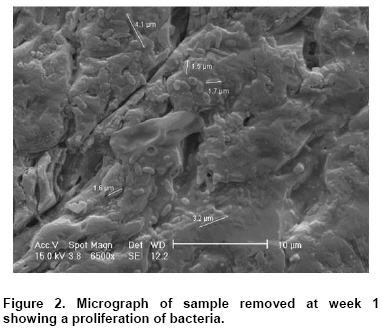
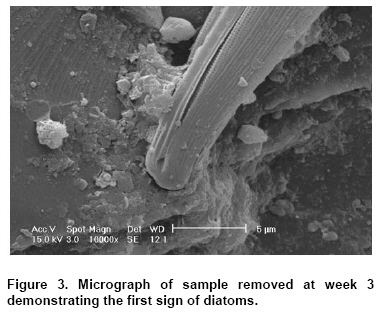
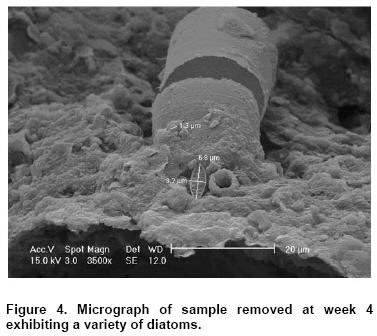
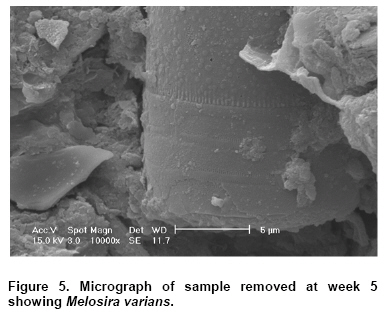
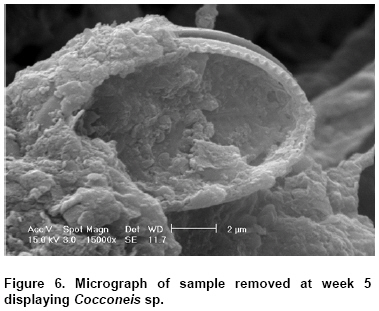
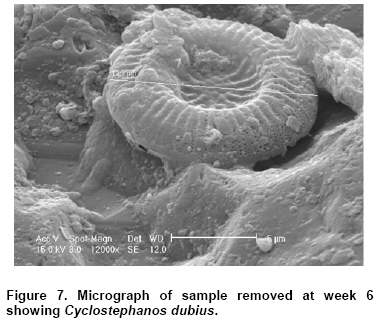
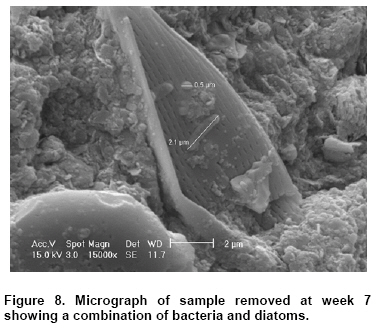
Access to safe drinking water is a basic human right and required to sustain life. The production of adequate and safe drinking water is the most important factor contributing to a decrease in mortality and morbidity in developing countries (van Leeuwen, 2000). Finding a way to provide clean and safe drinking water in affected areas is therefore a necessary step in any effort to improve the quality of life of people in underserved areas and to mitigate the devastating effects of disease on the people of the developing world. For over 150 years, slow sand filtration (SSF) has been an effective means of treating water for the control of microbiological contaminants. In recent years, a resurgence in SSF application has occurred particularly because of its efficiency in removing, besides bacteria and viruses, cysts of the protozoan Cryptosporidium which are pathogenic and usually quite persistent (Hijnen et al. 2007). SSF has also been shown to be effective for the removal of nitrates in drinking water (Aslan and Cakici, 2007). High removal rates of antimicrobial contaminants have also been reported (Rooklidge et al. 2005). Although SSF has often been replaced by faster and more high-rate filtration methods such as rapid sand filtration, its low cost, ease of operation, minimal maintenance requirements, and success in removing pathogenic microorganisms make SSF an attractive option for use in developing nations and rural communities (Logsdon et al. 2002). Slow sand filtration of surface water is one of the oldest and most successful drinking water treatment techniques available for rural regions (Rooklidge et al. 2005). The simplicity of SSF, especially the absence of chemical coagulation for pretreatment, enables filtration plants to be operated by part-time personnel who have little training in microbiology or chemistry (Logsdon et al. 2002). Although the high efficiency of water treatment achieved by slow sand filters is partly explained by the slow filtration rate (0.1 - 0.3 mmh-1) and fine effective size of the sand (0.1 - 0.3 mm), biological processes that occur in the upper layer of the sand bed also play a pivotal role. It is believed that contaminant removal in SSF occurs mainly in the colmation layer or schmutzdecke - a biologically active layer or biofilm formed at the sand-water interface (Campos et al. 2002). A limiting factor to the application of sand filters is the long filter ripening period required at the beginning of each run. Filter ripening is a complex process that involves both biological and physiological mechanisms. As filtration progresses, the colmation layer, which is richly populated with protozoa, bacteria, algae and other forms of life, develops and contributes to removal of water pollutants (Dizer et al. 2004). The bacteria may grow together in colonies on the surface of the sand grains, forming biofilms to which particulates in the raw water can adsorb. Microorganisms may also produce exocellular polymers that stick to raw-water particulates and enhance their removal (Jellison et al. 2000). Various biological mechanisms of bacterial removal in slow sand filters have been proposed. Potential biologically-mediated particle removal mechanisms include predation by filter-feeding microorganisms and attachment to biofilms (Weber-Shirk and Chan, 2007). Transport, adsorption and mobilisation processes of organic and inorganic material are also affected by microbial activity (Hendel et al. 2001). However, there is a paucity of information regarding the microbial community and interactions occurring in the colmation layer. Detailed analyses of biomass growth in the schmutzdecke would improve the understanding of the complex and fundamental interactions between the biological and physicochemical processes that operate in slow sand filter systems (Campos et al. 2002). Bacteria, algae, protozoa and fungi have a high water content, which prevents direct, unmanipulated observation in a traditional scanning electron microscope (Collins et al. 1993). Sample preparation for the visualisation of biological samples in a scanning electron microscope conventionally involves fixing, freezing or dehydration, which may damage delicate samples and/or compromise morphological information. Environmental Scanning Electron Microscopy (ESEM) allows biological samples to be viewed with minimal sample preparation and manipulation. Scanning electron microscopy (SEM) has previously been used to view sand samples removed from a slow sand filter with varying success (Esch and Nehrkorn, 1988; Ellis and Aydin, 1995; Law et al. 2001). In contrast, ESEM has not previously been applied to the visualisation of microbial colonisation within a slow sand filter. It is envisaged that the visualisation of microorganisms in situ would aid in the study of the diversity of the microbial community that inhabits a slow sand filter. The current study investigated the efficiency and suitability of ESEM as a tool to visualise the development of biofilm on sand particles obtained from the schmutzdecke of a slow sand filter during the ripening period. In addition, the physical characteristics and microbial diversity of the biofilm was observed. Materials and Methods Assembly and operation of the slow sand filter To initiate the research, an experimental pilot-scale slow sand filter had to be designed and constructed. This slow sand filter was designed and constructed according to predetermined parameters in the Department of Microbiology at the Westville Campus of the University of KwaZulu-Natal (UKZ-N). The dimensions of the filter are as follows: Inner diameter - 20 cm The filter was constructed using perspex plastic, as this material is easily obtainable, does not erode and is relatively inexpensive. The filter was manufactured by the Academic Instrumentation Unit, UKZ-N. Low turbidity surface water (≤7 NTUs) from the nearby Palmiet River was allowed to flow through the filter and to facilitate microbial colonisation during an eight-week period. The rate of filtration was controlled by the outflow valve. Both the turbidity of the influent water and the filtration rate were monitored on a daily basis. The depth of water above the sand bed was maintained at 50 cm by the overflow to ensure sufficient settling of suspended solids. The entire unit was housed in a room that received very little sunlight to prevent the excessive proliferation of algae. Samples were removed from the schmutzdecke at weekly intervals during the eight-week ripening period. In addition, a control sample was taken at the beginning of the filter run (time 0). A sterile test tube was inserted into the sand up to a depth of approximately 1 cm to make certain that the sand particles remained intact. Approximately 2 g of sample at a time was removed using the upper end of this sterile test tube. This small quantity was sufficient for ESEM analysis. It also ensured minimal disruption of the schmutzdecke. Great care was taken to ensure minimal handling and possible disturbance of samples. Environmental Scanning Electron Microscopy No dehydration, fixing or freezing was performed on samples. Samples were mounted onto aluminium stubs using double-sided carbon tape. Initially, selected specimens were viewed uncoated under low vacuum (approx 1Torr), using the large field gaseous secondary electron detector (LFD) of the environmental scanning electron microscope. These images proved to be of a poor quality. Samples were then coated for 4.5 min with 40% Au: 60% Pd using a Polaron E5100 sputter coater (thickness 100 nm). These samples were viewed under high vacuum with a Philips XL30 environmental scanning electron microscope at 15kV, spot 3 - 4. In this study, high vacuum was the most successful in obtaining high quality images. Images have the detector labelled as SE on the databar. Micrographs were analysed using a specialised image analysis software programme. The analysis does not yield exact results but rather a best approximation of the size and dimensions of targeted structures. Toggle lines are drawn by hand using the mouse as the input device; consequently, the factor of human error is unfortunately present. Therefore, the accuracy is not as ideal as it would be if the lines were generated automatically by the image analysis software programme. A further point of consideration is the 3-dimensional nature of the samples. A micrograph is a 2-dimensional representation of an entity and accordingly cannot account for the curvature of the surface or the depth of structures. Results and Discussion Previous work on visualisation of slow sand filter sand particles using SEM has yielded limited success (Esch and Nehrkorn, 1988; Ellis and Aydin, 1995; Law et al. 2001). In all of these experiments fixing and dehydration of samples was performed, which could disrupt and/or distort biological material. Dehydration especially has been shown to compromise the quality and structural integrity of biological samples. Up to 97% of a biofilm matrix is composed of water (Sutherland, 2001). In SEM, specimen preparation often involves a drying step which appears to change biofilms considerably due to the collapse of the EPS polymers. ESEM excludes or minimises dehydration, thereby preserving biofilm morphology including surface structures (Priester et al. 2007). The main advantage of the current research protocol in comparison to SEM is the quick and simple preparation of material without the need for any dehydration or fixing. In this respect, the study allows for a comparison between SEM and ESEM for the visualisation of the colonisation of a slow sand filter and thereby clearly demonstrates the distinct advantage of ESEM. More than 200 micrographs were taken with the environmental scanning electron microscope to provide a complete week-by-week representation of the filter-ripening period. These micrographs provided an accurate and detailed imaging of the colonisation process. Magnifications ranged between 250 and 15000x. The development of the biofilm, coupled with an increasing microbial diversity, was demonstrated. Micrographs from each week of filter operation are discussed below. Sand particles removed from the sand-water interface at time zero are represented in Figure 1. The sand particles are smooth and there is no evidence of attachment of other particles or organisms to the surface. This served as a control and a comparison for future samples. The dimensions of the sand particle shown are 722.2 µm by 525.5 µm. The majority of the sand particles fell into this size range. In addition, the image demonstrates that at this stage sand particles are still independent units and are not attached to other particles. Ellis and Aydin (1995) reported a similar bareness of sand grains in their SEM micrographs. The surface of the aluminium stub in the background is also clearly visible. After only one week there was significant evidence of colonisation of sand particles by bacteria (Figure 2). Bacteria appear to be the primary colonisers of the sand surface. There is also evidence of an extracellular matrix that surrounds and covers the bacteria. The initial formation of a biofilm is aided by the production of an extracellular mucilage by bacteria. This mucilage aids in the attachment of microorganisms to surfaces (Law et al. 2001). Sand particles have become covered with numerous rod- and cocci-shaped bacteria. Different types and shapes of rods are clearly visible. Rods of varying sizes appear to be the dominant organisms. The lengths of the visible rods range from 1.5 µm to 4.1 µm. This demonstrates a large variation in the size scale. Such a variety of bacteria indicates the lack of dominance of a single bacterial species. Initially, the sand in a slow sand filter is typically a nutrient-poor environment. Since the biofilm has not yet been fully established, it can be inferred that the organisms present are pioneer organisms in the developing biofilm and that they utilise co-metabolism to exploit the available resources. Further colonisation of the sand particle surface was observed after the second week. In addition, the physical structure of the sand surface began to alter due to the accumulation of microorganisms and their extracellular and breakdown products. This accumulation of biofilm material influences the physical mechanisms of removal such as straining and sieving. The abundance of bacteria seen in the previous micrograph became noticeably absent. However, a significant amount of debris is present, which indicates the build-up of breakdown products from the metabolic processes of the microorganisms, as well as dead material. Figure 3, taken after three weeks of filter operation, shows a diatom adhering to the surface of a sand particle. Only half of the diatom is visible against the sand grain. Furthermore, the base of the diatom is gradually becoming covered or embedded in the extracellular matrix. Since only the end of the diatom is visible, identification is difficult to ascertain. Tentative identification suggested that the diatom could be either Gyrosigma or Nitzschia sp. The apparent scarcity of bacteria at this stage may partly be explained by the observation of Calvo-Bado et al. (2003) who suggested that most of the microbial communities present within the slow sand filter were tightly attached to the sand grains within biofilms and that lower numbers existed as free-living bacteria. As the filter run progressed, the diversity of microorganisms contained in the schmutzdecke increased. After four weeks a variety of diatoms became more apparent (Figure 4). Two species of diatoms are visible in Figure 4. The large, round diatom in the background is Melosira varians and the small diatom in the foreground is Nitzschia cf. frustulum. There is a large amount of extracellular material, which suggests that the biofilm has already been established. The trends observed in the first four weeks of colonisation, such as the accumulation of the biofilm and an increase in microbial biodiversity, continued in Weeks 5 and 6 (Figure 5, Figure 6 and Figure 7). Whereas previously bacteria dominated the biofilm, diatoms now seemed to be occurring in greater numbers, variety and frequency. Melosira varians (girdle view) is clearly visible in Figure 5 under 10 000x magnification. The diatoms Cocconeis sp. and Cyclostephanos dubius are found in Figure 6 and Figure 7 respectively. A micrograph from week 7 demonstrates how the diatoms also become embedded in the biofilm. Bacteria that can be seen growing on the diatoms are possibly responsible for their utilisation (Figure 8). The fairly large rod of 2.1 µm and coccus of 1.5 µm might indicate that bacteria were once again establishing themselves in the biofilm. After the final week of filter priming (week 8) the sand particles were covered to such an extent that no part of the sand surface was visible and only the biofilm covering the sand grain could be seen. The micrograph (Figure 9) was taken at a lower magnification, but none of the aluminium stub background is visible as compared to the control. This is in stark contrast to the findings of Ellis and Aydin (1995) who reported that in none of the micrographs was there any apparent evidence of a continuous biological film and that the general impression was a sparsity of life. However, the results in this research can be correlated to those of Law et al. (2001) and Esch and Nehrkorn (1988) who also demonstrated the heterogeneous nature of biofilms within a slow sand filter. The attachment of microorganisms to the biofilm with slime-nets and stalks was reported by Esch and Nehrkorn (1988). No specialised mechanisms of attachment were observed in this research. The microbial diversity of the biofilm continued to increase with time as other microorganisms from the water source became trapped and embedded in the schmutzdecke. Unfortunately, not all the structures in the micrographs could be accurately identified. Such a wide diversity of microorganisms as demonstrated in these 9 Figures has not previously been observed. Although it has been suggested that there is little evidence to support the removal of bacteria by slow sand filter biofilms (Weber-Shirk and Chan, 2007), other studies reported that microbial communities within the layers of the sand filter, together with physical and chemical processes, had the greatest impact on the quality of water (Hendel et al. 2001). Therefore, the role of the microorganisms within the biofilm of a slow sand filter in the enhancement of water quality cannot be overlooked. Even though the influent water would play a role in determining the type of organisms found in the schmutzdecke, certain widespread water-borne organisms can be expected to be consistently found in all slow sand filter biofilms. Freshwater organisms would be expected to dominate as slow sand filters are typically used for the purification of free-flowing surface waters. These organisms play a vital role in the biological mechanisms of water purification in SSF. Concluding Remarks In South Africa, a rapidly developing country with a high percentage of its population living in rural areas, access to safe, clean water for all by 2008 is advocated in government legislation. It might be difficult to achieve this goal by only utilising existing procedures for water purification. The use and suitability of slow sand filtration for small water systems in developing nations is well known and documented. In order to enhance the implementation of such systems, in particular at a rural community or household level, a sound knowledge and understanding of all processes occurring within the filter is required. Research on the biological diversity of organisms within the filter is an important and necessary step in order to attain this comprehension. The research presented in this article demonstrated the variety of microorganisms in the colmation layer of a slow sand filter. It showed the value of ESEM as a tool to image delicate biological samples. The applicability of ESEM to biofilms in particular showed great potential since there was no risk of collapse or compromise of the structural integrity of the biofilm by dehydrating procedures. This work is also unique in that a week-by-week imaging of the colonisation process in a slow sand filter has not previously been reported. The schmutzdecke of a slow sand filter is a highly complex, specialised environment. This environment is dynamic and constantly transforming as the influent water varies, the biofilm develops, environmental conditions change, and new organisms come to dominate. The exact function and activity of the individual organisms within a sand filter bed have not yet been ascertained. Therefore, it is recommended that further investigation should include a correlation between these micrographs, succession studies, microorganism activity, and water quality analysis of the sand filter. With the assistance of a technology such as slow sand filtration units, tailor-made for use in rural water systems, the goals of the government of South Africa can realistically be achieved. This applicability can be extended to other developing countries with similar needs and objectives. Acknowledgments The author would like to express thanks to the following individuals and organisations: The National Research Foundation (NRF), for financial support; Dr Rex Lowe, Department of Biological Sciences, Bowling Green State University, USA and Dr Jonathan C. Taylor, School of Environmental Sciences, Division Botany, Potchefstroom Campus of the North-West University, for the identification of diatoms; and Belinda White and staff members, Electron Microscopy Unit, UKZ-N (Pietermaritzburg) for assistance with ESEM. References
Note: Electronic Journal of Biotechnology is not responsible if on-line references cited on manuscripts are not available any more after the date of publication. © 2008 by Pontificia Universidad Católica de Valparaíso -- Chile The following images related to this document are available:Photo images[ej08028f6.jpg] [ej08028f4.jpg] [ej08028f7.jpg] [ej08028f5.jpg] [ej08028f2.jpg] [ej08028f3.jpg] [ej08028f8.jpg] [ej08028f1.jpg] [ej08028f9.jpg] |
| |||||||||
