 |
| About Bioline | All Journals | Testimonials | Membership | News |
|
||||||
|
||||||
Electronic Journal of Biotechnology, Vol. 11, No. 3, July 15, 2008 RESEARCH ARTICLE Genetic polymorphism of the αs1-casein locus in five populations of goats from Mexico José Antonio Torres-Vázquez1 , Felícitas Vázquez Flores2 , Hugo H. Montaldo*3 , Raúl Ulloa-Arvizu4 , Mauricio Valencia Posadas5 , Amanda Gayosso Vázquez6 , Rogelio Alejandro Alonso Morales7 1Departamento de Genética y Bioestadística,
Facultad de Medicina Veterinaria y Zootecnia,
Universidad Nacional Autónoma de México,
Ciudad Universitaria, México 04510, D.F., México
Tel: 52 55 56 22 5894
Fax: 52 55 5622 5956
E-mail: antonio.tv@correo.unam.mx Financial support: This study was supported by grant SAGARPA 2003-152 by the National Council of Science and Technology (CONACYT), Mexico. Received November 19, 2007 / Accepted March 14, 2008 Code Number: ej08036 Abstract With the objective of estimating allele frequencies, and testing for population divergence for the CSN1S1 locus, genotypes of animals from five goat populations; Saanen (n = 97), Alpine (n = 81) Toggenburg (n = 92), local goats with external appearance similar to the Murciana-Granadina breed from Central Mexico (n = 26) and heterogeneous local animals denominated Mosaico Lagunero (n = 30), from Northern Mexico, were identified using PCR and Xmn1 PCR-RFLP methodology. For Saanen, Alpine and Toggenburg, the sum of E and F alleles had the largest frequencies (from 0.468 to 0.789), while for the groups local Murciana-Granadina and Mosaico Lagunero the sum of the most frequent allelic groups (A* and B*), were 0.385 and 0.533 respectively. Both local Murciana-Granadina and Mosaico Lagunero populations showed heterozygote excess (P < 0.08). The percentage of the total genetic variation (FST) explained by population differences was 5.16. There was genetic differentiation for most pair comparisons between populations (P < 0.05), excepting for Alpine versus Toggenburg, and Toggenburg versus Mosaico Lagunero (P > 0.05). For Saanen and Alpine the frequencies of alleles E and F were similar to the same breeds previously analyzed in Europe. Therefore there are opportunities of increasing the frequency of the strong alleles for protein content Gene Assisted Selection (GAS) in these two breeds. For Toggenburg the most frequent allelic groups were F (0.32) and B* (0.21). Results indicate differentiation between most populations for this locus. Moreover, heterozygote excess in local populations indicated breed admixture. Keywords: CSN1S1, gene frequencies, genetic diversity, goat milk, PCR-RFLP.
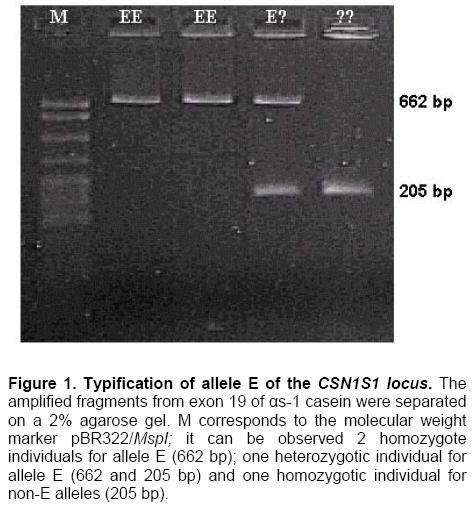
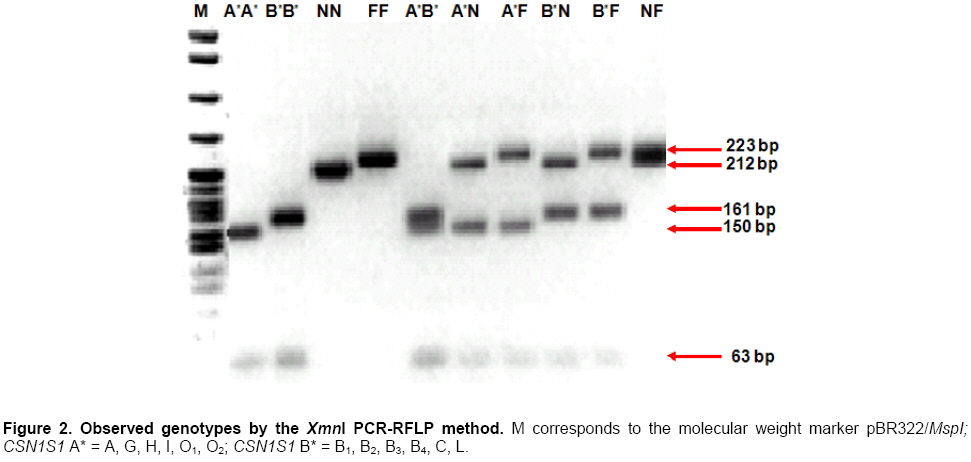
In Mexico and other countries, goat milk is used mainly for its transformation in cheeses and sweets. The economic value of milk depends therefore in a great extent on the content and total quantity of protein and fat (Montaldo and Manfredi, 2002). The polymorphism of CSN1S1 in goats is associated with the quality, composition, some technological properties of the milk, also with the yield and quality of cheese (Martin et al. 2002; Roncada et al. 2002; Gómez et al. 2004). The alleles of the CSN1S1 locus in goats have been grouped in 4 levels according to their individual approximate contribution to quantity of protein in milk; strong alleles (A, B1, B2, B3, B4, C, H, L and M), intermediate alleles (E and I), weak alleles (D, F and G), and null alleles (O1, O2 and N) (Grosclaude et al. 1987; Moioli et al. 1998; Rando et al. 2000; Bevilacqua et al. 2002; Ramunno et al. 2005; Sacchi et al. 2005; Sztankóová et al. 2007). In dairy goat populations, it is often considered convenient to identify the CSN1S1 genotypes of individual animals, with the idea of incorporating this information to the selection processes, and therefore propitiate an increase on the rate of genetic gain for casein contents and yield through gene assisted selection (GAS), compared to selection programs based only on phenotypic and pedigree information (BLUP), (Grosclaude et al. 1987; Moioli et al. 1998; Dekkers, 2004; Sánchez et al. 2005). Several studies have been carried out in different goat populations to estimate genotypic and allelic frequencies for this locus (Feligini et al. 2005). The diversity of the CSN1S1 gene can help in understanding the genetic structure of goat populations in Mexico, which is characterized by a great racial heterogeneity (Montaldo and Meza, 1999). The objective of this study is to study the genetic polymorphism of the CSN1S1 locus in five populations of goats from Mexico, by estimating genotype and allele frequencies, as well as testing for population divergence. Materials and Methods A total of 270 blood samples of goats from different populations: Saanen (n = 97), Alpine (n = 81), and Toggenburg (n = 92) were collected from dairy goat flocks belonging to the National Association of Breeders of Registered Goats of Mexico. Besides, 26 samples of black-solid colour local goats with external appearance of Murciano-Granadina breed obtained from Apaseo el Grande in the State of Guanajuato, in Central Mexico, were included. Also, 30 blood samples of goats obtained in the northern Mexican region named 'La Laguna', area that include the Southern portion of the state of Coahuila and the Northwestern portion of the state of Durango. This last population is probably product of crossbreeding between local animals and specialized breeds such as Nubian, Alpine, Toggenburg and Saanen. Due to these reasons, this group of goats has been denominated Mosaico Lagunero (SAGARPA, 2002). The genomic DNA was extracted by phenol-chloroform. For the allele E typing, the Polymerase Chain Reaction (PCR) was used in order to amplify a region present in the exon 19 of the CSN1S1 locus. In the E variant a 457 bp segment was amplified due to the presence of a long interspersed nuclear transposable element (LINE, Long Interspersed Nuclear Elements). In non-E alleles, a 205 bp region was amplified (Pérez et al. 1994). The PCR reaction was prepared in a final volume of 20 μl containing: 100 ng of genomic DNA, 10 pmol of each primer (Forward: 5’ ATG GGA TTG AAA ATT CCA TGC 3’, reverse: 5’ ATA CTA CTG GAA TTT AGG TA 3’), 1 U of Taq DNA polymerase, PCR buffer (1.5 mM MgCl2; 10 mM Tris-HCl pH 8.4; 50 mM KCl; 10 μg/ml gelatin), 0.2 mM of dNTPs, and 0.15 μg/ml of BSA. The amplification conditions were: an initial step of 94ºC for 3 min; followed for 30 cycles of 94ºC for 30 sec, 59ºC for 30 sec and 72ºC for 30 sec and a final step of 72ºC for 3 min. Differentiation between alleles F, N, A* (CSN1S1 A, G, H, I, O1, O2) and B* (CSN1S1 B1, B2, B3, B4, C, E, L) was developed by the XmnI PCR-RFLP method according to Ramunno et al. (2000). Locus variation of the alpha s1-casein and Hardy-Weinberg equilibrium test In each population, genotypic frequencies, allelic frequencies, fixation index (FIS) (Weir and Cockerham, 1984), observed heterozygosity (Ho), and expected heterozygosity (Hs) were estimated by using the GENEPOP version 3.4 software (Raymond and Rousset, 1995a). The effective number of alleles (ne) was estimated as ne = 1 / Σxi2, where xi is the frequency of the i-th allele for the CSN1S1 locus. At each population U Score was used to test average heterozygote deficit or excess (Rousset and Raymond, 1995) using GENEPOP version 3.4 software (Raymond and Rousset, 1995a). Departures from Hardy-Weinberg equilibrium (HWE) at each population were tested by the method of Guo and Thompson (1992) using GENEPOP version 3.4 software (Raymond and Rousset, 1995a), and HWDIAG version 1.beta software (Rogatko et al. 2002). Genetic differentiation and Wright’s F statistics (FIS, FST, and FIT) To determine the extent of genetic variation within and between populations for this locus, F statistics was obtained (Nei, 1987). FST statistic estimates the variation produced by differences between populations. The statistic FIS estimates the variation inside populations. The statistic FIT is the inbreeding coefficient of one individual relative to the total population. F statistics was estimated with the method proposed by Weir and Cockerham (1984), using the software GENEPOP version 3.4 (Raymond and Rousset, 1995a). Genetic differentiation between the caprine populations was evaluated with an exact test and a log-likehood G test performed with GENEPOP version 3.4 software (Raymond and Rousset, 1995a), which uses the Markov Chain method to get the probability of the genotypic distributions between the different populations (Goudet et al. 1996). Results Through an amplification of one region in the exon 19 it was identified the insertion of a LINE element in the allele E. In Figure 1 can be observed a gel showing homozygote individuals for E, (662 bp fragment), heterozygote individuals (662 and 205 bp fragment) and homozygote individuals for non-E fragment (205 bp alleles). Because the CSN1S1 01 allele is characterized by the deletion of the last part of the gene, the 662 bp fragment obtained after PCR amplification of exon 19 of the goat CSN1S1 gene identify both individuals with genotype E/E that E/01. However, the consequences may not be very important, because the frequency of O1 allelehad been found very low in previous studies (Grosclaude et al. 1987; Mahé and Grosclaude, 1989; Ramunno et al. 1991). The identification of alleles F and N were obtained through the amplification of one segment of exon 9 and its posterior digestion with XmnI enzyme. In Figure 2 can be observed genotypes after XmnI digestion of fragments obtained by the XmnI PCR-RFLP method according to Ramunno et al. (2000). This technique allowed us to identify F and N alleles, but not distinguish alleles A from G, H, I, O1, O2 on the haplotype associated to 63 and 150 bp fragments, neither alleles B from B1, B2, B3, B4, C, E, L on the haplotype associated to 63 and 161 bp fragments (Ramunno et al. 2005; Cosenza et al. 2008). Allele and genotype frequencies and effective number of alleles (ne) The distribution of the observed genotypes and the frequency of alleles at CSN1S1 locus are reported in the Table 1 and Table 2 respectively. In the Saanen population, alleles E (0.42) and F (0.37), and in Alpine E (0.24) and F (0.28) were the most frequent. There were no homozygote Saanens for the A* allele, neither A*B* heterozygotes. The Saanen population had the lower ne (3.03) while the Alpine population presented the highest (4.69). In the Toggenburg population, the most frequent alleles were F (0.32) and B* (0.21); in the Murciano-Granadina population the most frequent alleles were E (0.44) and A* (0.25). In Murciano-Granadina population, we did not observe homozygote animals for A*, B*, N or F alleles, neither heterozygote animals for B*N, B*F and NF. In the Mosaico Lagunero population, the most frequent alleles were B* (0.35) and F (0.23), and we did not observed homozygotes for A*, B* or E, neither heterozygotes for A*E.
A large genetic diversity was observed (Hs > 0.7) in most populations, excepting in Saanen, which had the smaller value for Hs (0.67). In the Saanen population, only 3 alleles contributed to this heterozygosity, since A* and N alleles had frequencies smaller than 0.08. On the other hand, Alpine and Toggenburg populations presented values close of Hs (0.8) to the maximum possible for 5 alleles (Table 2). Hardy-Weinberg equilibrium test Using the method of Rogatko et al. (2002), only the Alpine population was found to be in HWE (P > 0.05), and the rest of the populations showed disequilibrium (P < 0.05). However, using the Guo and Thompson method (1992), HWE was not rejected in Alpine, Murciana-Granadina or Mosaico Lagunero populations (P > 0.05), while other populations showed significant departures as well (P < 0.05) (Table 3).
Toggenburg and Saanen populations showed a positive value for FIS, therefore a heterozygote deficiency test was applied and it was found that it was not significant (P > 0.05) (Table 3). Meanwhile Murciana-Granadina and Mosaico Lagunero populations, with a negative value for FIS, were used to apply the heterozygote excess test. Murciana-Granadina (P = 0.02) and Mosaico Lagunero (P = 0.08) populations showed evidence of heterozygote excess (Table 3). Genetic differentiation and Wright’s F statistics (FIS, FST and FIT) The statistic FIT it’s refers to the inbreeding coefficient of the metapopulation that in this study corresponded to 0.0484. The statistic FIS value is the average inbreeding of the 5 populations, whose value was of -0.0034, showing a small average excess of heterozygote proportion. The FST index measures the genetic differentiation in the populations. Their value of 0.0516 indicates a moderate genetic differentiation between the goat populations. Due to the existence of differences between the populations, a test to evaluate differences on the genotypic frequencies between pairs of populations was performed (Raymond and Rousset, 1995b). In 8 tests there were highly significant difference (P < 0.01), meanwhile in Toggenburg versus Alpine (P = 0.088) and Toggenburg versus Mosaico Lagunero (P = 0.068) a lower significance was found. Discussion Genotypic and allele frequencies This is the first study in Mexico that contributes with results about the polymorphism of the CSN1S1 locus of goats. Previous studies indicate that in the Alpine and Saanen breeds, alleles E and F are the most frequent (about 0.40 each one), while allele A shows a smaller frequency (about 0.10) (Grosclaude et al. 1987; Ramunno et al. 1991). On the other hand, E and B alleles predominate in the Murciana-Granadina (0.59), Malagueña (0.65) and Payoya (0.76) breeds, while A and B alleles are more frequent in Canaria (A: 0.28 and B: 0.32) breed. It is important to mention that most of Spanish breeds present a low frequency of F allele (Jordana et al. 1996). In this study it was observed a higher frequency of alleles E (0.42) and F (0.37) in the Saanen population, coinciding in general terms with the frequencies observed in France E (0.41) and F (0.43) (Grosclaude et al. 1987), and in Italy E (0.49) and F (0.46) (Martin and Leroux, 2000) (Table 4). In the Alpine population, allele F showed the higher frequency (0.28); followed by allele E (0.24). The allele F was also the most frequent in the studies from France (0.41) (Grosclaude et al. 1987) and Italy (0.59) (Ramunno et al. 1991). However, these values are somewhat higher than those obtained in this study. The Alpine population had the greater genetic diversity, reported as Hs (0.787) and, as a consequence, the larger ne (4.69). This last value is close to the maximum possible value which is 5.
For the Toggenburg population the most frequent alleles were F (0.32) and B* (0.21). Until now, it has not been found allele or genotype frequency estimates for this locus in this breed. In this study, the higher frequencies for the local Murciana-Granadina population were for the alleles E (0.44), A* (0.25) and B* (0.14). In Spain, it was reported that the most frequent alleles for the Murciana-Granadina breed were E (0.59) and B (0.23) (Jordana et al. 1996), but the alleles A and F showed smaller values than those found in this study. These differences could have been caused by a founder effect, genetic drift or by adding a mixture with other populations. The effect of selection for milk production in the reduction of frequencies of strong alleles is another factor that could not ruled out in causing population divergence for this locus, but so far the evidence is weak. In the case of the Mosaico Lagunero population the higher frequency alleles were B* (0.35) and F (0.23); this population is the result of crossbreeding between local goats with Alpine, Saanen, Toggenburg and Nubian males. It is probable that this population would present about one half of strong alleles (0.53), which could be a consequence of local or Nubian influence (Montaldo and Meza, 1999). Nubian breed presents lower milk production levels than those of Alpine or Saanen breeds, but is superior in protein and fat content in the milk (Wiggans et al. 1988). Population structure and divergence The negative value of FIS = -0.23 (P < 0.05) in the Murciana-Granadina population, shows a heterozygote excess, which could be explained by the fact that this population is product of crossbreeding between local goats and other breeds. For the Mosaico Lagunero population, it was obtained also some evidence of an excess in heterozygotes numbers, with an FIS = -0.18 (P = 0.08) (Table 3). In this study, the average heterozygote excess value inside each population was -0.0034, which is different from the positive values found in purebred goat populations from Italy, Morocco, France, China and Switzerland (Saitbekova et al. 1999; Yang et al. 1999; Tadlaoui et al. 2002; Sacchi et al. 2005). The positive value of FST indicates that 5.16% of the genetic variation is explained by the difference between the caprine populations. These values, despite being based on only one locus data (Nei, 1987), agree with the result of study by Sacchi et al. (2005) (FST = 6.2%) in 5 caprine breeds using four loci (αs1-casein, αs2-casein, β-casein, and κ-casein). However, Saitbekova et al. (1999) using microsatellites found a superior value in all loci for the FST index of 17%. For the Alpine and Toggenburg populations the biggest absolute difference was for the E allele |0.094|, and for Toggenburg and Mosaico Lagunero populations the biggest absolute difference was for the B* allele |0.138|. Concluding Remarks Differentiation was found for this locus for most pairwise comparisons between populations. For Saanen and Alpine populations, the frequencies of alleles E and F of the CSN1S1 locus resulted to be close to those found in France and Italy. In the local population with appearance of Murciana-Granadina, the allele frequency of A* and B* alleles agree with those reported in Spain for the Granadina-Murciana breed. There are wide possibilities of increasing the strong frequencies using GAS in Alpine, Saanen and Toggenburg, due to the low frequency of the strong alleles in these populations. Evidences of crossbreeding exist in the Murciana-Granadina and Mosaico Lagunero populations. The high frequency of strong alleles in the Mosaico Lagunero population makes think on the influence of other breeds. References
Note: Electronic Journal of Biotechnology is not responsible if on-line references cited on manuscripts are not available any more after the date of publication. Supported by UNESCO / MIRCEN network © 2008 by Pontificia Universidad Católica de Valparaíso -- Chile The following images related to this document are available:Photo images[ej08036f2.jpg] [ej08036f1.jpg] | ||||||||||||||||||||||||||||||||||||||||||||||||||||||||||||||||||||||||||||||||||||||||||||||||||||||||||||||||||||||||||||||||||||||||||||||||||||||||||||||||||||||||||||||||||||||||||||||||||||||||||||||||||||||||||||||||||||||||||||||||||||||||||||||||||||||||||||||||||||||||||||||||||||||||||||||||||||||||||||||||||||||||||||||||||||||||||||||||||||||||||||||||||||||||||||||||||||||||||||||||||||||||||||||||||||||||||||||||||||||||||||||||||||||||||||||||||||||||||||||||||||||||
| |||||||||
