 |
| About Bioline | All Journals | Testimonials | Membership | News |
|
||||||
|
||||||
Electronic Journal of Biotechnology, Vol. 11, No. 3, July 15, 2008 RESEARCH ARTICLE Toxicity caused by para-substituted phenols on Tetrahymena pyriformis: The structure-activity relationships Lorentz Jäntschi*1 , Violeta Popescu2 , Sorana D. Bolboacă3
1Department of Chemistry,
Technical University of Cluj-Napoca,
400641 Cluj-Napoca, Romania
Tel: 4 0264 401775
Fax: 4 0264 415054
E-mail: lori@chimie.utcluj.ro Financial support: The research supported by the UEFISCSU Romania through research grants ID_458 & ID_1051. Received August 6, 2007 / Accepted January 4, 2008 Code Number: ej08041 Abstract The toxicity of thirty para-substituted phenols on Tetrahymena pyriformis was modelled using an original methodology that uses the complex structural information of the compounds. Two models were built. The methodology allows atomic properties to be assigned to toxicity based on the selection of pairs of descriptors from the entire family, which is called Molecular Descriptors Family (MDF). One model has two independent structural descriptors and the other has four. The model with four descriptors proved to have high estimated and predictive abilities (over 97% of toxicity could be explained by structural information). The partial charge distribution by bonds (molecular topology) and space (molecular geometry) interaction proved to be related with the toxicity of para-substituted phenols on Tetrahymena pyriformis. The predictive ability of the model was tested by using the following methods: the cross-validation leave-one-out and the training versus test experiments. The comparisons among the models were performed using the correlated correlations method. The embedding of the complex information from the structure using MDF methodology can lead to further investigations of the mechanism of chemicals toxicity on Tetrahymena pyriformis. Keywords: para-substituted phenol derivatives, structure-activity relationships, Tetrahymena pyriformis, toxicity.
The development of information and computing technologies have led to the development of structure-activity/property relationships (qSARs) methods with focus on informatics and modelling (Diudea et al. 2001). The qSARs methods are used for the quantitative characterization of the relationships between the structure of compounds and their activity or property in many fields such as: drug design (Duch et al. 2007; Prathipati et al. 2007), environmental sciences (Li and Xi, 2007; Knauer et al. 2007; Jager et al. 2007), biotechnology (Li et al. 2007), and all the fields of chemistry (Niu et al. 2007; Malík et al. 2007; Scotti et al. 2007; Lubbers et al. 2007). The toxicity of para-substituted phenols on Tetrahymena Pyriformis (a non-pathogenic unicellular protozoan) was studied by many researchers. The toxicity has been analyzed by using the octanol/water partition coefficient (Schultz, 1987a), the hydrophobicity/ionization surface (Schultz, 1987b; Schultz et al. 1996), electrophilicity (Roy et al. 2006). Different approaches have been used: quantitative neighbourhoods of atoms (Lagunin et al. 2007), core electron binding energy (Takahata et al. 2007), quantum topological molecular similarity (Loader et al. 2007), neural networks (Ivanciuc, 1998) or back propagation artificial neural networks (Yang et al. 2006). The main objective of the present study was to characterize the toxicity caused by para-substituted phenols on Tetrahymena pyriformis by using the molecular descriptors family on the structure-activity relationships approach. This approach proved its estimated and predictive abilities on different classes of chemical compounds, both on properties and activities (Jäntschi and Bolboacă, 2007). Materials and Methods A sample of thirty para-substituted phenols (HO-C6H4-R) was included into the study. The experimental toxicities on Tetrahymena pyriformis (Toxexp), expressed as the logarithm of the inverse of the IGC (inhibitory growth concentration) value in mmol/l, were taken from a previously reported research (Schultz, 1987b). The MDF on the SARs (Jäntschi, 2004; Jäntschi, 2005) was applied. This method included the following six steps: Step 1: The topological (2D) and geometrical (3D) model of investigated para-substituted phenols was obtained using the HyperChem software. The geometry of the compounds was optimized by applying the semi-empirical Extended Hückel model (Hoffmann, 1963) and the quantum mechanics model (Cornell et al. 1995). The output files were stored as *.hin files. Step 2: The experimental data were collected and were stored into a *.txt file. Step 3: It includes the construction, generation, calculation and filtration of the molecular descriptors family. The *.hin files, which contain information about the topology, geometry and charges distribution for each para-substituted phenol, represented the primary data file required to construct, generate, and calculate the molecular descriptors family. A set of five PHP programs generated the MDF for para-substituted phenols: ▪ 0_mdf_prepare.php creates the structure of tables for the investigated compounds; ▪ 1_mdf_generate.php generates the MDF of the para-substituted phenols and stores them into a table; ▪ 2_mdf_linearize.php applies the linearizing operator and stores valid records into tables; ▪ 3_mdf_bias.php sorts the descriptors by squared correlation coefficient and deletes identical entries; ▪ 4_mdf_order.php orders the descriptors from highest to lowest by the squared correlation coefficient again and creates a new table. The results are stored on a FreeBSD server from IntraNet [IP 172.27.211.5] using a MySQL database server. Each molecular descriptor has a name consisting of seven-letters that describes the modality of its construction. The description of each possible character is presented in Table 1.
Step 4: It searches and identifies the most significant SAR models. The following criteria were used (Bolboacă and Jäntschi, 2007): the squared correlation coefficient (value closed to 1 indicates a good model), the standard error of estimated (value closed to 0 indicates a good model) and statistical parameters associated with the model (the Fisher parameter, which has a less than 5% probability of type I error, confidence intervals for the intercept and slope, standard error of intercept and slope, student parameter and its probability of type I error). Step 5: The models were validated in order to characterize their estimated and predictive abilities. The leave-one-out cross-validation analysis (Baumann, 2003) was conducted (Leave-one-out Analysis, 2005). The obtained score (abbreviated as r2loo-cv), the standard error of predictive and the Fisher parameter were obtained and interpreted. Step 6: The analysis of the models was performed by assessing the following: ▪ model stability (the model is considered more stable if the difference between the squared correlation coefficient and the cross-validation leave-one-out score is closer to 0) ▪ predictive ability of the model with the higher squared correlation coefficient was assessed in training and test experiments (Training vs. Test Experiment, 2005), ▪ comparison with previously reported models (where appropriate) through a correlated correlation analysis (Steiger, 1980). A difference between the squared correlation coefficient (r2) and the leave-one-out cross-validation score (r2loo-cv) lower than 0.3 indicates the absence of an over fitted model, irrelevant independent variables, and/or outliers (Bolboacă and Jäntschi, 2007). Moreover, in order to identify the outliers in the investigated compounds, the graphical representation methods were used (Bolboacă and Jäntschi, 2007). Note that the MDF SAR approach uses a genetic algorithm for selection of descriptors from descriptor’s pool (Jäntschi et al. 2007). Results By integrating the complex knowledge extracted from the structure of the studied para-substituted phenols, two SAR models were identified, one with two and the other with four descriptors: Ŷ2v = -2.261 + 0.037·ASMmVQt - 0.216·lfDdOQg [1] Ŷ4v = -3.295 + 0.035·ASMmVQt - 0.326·lfDdOQg + 0.079·InMrLQg - 0.346·LsDMpQg [2] where: Ŷ2v = toxicity estimated by Eq(1); Ŷ4v = toxicity estimated by Eq(2); ASMmVQt, lfDdOQg, InMrLQg, and LsDMpQg = molecular descriptors. The values of the experimental determinations (Toxexp), of the calculated descriptors and of the toxicity estimated by Eq(1) and Eq(2) are presented in Table 2.
The values of the squared correlation coefficients between each descriptor and the experimental toxicity (Toxexp) as well as between pairs of descriptors were as follows: SAR
model with two descriptors - Eq(1): SAR model with four descriptors - Eq(2): The statistics associated with the models with two - Eq(1) - and four - Eq(2) molecular descriptors are presented in Table 3.
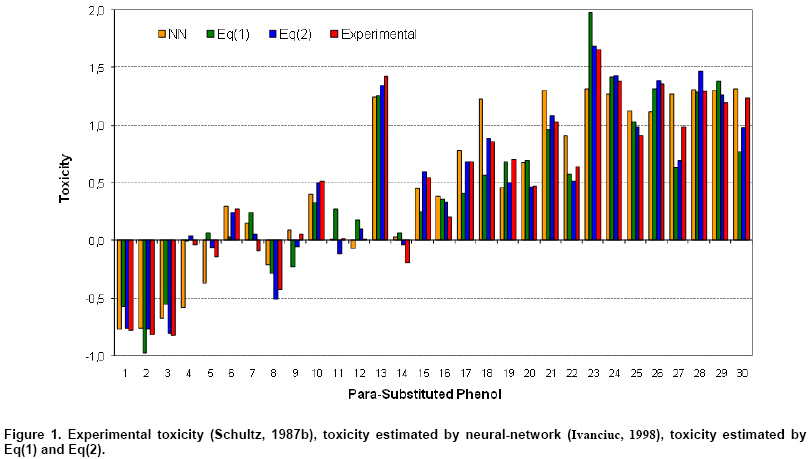
The graphical representation of the relation among the estimated toxicity of para-substituted phenols on Tetrahymena Pyriformis by Eq(1), Eq(2), neural network (Ivanciuc, 1998) and experimental toxicity (Schultz, 1987b) is presented in Figure 1. The statistics on the similarity of the activity estimated by Eq(1) (Ŷ2v-Eq(1)) and by Eq(2) (Ŷ4v-Eq(1)) as well as the experimental toxicity (Toxexp) of para-substituted phenols are presented in Table 4. In Table 4 the best estimation values, expressed as the lowest value of the difference between experimental and estimated toxicity, are shaded in gray.
The validation results of the model with four descriptors in training versus test experiments (for the sample size that varied from 18 to 22 in training) are presented in Table 5.
The comparison between the SAR model with four descriptors and the previously reported MLR (Multiple Linear Regression, (Ivanciuc, 1998)) and Neural Network (NN, (Ivanciuc, 1998)) models is presented in Table 6.
Discussion The integration of the structural information obtained from the para-substituted phenol compounds allows the estimation and prediction of toxicity on Tetrahymena pyriformis. Two models proved to have good estimated and predictive abilities (one model with two (Eq(1)) and the other with four descriptors (Eq(2)). The analysis of the results presented in Table 2 reveals the influence of the substituent on the toxicity of para-substituted phenols. Thus, the phenyl group determined a higher toxicity of para-substituted phenols (between 1.01237 for 4-hydroxybenzophenone - compound no. 21, Table 2, and 1.6547 for 4- hydroxybenzene - compound no. 23, Table 2). A high toxicity is also determined by the nitro group, as in the case of the 4-nitrophenol (1.4257, Table 2). Both SAR models were statistically significant, the significance level being lower than 0.0001 (Table 3). In toxicity modelling, three descriptors refer to molecular geometry (lfDdOQg, InMrLQg and LsDMpQg) and one refers to molecular topology (ASMmVQt). All descriptors consider the partial electric change as the atomic property (ASMmVQt, lfDdOQg, InMrLQg, LsDMpQg). The values of the correlation coefficient obtained by the model with two descriptors (r = 0.9472, Table 3) sustain the role of these two descriptors in the estimation of toxicity. Almost ninety percent of the toxicity variation of the studied para-substituted phenols can be explained by its linear relationship with the ASMmVQt and the lfDdOQg descriptors. The prediction ability of the model with two variables is sustained by the results obtained in leave-one-out cross-validation analysis: leave-one-out cross-validation score (r2loo-cv = 0.8745, Table 3), standard error of predicted (sloo = 0.2613, Table 3), Fisher parameter and associated significance (ppred = 7.58·10-13, Table 3). The analysis of the model with two variables showed that molecular descriptors are not able to provide individually relevant models (Eq(3)). Note also that there is no collinearity between the descriptors used by the model with two descriptors (r2(ASMmVQt, lfDdOQg) = 0.12152). The model with two variables reveals that the toxicity of the studied para-substituted phenols on Tetrahymena pyriformis is of geometrical and topological nature and it is also dependent on partial electric changes. Both descriptors used by the model with two descriptors are found again in the model with four descriptors (Eq(2)). Ninety-seven percent of toxicity variation of the para-substituted phenols could be explained by its linear relationship with the molecular descriptors used by this model. The value of the multiple correlation coefficient (r = 0.9868, Table 3) supports the estimated ability of the SAR model. The predictive ability of the model with four descriptors is supported by the following: the value of the leave-one-out cross-validation score (r2loo-cv = 0.9650, Table 3), the type I error of the Fisher parameter (ppred = 1.50·10-21, Table 3), the standard error of predicted (sloo = 0.1429, Table 3) and the stability of the model (r2 - r2loo-cv = 0.0086, Table 3). No significant correlation was identified neither between the descriptor and the experimental toxicity nor between the pairs of descriptors (Eq(4)). The toxicity of the para-substituted phenols on Tetrahymena pyriformis is of geometrical and topological nature. It is also dependent on the partial electric charge of the compounds. The analysis of the results presented in Table 4 indicates that the best proximity of the estimated and experimental toxicity was obtained by the SAR model with four variable (on twenty-one out of thirty compounds the estimated value was in the proximity of the experimental value), followed by the model with two variables (five compounds out of thirty obtained the best proximity) and the neural network (Ivanciuc, 1998) (four compounds out of thirty obtained the best proximity). The predictive ability of the model with four descriptors was studied on training and test sets. With one exception, all investigated sample sizes obtained statistically significant models at a significance level of 1% (Table 5). The exception was observed in the experiment with twenty-one compounds in the training set and nine compounds in the test set. For this model the type I error was of 1.4·10-2 and 1.6·10-14, respectively. The average of the squared correlation coefficient obtained in training sets was almost identical with the average of the squared correlation coefficient in the test sets (0.971 vs. 0.972, Table 5). The dispersion of the correlation coefficients in both sets was low (see Table 5). The above mentioned results support the validity of the SAR model with four descriptors as well as its power of predicting the toxicity of para-substituted phenols. The molecular descriptors of a new para-substituted phenol could be calculated using the online DC Demo Calculator (DC Demo Calculator, 2005). Therefore the 2D and 3D structure of the compound has to be constructed using the HyperCem software. As result, the calculate values of the molecular descriptors are displayed. Moreover, the 2D and 3D structure of a new para-substituted phenol could be used in order to predict its activity (MDF SAR Predictor, 2005). The following steps must be followed: ▪ selecting the name of learning set (RRC443_ for the para-substituted phenols set); ▪ selecting the predictor equation (the model with two or four molecular descriptors); and ▪ browsing and submitting the *.hin file of the new compound proposed for investigation. Consequently, the equation used for prediction, the calculated values of the molecular descriptors family on the structure-activity relationships for the new compound as well as the activity predicted by the model are displayed. The comparison between the SAR model with four descriptors and the previously reported models (Ivanciuc, 1998) (Table 6) showed that the probability of coincidence between the SAR model and the MLR model is of 1.14·10-2, while that between the SAR model and the NN model is of 4.51·10-2. It can be concluded that the correlation coefficient obtained by the SAR model with four descriptors is significantly higher compared with the correlation coefficients obtained by the previously reported models (Ivanciuc, 1998). Many approaches have been developed in order to translate the chemical information of a compound into a useful numerical value (Todeschini and Consonni, 2000). The radial basis functions (Hemmer et al. 1999), GATEWAY (Consonni et al. 2002), 3-MoRSE electron diffraction (Todeschini and Consonni, 2000) and other descriptors represent similar approaches. These approaches are useful for further investigations if their application leads to significant statistical models. The difference between models in terms of structure-activity relationships could then be investigated using the correlated correlation analysis (Steiger, 1980). The above-mentioned results support the estimated and predictive abilities of the SAR model with four descriptors to characterize the toxicity of para-substituted phenols on Tetrahymena pyriformis. In conclusion, the toxicity of the studied para-substituted phenols on Tetrahymena pyriformis is of both geometrical and topological nature and depends on the partial electric charges of the compounds. Furthermore, the application of the SAR method in the modelling of the para-substituted phenols toxicity on Tetrahymena pyriformis could be the first step in discovering and characterizing new compounds. Such further investigations could lead to the discovery of compounds with higher activity at lower costs. References
Note: Electronic Journal of Biotechnology is not responsible if on-line references cited on manuscripts are not available any more after the date of publication. Supported by UNESCO / MIRCEN network © 2008 by Pontificia Universidad Católica de Valparaíso -- Chile The following images related to this document are available:Photo images[ej08041f1.jpg] | |||||||||||||||||||||||||||||||||||||||||||||||||||||||||||||||||||||||||||||||||||||||||||||||||||||||||||||||||||||||||||||||||||||||||||||||||||||||||||||||||||||||||||||||||||||||||||||||||||||||||||||||||||||||||||||||||||||||||||||||||||||||||||||||||||||||||||||||||||||||||||||||||||||||||||||||||||||||||||||||||||||||||||||||||||||||||||||||||||||||||||||||||||||||||||||||||||||||||||||||||||||||||||||||||||||||||||||||||||||||||||||||||||||||||||||||||||||||||||||||||||||||||||||||||||||||||||||||||||||||||||||||||||||||||||||||||||||||||||||||||||||||||||||||||||||||||||
| |||||||||
