 |
| About Bioline | All Journals | Testimonials | Membership | News |
|
||||||
|
||||||
Electronic Journal of Biotechnology, Vol. 12, No. 1, January 15, 2009 RESEARCH ARTICLE RAPD analysis of seized marijuana (Cannabis sativa L.) in Turkey Emine Pinarkara1 , Seyit A. Kayis*2 , Erdogan E. Hakki3, Ayla Sag4
1Department of Animal Sciences
Biometry-Genetics Unit,
Faculty of Agriculture,
Selcuk University, 42075,
Campus, Konya, Turkey,
Tel: 903322232811
Fax: 903322410108
E-mail: eminepinarkara@hotmail.com Financial support: The Scientific and Technical Research Council of Turkey (TUBITAK-Kariyer-104O547) and the Scientific Research Coordination Center of Selcuk University (BAP-07201006) are gratefully acknowledged for their supports. Received April 4, 2008 / Accepted October 16,2008 Code Number: ej09005 Abstract Cannabis sativa L. is a multiple-use plant. However, its cultivation is strictly controlled due to its psychoactive nature and usage in producing drugs such as marijuana, and hashish. In this study, psychoactive type Cannabis samples, which were seized from 29 different locations of Turkey, were used. Interests were to identify the genetic relatedness of the seized samples and to partition molecular variance between and within populations. Randomly Amplified Polymorphic DNAs were employed for analysis based on single plant material and bulked samples of them. Data were analysed via cluster and principal coordinate analyses (PCoA). Analysis of molecular variance (AMOVA) was performed to obtain variations between and within populations. Cannabis accessions were basically separated into two main groups by PCoA and cluster analyses according to geographical regions. One of them was made up of Cannabis plants, which were seized from mostly western part of Turkey (group 1). The other one was made up of Cannabis plants that were seized from mostly eastern part of Turkey (group 2). It is found that 20.23% of the genetic variation is due to differences between accessions groups while 79.77% of the genetic variation is due to between accessions within accessions groups. Compared to group1, group 2 showed more variation. Keywords: AMOVA, cluster analysis, individualization of seized marijuana, principle coordinate analysis, randomly amplified polymorphic DNA, UPGMA.
Cannabis sativa L. is thought to have originated from the Central Asia regionand has since been distributed worldwide by humans (Small and Cronquist, 1976). It is a plant that provides food and oil from its seeds, fiber for rope, fabric from its stems, and psychoactive drugs from its flowers and leaves. Hemp seeds oil can also be used for fuel and as raw material for plastics (Ranalli and Venturi, 2004) as well as feed for livestock or as a fertilizer (Karus and Vogt, 2004). Beside the economical properties, mentioned above, some varieties of Cannabis have psychoactive potency as well. Cannabis plants that contain low Δ9-tetrahydrocannabinol (THC), a low THC:Cannabidiol (CBD) ratio and are cultivated for fiber and/or achenes (e.g. seeds) are called hemp. On the other hand, Cannabis plants that have high THC content, high THC:CBD ratio and are used for their psychoactive potency are known as marijuana (Alghanim and Almirall, 2003; Elsohly and Slade, 2005; Hillig, 2005). For hemp, EU has assigned the upper levels of THC and CBD to THC ratio as 0.2% and 2%, respectively. In many countries, including Turkey, possession and cultivation of Cannabis was either ceased or limited because of its potential use as a drug. When samples of suspect materials are recovered, they must be tested for the presence of controlled substances (e.g. marijuana). In addition to the identification of marijuana samples, it is desirable but difficult to link individual growers and distributors to specific illicit field and greenhouse operations. Molecular genetics may offer solution in identification and individualisation via investigating the genetic relatedness between individuals/populations. Jagadish et al. (1996) were able to distinguish between the samples from distinct sources in a randomly amplified polymorphic DNA (RAPD) assay conducted with 51 C. sativa samples. Genetic analysis using in combinations of RAPD and restriction fragment length polymorphism (RFLP) methods were also found to be useful in distinguishing between drug type, fiber type and intermediate drug type strains (Shirota et al. 1998). Hakki et al. (2003) used RAPD and amplified fragment length polymorphisms (AFLP) markers to fingerprint the 18 different Cannabis individuals from five different locations representing 3 geographical regions of Turkey. In another study, it was reported that it was possible to discriminate illegal, potent marijuana cultivars from hemp plants by using AFLP markers (Datwyler and Weiblen, 2006). In a preliminary work conducted with three strains of C. sativa from different sources, Kojoma et al. (2002) reported that different samples were identified by means of inter simple sequence repeats (ISSR). In a recent study by using ISSRs marijuana (Cannabis sativa L.) was separated efficiently from hemp (Hakki et al. 2007). Gillan et al. (1995) reported the differentiation of C. sativa samples with the use of RAPDs when HPLC analysis was inefficient. Faeti et al. (1996) assessed genetic diversity of C. sativa cultivars/accessions (from 5 European countries, and one accession from Korea) by using RAPD markers and high levels of polymorphism were reported. In a study of genetic structure and degree of variability of six C. sativa L. varieties via RAPD markers, it was reported that 5 varieties were properly identified with the scored loci (Forapani et al. 2001). Hsieh et al. (2003) investigated the usage of short tandem repeat (STR) loci in identification of Cannabis samples and predicting their genetic relationship. Alghanim and Almirall (2003) were developed STR markers for Cannabis. They reported that STR markers were very effective in uniquely identifying 27 profiles of the Cannabis samples tested and useful for DNA typing and genetic relatedness analyses. Gilmore and Peakall (2003) isolated microsatellite markers in Cannabis sativa L. which have utility for characterizing genetic diversity in cultivated and naturalized Cannabis populations. Gilmore et al. (2003) reported that STR markers are capable of discriminating among individuals and varieties of Cannabis. RAPD markers were used to individualize Palo Verde tree in a criminal case (Yoon, 1993) and strawberry in a civil case (Congiu et al. 2000). In both cases the method has been accepted in court although, in the Palo Verde tree case the statistical significance was not used since the representative population consists of too few samples. Congiu et al. (2000) employed RAPD markers for individualization of strawberry because of its two main advantages: it allows random sampling of markers over whole genomic DNA and does not require any previous information on the genome of the organism under investigation. Although RAPD marker analysis has reproducibility problem, it is inexpensive, simple to perform, and has moderate ability to distinguish between unrelated individuals compared to AFLPs and STRs (Coyle et al. 2003). Therefore, the method can still be useful for individualization of Cannabis samples in the developing countries that have very limited lab facilities but majority of Cannabis production occur. The objectives of the present study were: 1) to analyze the high number of seized Cannabis samples by means of RAPD, 2) to compare two different approaches (in the first, a single plant represents an accession and in the second, a set of ten different plants of the same accession bulked equally represent the specific accession) for individualizing Cannabis accessions, 3) to obtain information on the genetic variation and relatedness which might be a useful information about the sources and distribution networks of these illicit substances. Materials and Methods Psychoactive Cannabis samples used in this study were seized from 29 different locations (C1-C29) representing geographically distinct and problematic areas of Turkey (western and eastern parts). Some of the materials, used in this study, were previously also utilized for discriminating drug type Cannabis from hemp types (Hakki et al. 2007). All the information relevant to the seized samples and accessions are shown in Table 1. Provincial locations of the seized Cannabis accessions are shown on a map of Turkey in Figure 1. Ten seeds were planted from each accession to produce material for DNA extraction. Plants were grown in a fully automated greenhouse.
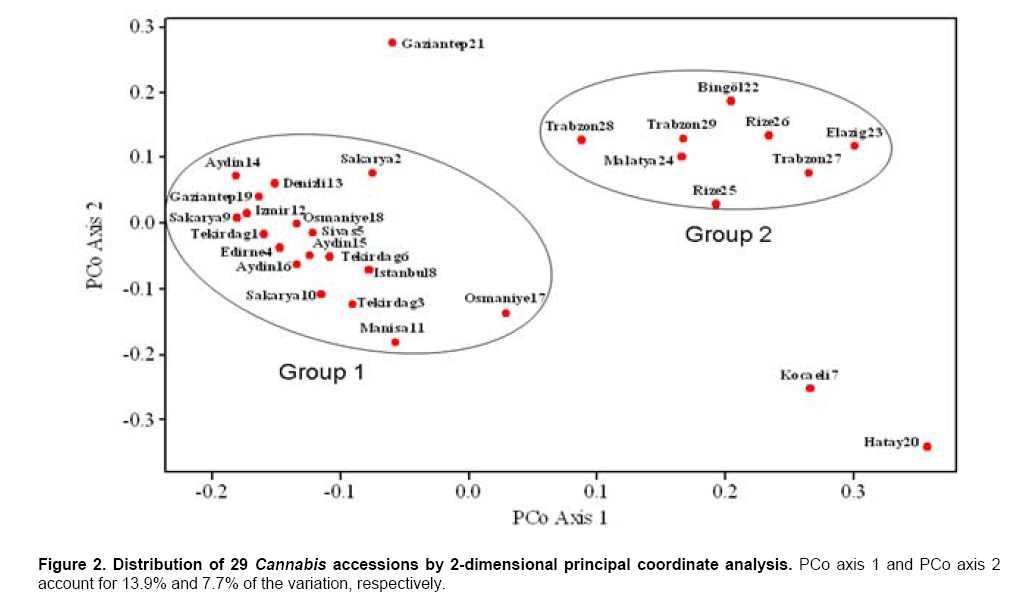
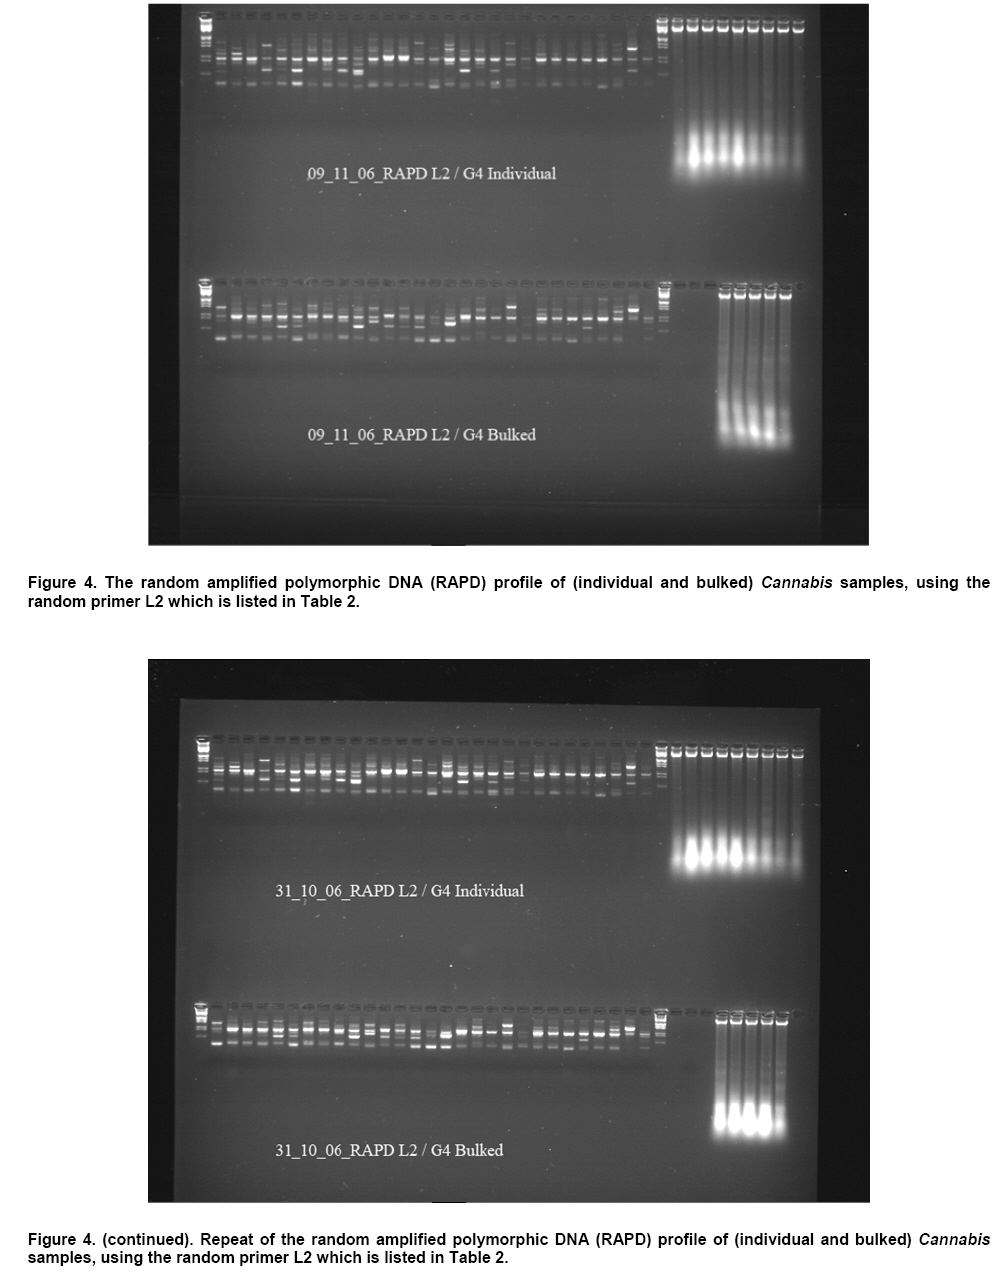
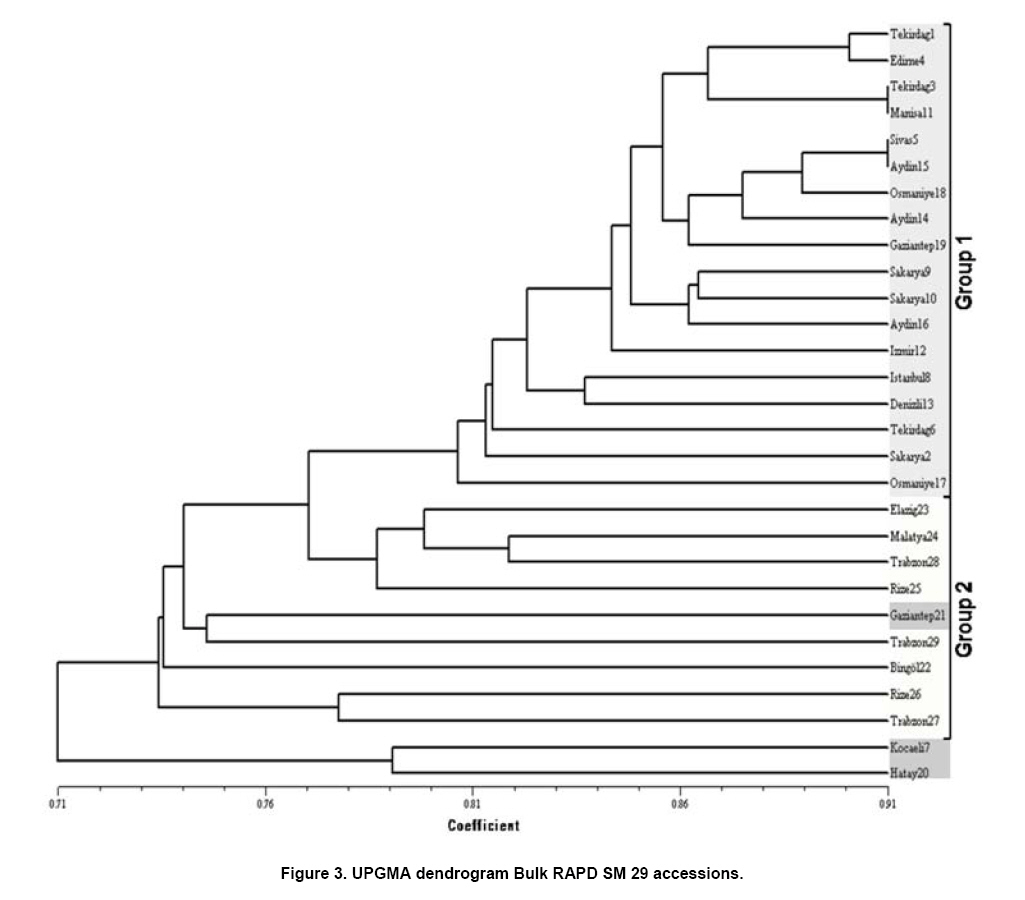
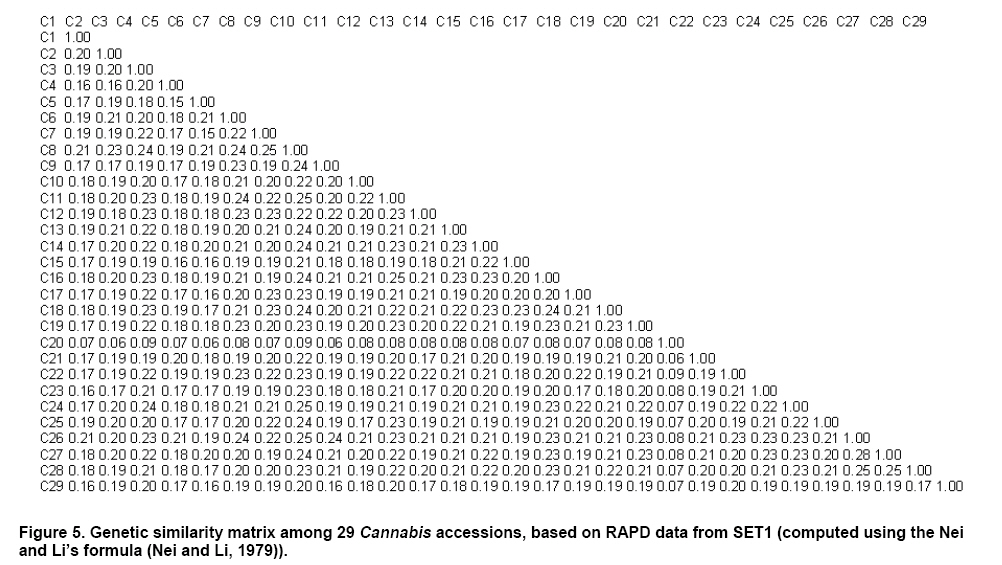
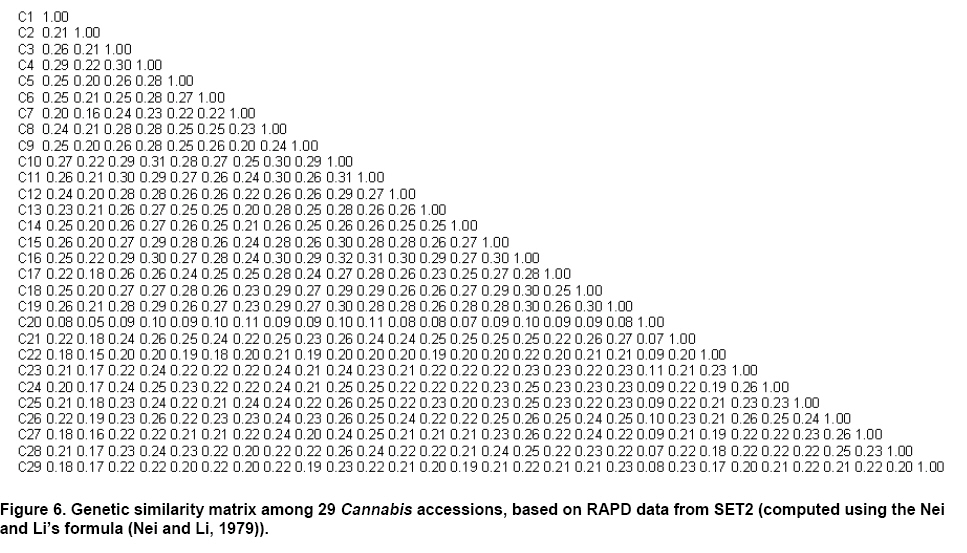
Leaves collected from three week old seedlings were shock-frozen in liquid nitrogen and stored at -80ºC until DNA isolations were performed. DNAs were extracted individually from a total of 290 samples. Total DNAs of the samples were extracted using a standard 2X CTAB protocol with minor modifications (Rogers and Bendich, 1988). For each accession, 100 mg of leaf sample from 10 different plants were used and DNAs were isolated individually. After concentrations were determined by an Eppendorf BioPhotometer, sample DNAs were diluted to the working concentration of 20 ng/µL. PCR amplification of the DNA with RAPD primers In this study, 22 arbitrary RAPD primers that gave the most informative patterns (in terms of repeatability, scorability and the ability to distinguish between individuals) were selected for identification (Table 2). Each reaction contained 2.5 mM MgCl2; 10 mM Tris-HCl (pH 8.8); 50 mM KCl; 0.8% Nonidet P40; 200 mM of each of the dNTPs; 0.5 µM primer; 20 ng DNA template and 0.3 units of Taq DNA Polymerase (Bioron) in a final reaction volume of 25 µl. After a pre-denaturation step of 3 min at 94ºC, amplification reactions were optimized for every individual primer and optimization was usually started by cycling the reaction 45 times at 94ºC for 1 min, at annealing temperature (Table 2) for 50 sec and 72ºC for 1 min in Eppendorf Mastercycler gradient thermocycler. A final extension was allowed for 10 min at 72ºC. Upon completion of the reaction, amplified products were loaded onto a 2.0% agarose/1x Tris-Borate EDTA gel and electrophoresed at 4 V/cm. In the RAPD assay, two sets of PCR amplifications were carried out. In the first set (SET1), each accession was represented by DNA of randomly selected an individual plant in that accession. In the second set (SET2), pooled DNA from all ten individuals in each accession was used (the one individual used in the first set was also included). Every primer was amplified for the two sets simultaneously. Then the resultant products were run in agarose gel and evaluated. Amplifications were repeated at least twice (in different time periods) for each primer, using the same reagents and procedure. Data collection and statistical analysis Each DNA fragment generated was treated as a separate character and scored as a discrete variable, using 1 to indicate presence, and 0 for absence. Accordingly, a rectangular binary data matrix was obtained and statistical analysis was performed using the NTSYS-pc version 2.1 (Rohlf, 2000) statistical package. A pairwise similarity matrix was generated using simple matching coefficient (by means of SIMQUAL procedure of NTSYS-pc) and principal coordinate analysis (PCoA) was performed using a batch mode of NTSYS-pc both for SET1 and SET2. Then, cluster analysis was performed (by means of SAHN procedure of NTSYS-pc) via unweighted pair-group method using arithmetic average (UPGMA) to develop a dendrogram both for SET1 and SET2. To estimate the strength of the grouping, generated by cluster analysis, bootstrap analysis was performed with 2000 replications using the winboot computer program (Yap and Nelson, 1996). Also, a matrix comparison of Mantel Z test (Mantel, 1967), for the correspondence of the similarity matrices of SET1 and SET2, was performed (by means of MXCOMP procedure of NTSYS-pc) for the null hypothesis that there is no association between the similarity matrices of SET1 and SET2. To obtain significance level, 5000 permutations were performed. In addition, a genetic similarity matrix was calculated according to Nei and Li, (1979). An analysis of molecular variance (AMOVA) was performed using GENALEX 6 (Peakall and Smouse, 2006) in SET2 to partition the total molecular variance between and within populations (clusters). Significance level was detected via permutation test (n = 1000). Cannabis clusters were defined according to the PCoA results (Figure 2). Cannabis accessions that do not cluster closely with any of the clusters were removed from data set before AMOVA. Results RAPD amplification and analysis The RAPD markers, used in the analysis of SET1 and SET2 allowed reproducible and informative polymorphisms (pictures of gels that were run at different time were given in Figure 4 for illustration purpose). Selected primers yielded a total of 264 bands in SET1, and 241 bands in SET2, 93% and 92% of which were polymorphic, respectively. However, using bulked samples resulted in much more consistent and reliable amplifications. The RAPD B1 primer was the one that gave the highest number of polymorphisms in SET1 and SET2. In the accession C20, that is the accession seized from Hatay, 119 markers were missing. This was due to lack of material to produce DNA from that accession. Results from statistical analysis of genotypic data Results from PCoA of RAPD markers by using SET2 showed that Cannabis accessions are basically separated into two main groups by PCo axis 1 (Figure 2). In fact, this separation was in agreement with the geographical regions of Turkey. The first group (group 1) was made up of Cannabis plants, which were seized from mostly western part (costal regions, namely Mediterranean, Aegean, and Marmara) of Turkey and there were 18 accessions. The second one (group 2) was made up of Cannabis plants that were seized from mostly eastern part of Turkey and there were 8 accessions. Accessions C21 (Gaziantep21), C7 (Kocaeli7), and C20 (Hatay20) were not attributable to any group and we named them as outliers. Compared to group 1, group 2 showed more variation. The genetic relationships among Cannabis accessions, in SET2, were presented in a dendrogram (Figure 3). Results of analysis of SET2 via cluster analysis and PCoA were slightly different. Group 1 Cannabis accessions in PCoA, were clearly grouped as one major branch with a similarity of 81% based on simple matching similarity index. However, part of Cannabis accessions in group 2 (Elazig23, Malatya24, Trabzon28, and Rize25) were attached to the cluster of group 1, and then the rest of group 2 were attached. Accession Gaziantep21, which was seen to be an outlier in the PCoA, took place in this group. Overall similarity, based on simple matching similarity index, was 71%. Unlike SET2, there was no separation in the seized Cannabis accessions in SET1 via either PCoA or cluster analysis. Therefore, no result from PCoA or cluster analysis is presented in here from SET1. Results from matrix comparison via Mantel Z test showed that there is a statistically significant association between the similarity matrices of SET1 and SET2 (P < 0.001). However, correlation between SET1 and SET2 was weak (r = 0.39). Genetic similarity matrices, calculated from SET1 and SET2 according to Nei and Li, (1979) were given in Figure 5 and Figure 6, respectively. Genetic similarity matrix for SET2 shows a similarity range from 0.05 to 0.32. The 0.05 level similarity was seen between the accessions C20 and C2. We note that the accession C20 is the one which has large number of missing marker genotypes, which most likely caused low similarity. Similarity range between the accession C20 and other accessions changed from 0.05 to 0.11. When the C20 is removed from the data set, similarity range changed from 0.15 to 0.32 with a mean of 0.24. The minimum similarity, 0.15, was between accessions C2 and C22 while the maximum similarity, 0.32, was between accessions C10 and C16. Genetic similarity matrix for SET1 shows a similarity range from 0.06 to 0.28. The 0.06 level similarities are seen between the accession C20 and accessions C2, C5, C9, and C21. When the C20 is removed from the data set, as in SET2, similarity range changed from 0.15 to 0.28 with a mean of 0.20. The minimum similarities are seen between accessions C4 - C5 and C5 - C7 while the maximum similarity, 0.28, was between accessions C27 and C28. Genetic distance matrices both from SET1 and SET2 show that the accessions tested in this study are divergent at the DNA level. Results from AMOVA indicated that 20.23% of the genetic variation is attributable to differences among accessions groups while 79.77% of the genetic variation is attributable to between accessions within accessions groups. Sum of squares in group 1 and group 2 were found to be 315.94 (n1 = 18) and 188.50 (n2 = 8), respectively. Detailed results from AMOVA were given in Table 3.
Discussion This study was conducted on two SET of Cannabis materials, by using RAPD markers, which were analyzed simultaneously. The degrees of polymorphism of the markers found were 93% for SET1 and 92% for SET2. Forapani et al. (2001) reported the degree of polymorphism of RAPD markers for different hemp varieties in a range from 31.1% to 97.1%, which includes our findings. Clusters were observed between the seized Cannabis accessions in SET2 via both cluster analysis and PCoA but not in SET1. A weak correlation, resulted from matrix comparison via the Mantel test between similarity matrices of SET1 and SET2, might be interpreted as a reason for not having similar results from SET1 and SET2. This might be due to the template effect, where amplification of faint fragments failed in bulked samples. Hence, more consistent bands were amplified and the specific accessions were better represented. In the PCoA of SET2, all accessions, except accessions Gaziantep21, Hatay20, and Kocaeli7, were clearly separated into two main groups. The first group was made up of Cannabis plants, which were seized from mostly western parts of Turkey, while the second group was made up of Cannabis plants that were seized from mostly eastern parts of Turkey. Visual examination of distribution of Cannabis accessions on the first two principal coordinates (Figure 2) indicates that there is more variation in group 2 compared to group 1. Averaged Nei and Li (1979) genetic similarity, which were found to be 0.263 and 0.220 for group 1 and group 2 respectively, supported visual examination. Findings from AMOVA supported these results by having estimated variances as 18.58 (with 17 degrees of freedom) and 26.92 (with 7 degrees of freedom) for group 1 and group 2, respectively. Results from AMOVA indicated that 20.23% of the genetic variation was attributable to differences among accessions groups while 79.77% of the genetic variation was attributable to between accessions within accessions groups. Datwyler and Weiblen (2006) identified geographic sources of seized drugs by using AFLP markers. In that study, 27.2% of the genetic variation from AMOVA was due to differences between drug and hemp lines, while 20.9% differences among hemp varieties. Our among group variation is comparable with their among hemp varieties variation. In a comparison study of six hemp types Cannabis varieties with RAPD markers, it is reported that the proportion of among-cultivars variance changed dramatically ranging from 12.8% up to 76%. The later was observed between two highly selected, divergent cultivars (Forapani et al. 2001). Results from UPGMA for group 2 was slightly different compared to PCoA, although accessions of the group 1 were clustered together in UPGMA. PCoA is a translation of similarities/dissimilarities between objects into the actual distances between objects in multidimensional space. On the other hand, in cluster analysis, once a group or cluster is formed from two or more objects, that group can not be broken later in the process. As a result, the dendrogram is not a representation of all pairwise dissimilarities between objects (Legendre and Anderson, 1999). Examination of UPGMA Dendrogram accession by accession would give information about relatedness in individual level. For example, 0.91 genetic relatedness was found between accessions C3 and C11, and C5 and C15 with a bootstrapping P value of 58.6% and 50.2%, respectively. These results might lead us to speculation that there might be relationship between the individual illicit Cannabis growers of accessions C3 and C11, and C5 and C15. It is worthy noting that these illicit products are not clonally propagated as they were grown from seeds. Therefore, we are not expecting accessions to have exactly the same genotypes. Acknowledgments This study is derived from MSc thesis of the first author. The authors thank Prof. Sait Gezgin for providing the controlled greenhouse while growing the plants. Authors thank to Istanbul, Izmir, Adana, Malatya, and Trabzon forensic departments for providing research material. References
Note: Electronic Journal of Biotechnology is not responsible if on-line references cited on manuscripts are not available any more after the date of publication. Supported by UNESCO / MIRCEN network © 2009 by Pontificia Universidad Católica de Valparaíso -- Chile The following images related to this document are available:Photo images[ej09005t1.jpg] [ej09005f5.jpg] [ej09005f3.jpg] [ej09005f2.jpg] [ej09005f4.jpg] [ej09005f1.jpg] [ej09005f6.jpg] |
| |||||||||
