 |
| About Bioline | All Journals | Testimonials | Membership | News |
|
||||||
|
||||||
Electronic Journal of Biotechnology, Vol. 12, No. 3, July 15, 2009 Analysis of diversity among six populations of Colombian mango (Mangifera indica L. cvar. Hilacha) using RAPDs markers Marcela Díaz-Matallana1 , Ingrid Schuler-García*2 , Manuel Ruiz-García3, Elizabeth Hodson de Jaramillo4 1 Unidad de Biotecnología Vegetal,
Departamento de Biología,
Facultad de Ciencias,
Pontificia Unidad Javeriana
Bogotá, D.C., Colombia Financial Support: Research Programme “Young Researchers and Innovators” (2003-2005), funded by COLCIENCIAS (Instituto Colombiano Francisco José de Caldas para el Desarrollo de la Ciencia y Tecnología) and Pontificia Universidad Javeriana, Bogotá, D.C. Received September 26, 2008 / Accepted April 13,2009 Code Number: ej09021 Abstract Currently in Colombia, there are only records of morph-agronomic characterizations of Mangifera indica cvar. Hilacha; molecular studies on this mango variety have not been carried out. The aim of this work was to identify the genetic diversity of six populations of mango Hilacha by RAPDs markers, as a fundamental base for breeding programs, conservation and selection of promissory materials for the fruit industry at the national level. From 60 primers evaluated in the populations, five primers were selected and were launched in the six populations. Polymorphic bands of RAPDs were transformed into binary matrices, which were then processed with NTSYS-PC, POPGENE and TFPGA softwares. The overall genetic diversity, HT = 0.468 ± 0.0016, is very similar to the average subpopulation genetic diversity, HS = 0.4431 ± 0.0024, which revealed a small genetic differentiation among the mango Hilacha populations studied (GST = 0.0532). This means that each population contained in average 95% of the total genetic diversity found in the global population analyzed. Considerable gene flow between populations (Nm = 9) was found. Finally, we recommend studying the genetic diversity of mango Hilacha populations with other molecular markers to complement the information obtained and to find similarities or differences with the results presented herein. Keywords: genetic variability, mango Hilacha, organoleptic quality, RAPDs.
Colombia has cultivars of mango introduced from many foreign countries and its own native cultivars. The introduced cultivars were Haden, Kent, Keitt, Ruby, Tommy Atkins, Van Dyke, Palmer, Irwin and Zill. The Criollas or Colombian varieties are Albania, Mariquita, ICA-1834, ICA-1835, ICA-1837, Sufaida ICA-1, Piq 693, Bocado de Reina, Lorito, Chancleto, Mango de Azúcar, Mango Manzanita and Mango de Hilacha, the latter known with diverse names like: Magdalena River (fruit commercial name, for its production in the Magdalena River watershed), Hilaza(o), Criollo, Mango de Puerco and Mango Común (CCI, 1998; Bernal et al. 1999). Most mango Hilacha trees are not found solely in commercial plantations; instead, trees are dispersed throughout the entire Colombian territory. Mango is used for human consumption mostly as fresh fruit (high contents of vitamins A, B, C, proteins and fiber), and as processed fruit (pulps, juices, sodas, etc). In immature state, it is suitable for elaborating flours for animal and human consumption (Rieger, 2006). The mango Hilacha possesses up to 21% of Brix grades (percentage of soluble solids), rendering it one of the most desirable fruits by the national industry of natural juices. The pulp of the mango Hilacha has been traded at the national level and exported mainly to the United States, Europe, Central America, the Caribbean, Canada and Japan (CCI, 1998; Vélez, 2000; Bavaria, 2007). Companies processing pulp export around 30,000 tons per year. Currently, the crop has been characterized in Colombia mostly at the morphological level. Although morphological characteristics are very useful, they are affected by the environment and they face heritability problems, while molecular markers are highly inheritable, are available at a high number and frequency, and exhibit enough polymorphism to discriminate against closely related genotypes (Stuber et al. 1999; Archak et al. 2003; Weising et al. 2005). Different markers exist such as RFLPs, AFLPs, VNTRs, SSRs and RAPDs. The latter, in accordance with Williams et al. (1990), receive particular attention for several reasons: 1) previous information on DNA sequences is not required for designing specific primers; 2) the technique does not involve costly steps as those of Southern transfer, hybridizations, or use of radioactive isotopes; 3) it is quick, simple and automated and it requires small quantities of DNA (5-10 ng for each reaction) 4) The markers are dominant, that is two phenotypes are distinguished at each locus, with a band and with no band (Weising et al. 2005). Several studies have been reported with different mango genotypes using RAPD (Schnell et al. 1995; López-Valenzuela et al. 1997; Kumar et al. 2001; Karihaloo et al. 2003), VNTRs, STRs (Schnell et al. 2005), ISTRs and AFLPs (Kashkush et al. 2001). Likewise, taxonomic studies have been carried out with the family Anacardiaceae and with Mangifera species based on pectin and phenolic compounds (Aguilar-Ortigoza et al. 2003; Berardini et al. 2005) and specific genomic sequences (Yonemori et al. 2002). The aim of this research was to identify the genetic diversity among six populations of Mangifera indica var. Hilacha using RAPDs located in four departments of Colombia, as an essential requirement for plant breeding programs, conservation, and selection of promissory materials (Krishna and Singh, 2007) for the juice industry at the national level. Materials and Methods Plant material was obtained from individuals of Mangifera indica cvar. Hilacha coming from four departments of Colombia (Tolima, Cundinamarca, Valle del Cauca and Cauca) and selected by a team of technical assistants of the company Productora de Jugos S.A. The sample consisted of 112 individuals, as follows: 19 individuals from the high production zone I (950 - 1300 m in altitude) in Tolima, 19 individuals from the high production zone I (950 - 1300 m in altitude) in Cundinamarca, 19 individuals from the low production zone II (300 - 1290 m in altitude) in Tolima, 19 individuals from the low production zone II (300 - 1290 m in altitude) in Cundinamarca, 18 individuals from the production zone (900 - 1400 m in altitude) in Valle del Cauca, 18 individuals from the production zone (900 - 1400 m in altitude) in Cauca. Mango trees were selected upon the following agronomic characteristics: well-formed tree-top with good symmetry, well-formed fruits, characteristics required in agro industrial processes, trees with low incidence of anthracnose and infestation of fruit flies, trees having a tradition of good production and trees adapted to the production areas, all of them more than 10 years old. Dry leaf tissue was macerated in liquid nitrogen, powdered PVP was added (40,000 MW) to counteract the phenols effect, and the powdered leaf tissue was stored at -70ºC. Six (6) extraction protocols reported in the literature that had been assessed previously in the Plant Biotechnology Unit of the U. Javeriana were evaluated: 1) Dellaporta’s method, modified version of Dellaporta et al. (1983); 2) Dellaporta’s method, modified version of Dellaporta et al. (1983) with the addition of RNAse (10 mg/ml); 3) method for coffee and cassava provided by IDEA; 4) QiaGen® DNAeasy Kit; 5) rice protocol, adjusted by González et al. (1995); and 6) Doyle and Doyle’s, adapted by Schnell et al. (1995) and Doyle and Doyle (1990). Three individuals were selected from each department to find the protocol that best allowed obtaining DNA free of impurities and showing good quality for PCR amplification. The first protocol was chosen for the extraction of DNA. Extracted DNA was stored at -20ºC. DNA quality was evaluated using 1) 1% agarose gel electrophoresis prepared in TBE 1X, stained with ethidium bromide 0.5µg/ml, and 2) the purity relationship OD260/OD280 obtained by spectrophotometry. The extracted DNA was quantified [µg/ml] using a spectrophotometer (BioSpec-1601 Shimadzu®) with absorbance values of 260 and 280 nm. DNA amplification conditions of PCR-RAPDs The genomic DNA was analyzed using RAPDs molecular markers (Williams et al. 1990; Schnell et al. 1995). We standardized the DNA amplification conditions by assessing the following: DNA concentration, primer concentration; different brands, concentrations and storage time of the Taq polymerase, as well as temperatures for PCR amplification 25 µl-reactions of PCR contained: 25 ng of DNA, 0.25 mM of dCTP, dGTP, dATP and dTTP respectively; 2.5 mM of MgCl, 1 U of Taq polymerase Invitrogen® and Promega® and 7 µM of primer. Thermocycler (Biorad MyCycler®) was programmed for 34 cycles, with a denaturating step of 30 sec, 94ºC, an annealing temperature of 40ºC for 30 sec, and an extension step at 72ºC for 1 min. Sixty Operon® RAPD’s primers were evaluated: Kit A (1-20), Kit B (1-20), OPAA6, OPAB11, OPAB14, OPAC4, OPAC7, OPAC10, OPAD1, OPAD4, OPAD10, OPAD14, OPAG6, OPAG8, OPAH5, OPAH10, OPAM4, OPAM10, OPAM13, OPAN5, OPAN8 and OPAN17. Two individuals from each department were taken to select the primers that generated a good polymorphism level. A negative control and two positive controls were included (Curatella americana and a rice variety). From the 60 primers that were evaluated in the six populations, 10 did not amplify, 18 produced a low amplification, 11 primers were monomorphic, and 16 were polymorphic. Five (5) primers were selected from the 16 primers that were polymorphic (Table 1) and were therefore launched in the populations. The amplification products were run in 1.5% agarose gels prepared in TBE 1X, stained with ethidium bromide [0.5 µg/ml] and a voltage of 4-5 V/cm was applied to the electrophoretic horizontal camera (Gibco® Horizon 20-25) for 2 hrs. Subsequently, the amplified products were visualized and photographed with the Gel Doc XR System (BioRad®).
The first statistic estimated was the expected heterozygosity (H) index. This statistic is important as a genetic variability measure because it is independent of the heterozygote individuals observed and therefore it is independent from positive or negative selection for homo and/or heterozygotes and from the reproductive strategies within a population. Differences among heterozygosity estimates were statistically analyzed with a Student t test for sample pairs. The heterozygosity data were arcsine transformed prior to analysis, as proposed by Archie (1985). A Nei's (1973) genetic diversity analysis was carried out to determine the genetic structure of the populations analyzed. The GST statistic was used to measure the genetic differentiation between subpopulations relative to the genetic diversity in the total population. An estimate of theoretical gene flow (Nm) was obtained using the GST statistic following an infinite island model (Ruiz-Garcia et al. 2006), where Nm = ¼ ((1/GST) - 1). Another measure applied to determine genetic heterogeneity among the populations was the Wright's FST statistic using the Weir and Cockerham (1984) procedure and the Weir (1990) nomenclature (FST = θ). Jackknife over loci was applied to obtain a variance estimate of θ and bootstrap over loci was applied to generate 95% confidence intervals. 1,000 replications were done to carry out these Jackknife and bootstraps. Exact tests with 1,000 demorizations, 10 batches and 2,000 permutations per batch were applied for all the samples taken together and among population pairs to determine the probability of significant heterogeneities. The Nei's (1978) genetic distance was used to obtain genetic relationships among population pairs. The UPGMA and the neighbor-joining algorithms were applied to this genetic matrix to obtain phenograms where the global genetic relationships among the populations could be observed. All the analyses described were carried out with the TFPGA ver. 1.3, POPGENE ver. 1.32 and NTSYSpc ver. 2.02j softwares. Results and Discussion The evaluation of six extraction protocols showed that the modified protocol of Dellaporta et al. (1983), allowed obtaining a good quality DNA, which was confirmed by the electrophoresis with agarose gels where good quantity of DNA and no degradation were observed. It is necessary to point out that the DNA extracted using the Doyle and Doyle’s modified protocol and the Qiagen® Kit, also presented good concentrations and was observed free of impurities in the agarose gel. Out of the 60 primers that were evaluated in the six populations, 16 primers were polymorphic and five (5) primers were finally chosen (Table 1) because of their reproducibility. The same patterns of bands were evident when contrasting the banding patterns obtained in the selection gels vs. the banding patterns generated by the primers applied to the study collections. 20 polymorphic bands were produced with the five primers. In general, reproducibility problems have been reported with RAPDs (Yu et al. 2002; Weising et al. 2005) and this was observed in our laboratory. For this reason, two amplification reactions were run separately with each primer and only the reproducible bands were considered. The levels of genetic diversity were high and extremely similar within each sample analyzed and no significant differences were detected among them when a Student t test with transformed arcsine data was applied (maximum value in Cundinamarca II, unbiased heterozygosity, h = 0.476 and minimum value in Tolima II, h = 0.392). Globally, the average unbiased genetic diversity was high (h = 0.4683 ± 0.038). Therefore, none of the populations studied seemed to be affected by evident genetic drift, founder effects or bottleneck events and gene flow seems to be important enough to homogenize all the populations with a similar level of genetic diversity. This was verified by the application of the Nei’s (1973) genetic diversity analysis (Table 2). The overall genetic diversity, HT = 0.468 ± 0.0016, is very similar to the average subpopulation genetic diversity, HS = 0.4431 ± 0.0024, which revealed a small genetic differentiation among the mango Hilacha populations studied (GST = 0.0532). This means that each population contained in average 95% of the total genetic diversity found in the global population analyzed. This agrees quite well with the gene flow estimate obtained following the infinite Wright's island model, Nm = 8.89. This amount is very considerable. Recall that Ruiz-Garcia et al. (2005) showed that if Nm > 1 (in an infinite island model) or Nm > 4 (in a stepping-stone model), the gene flow is sufficient to attenuate the genetic differentiation between populations balanced for migration and genetic drift. According to the infinite island model, if 1 < Nm < 0.5, genetic differentiation among populations could be small but important in a stepping-stone model. When Nm < 0.5, populations are largely unconnected under any gene flow model. In our case, Nm was near 9, which denoted a very high gene flow among the populations studied. Slatkin and Barton (1989) showed that the method employed herein is robust, regardless the geographical location of the populations, the absence of gene drift-gene flow equilibrium or, even under the presence of natural selection affecting some marker. High gene flow is correlated with elevated levels of genetic diversity in populations (Ruiz-Garcia et al. 2006). In the case of mango Hilacha, flying pollinators (mango is an allogamus, cross-pollinated species) and, especially, human intervention by transferring specimens from one population to another (Nybom and Bartish, 2000; Kiambi et al. 2005; Ward et al. 2005) may explain the high levels of gene flow detected.
The application of a hierarchical population model to obtain the θ (= FST) statistic with the Weir and Cockerham’s (1984) procedure showed a similar result. The overall value of θ = 0.0354 ± 0.0114 obtained by jackknifing over loci and the 95% confidence interval, 0.06 - 0.015, with 1,000 bootstrapping over loci replicates, produced values nearly identical to that obtained with the GST statistic (Table 2). According to Wright (1978), FST values ranging from 0 to 0.05 indicate little or very little genetic differentiation, from 0.05 to 0.15 indicate moderate differentiation, from 0.15 to 0.25 indicate considerable genetic differentiation, and above 0.25 indicate very large genetic heterogeneity. The results obtained were consistent with null or very little genetic differentiation among the mango Hilacha populations studied. The application of exact tests for genetic heterogeneity among population pairs also yielded a limited number of significant cases for several bands but not globally in neither case. The significant cases were as follows: among Cundinamarca I and Tolima I, the 4th band of OPAC-7 (p = 0.0417), among Cundinamarca I and Tolima II, the 1st m band of OPAM-4 (p = 0.0159), among Cundinamarca I and Valle, the 5th band of OPAC-7 (p = 0.0238), among Cundinamarca II and Tolima II, the 4th band of OPAB-14 (p = 0.0482), among Tolima I and Tolima II, the 2nd band of OPAG-6 (p = 0.0481), among Tolima I and Valle, the 5th band of OPAC-7 (p = 0.0291), among Tolima II and Valle, the 4th band of OPAB-14 (p = 0.0463), the 5th band of OPAC-7 (p = 0.0075) and the 2nd band of OPAG-6 (p = 0.0152) (this was the pair case with most significant band differences, but overall there were no significant differences between both populations, (p = 0.3277), and among Tolima II and Cauca, the 4th band of OPAB14 (p = 0.0071). The results of the unbiased Nei’s (1978) genetic distance among population pairs are shown in Table 3. The highest genetic distance pairs were between Tolima II and Valle (D = 0.0848), Cundinamarca I and Tolima II (D = 0.0730) and Tolima I and Tolima II (D = 0.0616). Therefore it is evident that Tolima II is the most differentiated of all the samples studied. Hernández et al. (2008) analyzed estimates of genetic differentiation in the allopatric speciation processes in diverse insect species. The local populations of a determined species showed an average Nei’s genetic identity of I = 0.967 ± 0.006, which is noteworthy similar to that detected herein (I = 0.9695 ± 0.0254). Among subspecies and incipient species, the mean Nei’s genetic identities were 0.795 ± 0.013 and 0.798 ± 0.026, respectively. Therefore, our mango Hilacha populations clearly correspond to populations of a same evolutionary lineage. That is, they are samples of a unique real population.
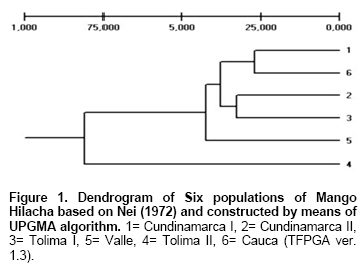
The UPGMA phenogram with the Nei’s distance showed Tolima II as the most differentiated population, meanwhile Cundinamarca I and Cauca, firstly, and Cundinamarca II and Tolima I, secondly, showed strong relationships among them (Figure 1). Concluding Remarks Characterization of diversity is a necessary requirement for the improvement, use and conservation of plant genetic resources (Archak et al. 2003; Mignouna et al. 2003; Mohammadi and Prasanna, 2003; Weising et al. 2005; Krishna and Singh, 2007). RAPDs markers were used in this study because they allow estimating genetic diversity among organisms with unknown previous genetic information (Williams, 1990); in fact, the present investigation is the first report on the structure of the genetic diversity in the mango cultivar Hilacha in Colombia. The high gene flow value observed in this work is seriously affecting the genetic diversity among mango Hilacha populations. It is probably caused by both insect pollinators and human intervention by repeatedly transferring materials from one population to another. Moreover, the high genetic diversity within populations is explained by the breeding system since mango is an allogamous species (Kiambi et al. 2005; Ward et al. 2005). The little genetic heterogeneity, in general, can also be due to the fact that this study focused only in a mango variety and not in other mango varieties. It is highly recommended to use other combinations of RAPDs and other molecular markers such as AFLPs (Kashkush et al. 2001) and SSRs (Duval et al. 2005; Schnell et al. 2005), with the purpose of finding similarities or differences and to supplement the information provided by this study. Moreover, the inclusion of material from Antioquia where mango Hilacha is also present, must be considered in future studies. Finally, for any future breeding programs of mango Hilacha and its conservation in Colombia, it is worthy to note that all the mango trees sampled possess a field number record kept by Productora de Jugos S.A. and therefore the geographical location of the sampled individuals is also known. Acknowledgements Authors wish to thank the technical assistants of Productora de Jugos S.A. for supplying the samples, agriculture, climatic data and the organoleptic analysis; Gerardo Gallego, Myriam Cristina Duque (Biotechnology Unit, CIAT), Silvia Restrepo (Universidad de los Andes, Bogotá) for their contributions to this work; and Sandra Constantino for corrections to the English manuscript. References
Note: Electronic Journal of Biotechnology is not responsible if on-line references cited on manuscripts are not available any more after the date of publication. Supported by UNESCO / MIRCEN network © 2009 by Pontificia Universidad Católica de Valparaíso -- Chile The following images related to this document are available:Photo images[ej09021t3.jpg] [ej09021t1.jpg] [ej09021f1.jpg] [ej09021t2.jpg] |
| |||||||||
