 |
| About Bioline | All Journals | Testimonials | Membership | News |
|
||||||
|
||||||
Electronic Journal of Biotechnology, Vol. 13, No. 3, May 15, 2010 Report Assessment of genetic diversity among Pakistani wheat (Triticum aestivum L.) advanced breeding lines using RAPD and SDS-PAGE Muhammad Farooq Ahmed1 , Muhammad Iqbal*2, 3Muhammad Shahid Masood, 4Malik Ashiq Rabbani, 5Muhammad Munir 1, 3, 4 Institute of
Agricultural Biotechnology & Genetic
Resources,
National Agricultural Research Centre,
Islamabad, Pakistan Financial support: The authors are grateful for financial support from Pakistan Agricultural Research Council under the Research for Agricultural Development Program. Code Number: ej10023 Abstract Genetic diversity was assessed among 32 advanced wheat breeding lines included in the National Uniform Wheat Yield Trials (2006-07) of Pakistan using molecular (DNA) and biochemical (SDS-PAGE) markers. Of the 72 RAPD primers used for initial screening, 15 were found polymorphic. A total of 140 bands (61.4% polymorphic) were generated by the 15 random decamer primers. Genetic similarity coefficients ranged from 0.81 to 0.94 for rainfed and from 0.70 to 0.93 for the normal seeding date group. Cluster analysis using the unweighted pair group method of arithmetic averages (UPGMA) clustered the 32 advanced wheat breeding lines into one major and three small groups. Maximum level of polymorphism (90%) was observed for the primer OPA-05. Lines N9 and N11 showed the least genetic similarities (0.70-0.82 and 0.71-0.83, respectively) with rest of the lines studied. Line RF1 had the maximum similarity (0.81-0.94) with other lines. Wheat lines included in the normal seeding date were relatively distantly related than those in the rainfed group. Seed storage protein analysis produced 19 subunits ranging from 29-120KDa. Similarity coefficients ranged from 0.53 to 1.0 for the normal seeding date and from 0.47 to 1.0 for the rainfed group. High molecular weight subunits (particularly 120KDa) showed greater polymorphism than the lower molecular weight subunits. Narrow genetic base was observed in wheat lines included in the rainfed group. DNA fingerprinting of advanced breeding lines may help to avoid release of varieties with narrow genetic base in the future. Keywords: genetic diversity, molecular markers, polymorphism, RAPD, SDS-PAGE, wheat.
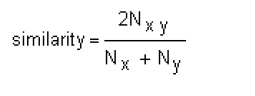
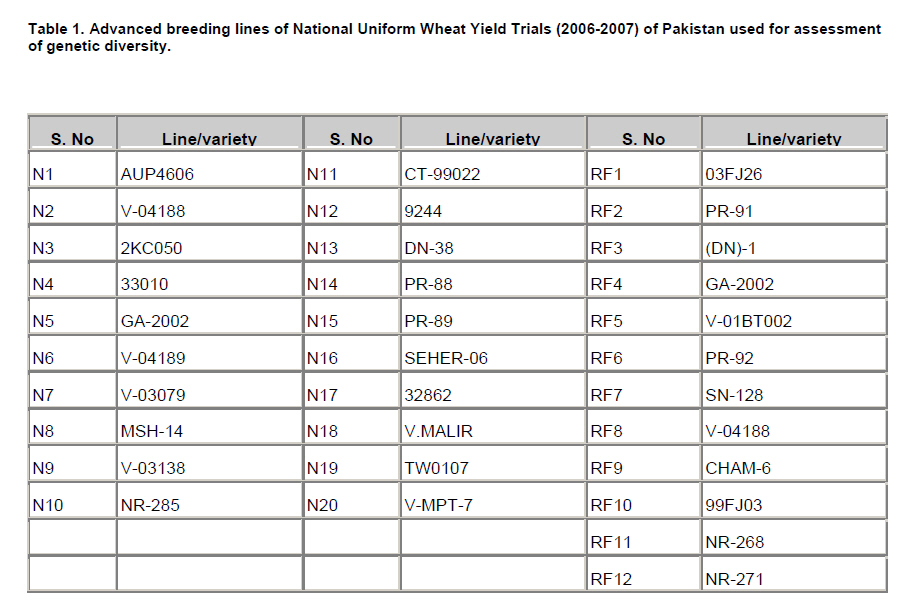
Genetic diversity is one of the key factors for the improvement of many crop plants including wheat. Plant breeders rely on the availability of genetic diversity during selection in cultivar development. The efficiency of genetic gain by selection can be improved if the patterns of genetic diversity within a population of breeding lines are known. Genetic similarity/distance estimates among genotypes are helpful in the selection of parents to be used in a breeding program (van Becelaere et al. 2005). Varieties developed with wider genetic base may be helpful in enhancing the yield under various agro-climatic conditions (Asif et al. 2005). Diverse genetic base may also resist the spread of diseases (Zhu et al. 2000) in approved varieties. The study of genetic diversity is also important for varietal identification, proper purity maintenance, for the implementation of plant variety protection rights and export under WTO regulations. Genetic diversity can be assessed from pedigree analysis, morphological traits or using molecular markers (Pejic et al. 1998). However, diversity estimates based on pedigree analysis have generally been found inflated and unrealistic (Fufa et al. 2005). Genetic diversity estimates based on morphological traits, on the other hand, suffer from the drawback that such traits are limited in number and are influenced by the environment (Maric et al. 2004). Molecular markers are useful tools for estimating genetic diversity as these are not influenced by environment, are abundant and do not require previous pedigree information (Bohn et al. 1999). Among the biochemical markers, sodium dodecyl sulphate polyacrylamide gel electrophoresis (SDS-PAGE) has been widely used due to its simplicity and effectiveness for estimating genetic diversity. Among the different DNA marker types, random amplified polymorphic DNA (RAPD) markers have frequently been used for genetic analyses (Langridge et al. 2001) due to simplicity, efficiency and non requirement of sequence information. RAPDs have been widely used for identification of genotypes in crop plants, for investigating the genetic variability within species and to show relationships among populations (Freitas et al. 2000). Seed protein patterns obtained by electrophoresis have been widely used to assess genetic diversity in wheat (Shuaib et al. 2007; Sultana et al. 2007) due to its simplicity and effectiveness. Seed storage proteins have also been recommended as reliable genetic markers for characterizing wheat varieties based on bread-making quality (Fufa et al. 2005). Molecular analysis along with morphological data can help in the registration and certification of advanced breeding lines as commercial varieties with diverse genetic base. Variability estimates can guide plant breeders to select genotypes with diverse genetic base for use in their breeding programmes. The objective of the present study was to assess the level of genetic diversity in the gene pool of the national uniform wheat yield trials (NUWYT) using RAPD and SDS-PAGE. Materials and MethodsGenetic diversity was assessed among 32 advanced breeding lines included in the normal seeding and rainfed groups of the NUWYT of Pakistan (Table 1). Seeds of these lines were acquired from the Wheat Program at National Agricultural Research Center (NARC), Islamabad. Genomic DNA was isolated from mature seeds of 32 wheat breeding lines using the procedure developed by Kang et al. (1998) with slight modification. After quantification, DNA samples were diluted to working concentration of 10 ng/ul. Reaction mixture of 20 ul was prepared containing 1x PCR buffer with (NH4)2SO4, 3mM MgCl2, 0.2mM dNTPs mix, 20 pmol RAPD primer, one unit of Taq DNA Polymerase (Fermentas, life sciences) and DNA template of 10 ng. Seventy two decamer oligonucleotide primers were initially used for RAPD analysis. Amplification was carried out in an automated MyGeneTM Series Peltier Thermal Cycler (MG96G) at 94°C for 5 min, followed by 40 cycles each consisting of three steps; one step of denaturation at 94°C for 1 min, one step of annealing at 36°C for 1 min and an extension step for 2 min at 72°C. The last step was followed by a final extension of 10 min at 72°C. Amplified products were electrophoresed on a 1.5% agarose gel stained with Ethidium Bromide and subsequently visualized using a Gel Documentation system. Variability of total seed storage proteins was investigated by using SDS-PAGE (Laemmli, 1970). Protein was extracted from dry seed by grinding it to a fine powder. An appropriate quantity (0.01 g) of this powder was taken in a 1.5 ml Eppendorf tube. Protein extraction buffer (400 ul) containing 0.05M Tris-HCl (pH 8.0), 0.4% SDS, 5M Urea and 1.5% 2-Mercaptoethanol then was added to the tube. The sample was vortexed for 10 min followed by centrifugation at 12000 rpm for 10 min at room temperature. The proteins extracted in the supernatant were size fractionated using SDS-PAGE (9.5% Acrylamide) and stained with Coomassie Brilliant Blue (CBB) dye. After destaining, gels were photographed by placing them on white light. A matrix (for RAPD, SDS-PAGE and both combined) was generated by scoring reproducible bands as 1 for their presence and as 0 for their absence across the lines. Genetic similarity coefficients were computed following Nei and Li (1979) as under:
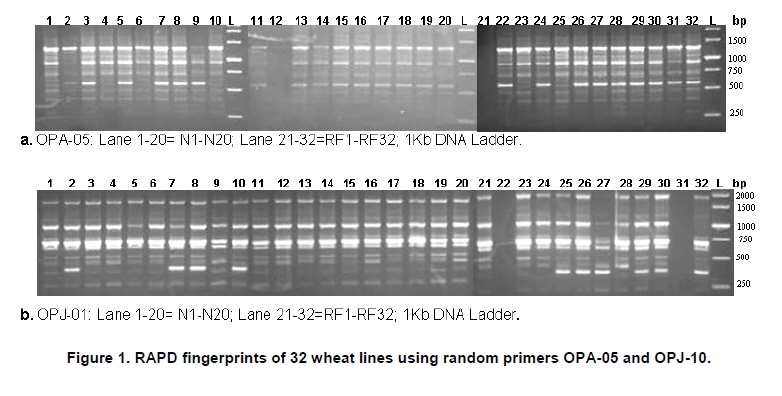
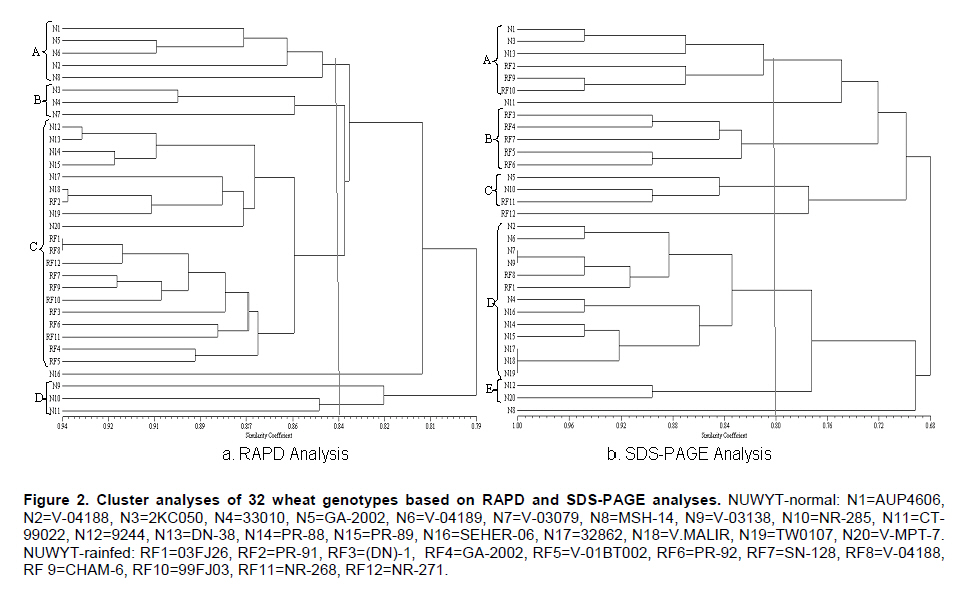
where 'Nx' and 'Ny' are number of bands present in genotypes 'x' and 'y', respectively; and Nxy are the number of bands shared by the cultivar 'x' and 'y'. The data were subsequently used to construct a dendrogram using the unweighted pair group method of arithmetic averages (UPGMA) (Sneath and Sokal, 1973) employing sequential, agglomerative hierarchic and non-overlapping clustering (SAHN). All the computations were carried out using the software NTSYSpc (Numerical Taxonomy and Multivariate Analysis System), version 2.1 (Rohlf, 2000). Correlations coefficients were calculated using similarity coefficients obtained from RAPD, SDS-PAGE and combined RAPD and SDS-PAGE analyses. Results All the 72 RAPD primers initially tested produced amplifications but only few primers generated polymorphic banding patterns. Finally 15 primers, OPA-05, 10, 11; OPB-01, 04, 11; OPC-07, 10; OPD-08, OPF-15, OPJ-01, OPK-02, 08, 12 and 15 (Table 2) were selected for the analysis of genetic diversity on the basis of polymorphism obtained. A total of 140 bands were generated by the 15 selected random decamer primers, 86 of which were polymorphic (Table 2). The number of fragments for these primers ranged between 4 and 14 with size ranging from 300 bp to 2000 bp. An electrophorogram showing fingerprinting from some varieties is given in Figure 1. Maximum level of polymorphism (90%) was observed for the primers OPA-05 and OPK-08. Genetic similarity coefficients grouped the 32 genotypes into four clusters at 0.84 coefficient level (Figure 2a). Cluster A comprised of 5 lines from the normal seeding date group. Cluster B comprised of 3 lines from the normal seeding date group. All the 12 lines of rainfed and 8 of the normal seeding grouped in the major cluster C. Similarity coefficients ranged from 0.81 to 0.94 for rainfed and from 0.70 to 0.93 for the normal seeding date group (Table 3). Lines N9 and N11 showed the least genetic similarities (0.70-0.82 and 0.71-0.83, respectively) with rest of the lines studied. Line RF1 had the maximum similarity (0.81-0.94) with other lines. Lines included in the normal seeding date were relatively distantly related than those in the rainfed group. Electrophorograms showing the protein banding patterns of wheat lines included in the normal seeding and rainfed groups are given in Figure 3. A total of nineteen bands were scored among the 32 wheat lines studied. Of these 19 bands, 14 were polymorphic giving 73.4% polymorphism. Size of the protein bands generated by SDS-PAGE (measured by protein standard marker ranging in molecular weight from 10-220KDa) ranged from 29-120KDa. Maximum polymorphism was observed with high molecular weight glutenin subunits (HMW-GS) proteins in both groups of advanced breeding lines showing decreasing trend toward the low molecular weight (LMW) proteins (Figure 3). The diversity at HMW proteins is reported to be the result of gene silencing in these proteins (Lawrence and Sephered , 1980). A HMW subunit of 120KDa showed maximum variation among NUWYT-normal and NUWYT-rainfed lines. This subunit existed only in four lines among NUWYT-normal lines. The lower molecular weight glutenin subunits (LMW-GS) have molecular weights close to that of the monomeric gliadin storage proteins, and, therefore, it is difficult to identify LMW-GS variation using total protein extracts by SDS–PAGE. At LMW of 29-40KDa, three protein subunits which may either be LMW-GS, Gliadins or Secalins showed no polymorphism among 32 lines. Shuaib et al. (2007) also observed maximum diversity for HMW-GS as compared to LMW-GS. The results from comparison with standard molecular weight revealed that lines N2 and RF7 contained 17 subunits of size in the range described above followed by the N9, N7, N16, and RF6 each contained 15 subunits. Lowest number of subunits (11) was produced by N3. Genetic similarity coefficients grouped the 32 genotypes into five clusters at 0.80 coefficient level (Figure 2b). Clustering of genotypes was quite different from the one revealed in RAPD analysis. Cluster A comprised of 6 lines, 3 each from the normal seeding date and rainfed groups. Cluster B comprised of 5 lines from the rainfed group. Thirteen lines, two of which were from rainfed group, constituted a major cluster D. Similarity coefficients ranged from 0.53 to 1.0 for the normal seeding date and from 0.47 to 1.0 for the rainfed group (Table 4). Line N1 held the similar position as it did in RAPD analysis (Figure 2). Lines, N1 and N8, showed maximum divergence from each other (Figure 2). Two commercial varieties which were used as check showed 68.4% similarity with each other. NUWYT-normal lines, N7 & N9, N17, N18 & N19 showed 100% similarity with each other showing reduced level of polymorphism in the genetic make up. DiscussionThe present study revealed a low level of genetic diversity within the two groups of advanced wheat breeding lines, especially those of the rainfed group. This indicated the low genetic base of the advanced breeding lines tested. Low level of polymorphism has been previously reported in wheat using RAPD (Sun et al. 2003). Sun et al. (2003) reported 63% polymorphism in 35 wheat varieties using RAPD-PCR. Mukhtar et al. (2002) observed 64% polymorphism using 50 RAPD primers in 20 Pakistani wheat genotypes. In the present study, 61% polymorphism was observed for 32 wheat genotypes using 15 RAPD primers. Most of the wheat lines used in the present study are derived from CIMMYT material and have common ancestors in their pedigrees. About 30% of the lines have “Pastor” in their parentage. The other common parents that some of these lines have are “Attila” and “Kauz”. These lines do not differ greatly on the loci for which amplification was observed, probably due to the common parentage. Another possible reason of low polymorphism can be that RAPD primers may amplify same size fragments from different genomic regions, particularly in wheat due to its hexaploid genome. This may result in the overestimation of genetic similarity coefficients as fragments from different genomic regions will be scored the same due to same size. The two marker systems used in this study were compared using various parameters like percentage polymorphism, similarity matrices and clustering of the genotypes. A low level of correlation was observed between these two marker systems. RAPD similarity coefficients ranged from 0.75 to 0.94 with 61% polymorphism whereas similarity coefficients showed a wider range (0.47-1.0) in case of SDS-PAGE analysis with 73.6% polymorphism. Similarity coefficients from the combined RAPD and SDS-PAGE analysis were highly correlated (r = 0.93) with those of RAPD analysis. However, similarity coefficients from the combined analysis were not significantly correlated with those of SDS-PAGE (r = 0.23). This indicated that RAPD is probably more desirable for analyzing genetic diversity. However, the high correlation between RAPD and combined analysis may be due to the larger number of loci analyzed for RAPD (140) compared with the lower number for SDS-PAGE (19). This coupled with the fact that the HMW-GS showed greater polymorphism in the studied material, suggests that seed storage protein profiles could be useful markers in the studies of genetic diversity and classification of adapted cultivars, thereby improving the efficiency of wheat breeding programs in Pakistan. Fufa et al. (2005) reported that seed storage protein was the major determinant of end-use quality (a highly selected trait), and that genetic diversity estimates based on seed storage protein were, therefore, lowest. However, the present study showed relatively higher degree of divergence among wheat lines based on seed storage protein than RAPD analysis. The possible reasons for the high polymorphism obtained for SDS-PAGE in the present study could be due to assessment of genetic diversity based on the total seed protein as well as the DNA marker system used in the present study. As gliadins/secalins are selectively neutral, genetic diversity based on these is relatively higher than that of HMW-GS. Also, RAPD marker system was used in the present study, which may amplify similar size fragment from different genomic regions, resulting in the underestimation of genetic diversity. Despite of lower diversity revealed, these findings have important implications for wheat breeding. In the future, varieties with broader genetic base should be approved to overcome the reduced crop production. Phenotypic selection of lines on the basis of few morphological characters may result in approval of cultivars with lesser variability because of the influence of environment on growth and development. Molecular markers such as RAPD and seed storage protein analysis and subsequent banding patterns should be included in the testing of advanced breeding lines. This will not only help in the development of wheat varieties with wider genetic base but will also generate fingerprints of such varieties. The latter will be helpful in the identification of varieties in relation to plant variety protection rights and export under WTO regulations. References
Note: Electronic Journal of Biotechnology is not responsible if on-line references cited on manuscripts are not available any more after the date of publication. Copyright © 2010 by Pontificia Universidad Católica de Valparaíso -- Chile The following images related to this document are available:Photo images[ej10023t3.jpg] [ej10023t2.jpg] [ej10023f2.jpg] [ej10023f3.jpg] [ej10023f1.jpg] [ej10023t4.jpg] [ej10023t1.jpg] |
| |||||||||
