 |
| About Bioline | All Journals | Testimonials | Membership | News |
|
||||||
|
||||||
Electronic Journal of Biotechnology, Vol. 13, No. 3, May 15, 2010 Short Communication Sugar cane bagasse as feedstock for second generation ethanol production. Part I: Diluted acid pretreatment optimization Gabriel J. Vargas Betancur1 , Nei Pereira Jr.*2 1Laboratórios de Desenvolvimento de
Bioprocessos,
Departamento de Engenharia
Bioquímica,
Escola de Química, Centro de
Tecnologia,
Universidade Federal do Rio de
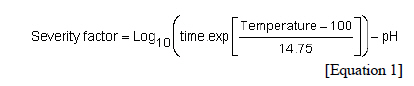
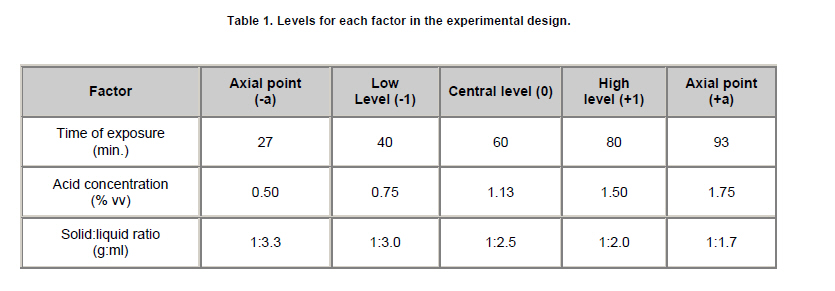
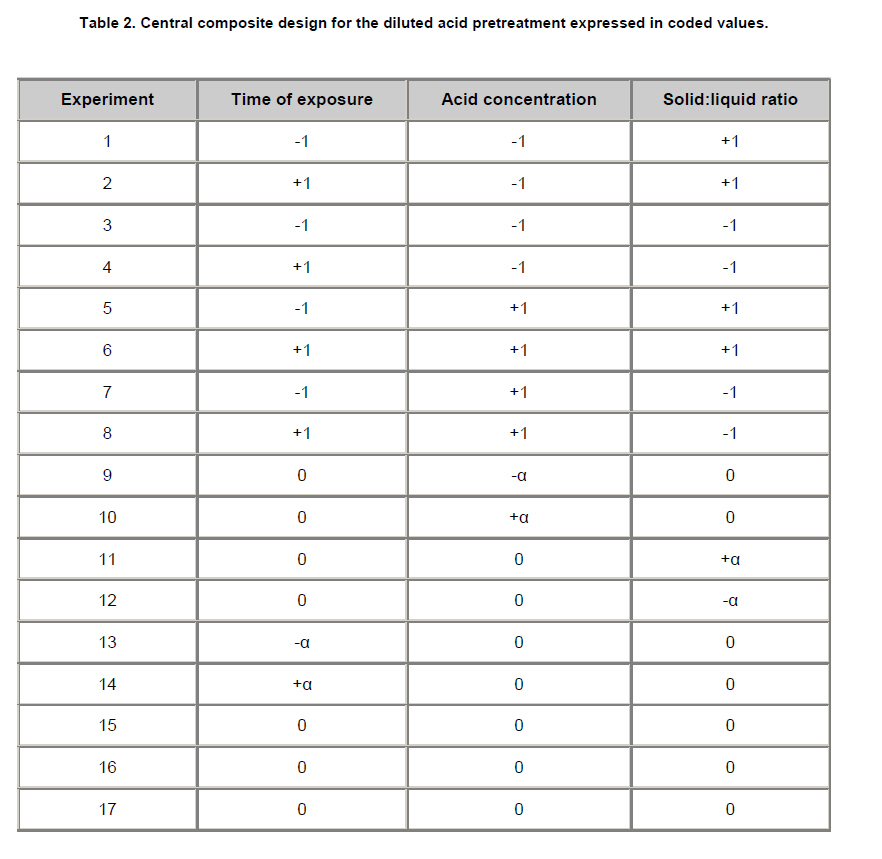
Janeiro, Brasil Website: www.ladebio.org.br Financial support: Brazilian Council for Research (CNPq) and Brazilian Oil Company Research Center (PETROBRAS). Code Number: ej10032 Tons of sugar cane bagasse are produced in Brazil as waste of the sugar and ethanol industries. This lignocellulosic material is a potential source for second-generation ethanol production. Diluted acid hydrolysis is one of the most efficient pretreatments for hemicellulosic solubilization. The hydrolysate obtained is rich in xylose, which can be converted to ethanol by Pichia stipitis. This work used a statistical approach and the severity factor to investigate the effects of factors associated with the diluted acid hydrolysis process (acid concentration, solid:liquid ratio and time of exposure) on various response variables (xylose concentration, hydrolysis yield, inhibitor concentration and hydrolysate fermentability). The severity factor had a strong influence on the generation of inhibitors. The statistical analysis was useful for determining the effects of the individual factors and their interactions on the response variables. An acid concentration of 1.09% (vv), an S:L ratio of 1:2.8 (g:ml), and an exposure time of 27 min were established and validated as the optimum pretreatment conditions for the generation of hydrolysates with high xylose concentration and low contents of inhibitors. In such conditions, hydrolysate with 50 g/l of xylose was obtained. Keywords: hemicellulose hydrolysis, severity factor, xylose. Dependence on petroleum remains the most important factor affecting the worldwide distribution of wealth, global conflicts and the quality of the environment. Population growth and the associated demand for fuel and goods coupled with more restrictive environmental regulations have intensified the research and development of renewable energy feedstocks to substitute for and/or to complement fossil fuel sources (Pereira et al. 2008). Biotechnology offers alternatives for the development of the biomass industry based on lignocellulosic (LC) feedstocks for energy supply and the production of chemicals. A relatively new concept called the LC Biorefinery establishes a selective separation of residual biomass fractions and processes them in accordance with their chemical characteristics and the desired target products (Lynd et al. 2005). In this context, lignocellulosic materials, especially agroindustry residues, have been the subject of intense research since they are renewable sources of carbon and energy that are available in large quantities. The integrated and rational utilization of these abundant feedstocks can revolutionize a variety of industries, including liquid fuels, food, fodder and chemicals, and thereby bring immeasurable benefits, especially to countries with extensive regions of high biological productivity such as Brazil. Sugar cane bagasse is the main Brazilian agroindustrial residue, being produced at approximately 250 kg per ton of sugar cane. In spite of the great potential of this residual biomass of lignocellulosic composition (60-70% carbohydrates) for the production of fuels and chemicals, the majority of it is burned in sugar mills and alcohol distilleries for energy generation, and a smaller fraction is used for animal feeding; however there is still some surplus (Zanin et al. 2000; Wyman et al. 2005). Additionally, with the increase in cane production in response to the growth of global ethanol demand (from 66 to 125 million m3 between 2008 and 2020), more bagasse will be available (Pandey et al. 2000; Balat and Balat, 2009). Sugar cane bagasse is mainly composed of two polysaccharidic fractions (cellulose and hemicellulose) and a polyphenolic macromolecule (lignin). The more abundant component is cellulose (33-36%), a polysaccharide consisting of a linear chain of several highly organized β(1→4)-linked D-glucose units that generates crystalline regions and consequently increases resistance to the hydrolytic process. Hemicellulose is the second predominant fraction (28-30%), and it possesses a heteropolysaccharidic composition that varies according to the source. Sugar cane bagasse hemicellulose is composed of heteroxylans, with a predominance of xylose, which is configured in a chain that can be chemically hydrolyzed more easily than cellulose. The polyphenolic fraction, called lignin, is a complex structure formed by the polymerization of aromatic alcohols that, when combined with the hemicellulose, covers the cellulose matrix, conferring resistance to enzymatic and chemical degradation (Sun and Cheng, 2002; Ververis et al. 2007). For the integral utilization of lignocellulosic feedstock, it is necessary to develop a pretreatment process for the selective and efficient fractionation of its main polysaccharide components, which should undergo hydrolysis to generate a high concentration of sugar monomers. These sugar monomers can be used as substrates (building-blocks) for biotechnological and chemical processes (Mussato and Roberto, 2002). The selective separation of hemicellulose can be performed using various pretreatments, such as ammonia fiber explosion (AFEX), alkaline humid oxidation (WAO), sodium hydroxide explosion (SHFEX), calcium hydroxide (Lime), Organosolv, steam explosion (STE), diluted acid hydrolysis (DAH) and liquid hot water (LHW) (Baudel et al. 2005; Mosier et al. 2005). Each pretreatment provides particular characteristics to the obtained phases, with the main purpose being to increase the susceptibility of the solid phase to enzymatic hydrolysis, and in some cases to make available the monomeric sugars of the hemicellulose. Among these treatments, acid hydrolysis stands out when compared with non-catalytic pretreatments because it allows for the generation of a liquid phase (hemicellulose hydrolysate) rich in xylose and with minor amounts of lignin derivatives that can inhibit cell metabolism relative to the levels seen with alkaline and organic pretreatments (Lavarack et al. 2002; Fogel et al. 2005; Gámez et al. 2006). Additionally, xylose, the main hemicellulose-derived pentose, and hexose may be degraded during acid hydrolysis into furfural and 5-(hydroxymethyl) furfural (hydroxymethylfurfural), respectively, which are also reported to be inhibitors of cell metabolism (Balat et al. 2008). This work aimed to characterize the individual effects of sulfuric acid concentration, solid:liquid (S:L) ratio and the time of exposure, as well as their synergic effects, on hydrolysate composition using severity factor expression and statistical approach. For this, a central composite design was constructed using response variables such as xylose concentration, concentration of inhibitors in the generated hydrolysates. Materials and MethodsDiluted acid pretreatment/hydrolysis The diluted acid hydrolysis was performed using a central composite design with the following factors: time of exposure, concentration of sulfuric acid and solid-liquid ratio. The temperature was kept constant at 121ºC. The level for each variable and the full experimental matrix expressed in coded values are shown in Table 1 and Table 2, respectively. After acid pretreatment, the liquid phase (hemicellulose hydrolysate) was separated from the solid by a pressure filter set within the reaction system (Santa Anna et al. 2007). Then, the pH of the liquid phase was adjusted to 6 by addition of Ca(OH)2, and the generated CaSO4 was separated by filtration. The liquid phase, called hemicellulose hydrolysate, had its sugar and inhibitor contents determined. Xylose concentration in the hydrolysates was determined by high performance liquid chromatography (HPLC) using an Aminex HPX-87P column (Bio-rad) maintained at 65ºC and with a differential refractive index detector (Waters). Furfural, hydroxymethylfurfural and acetic acid concentrations were determined by HPLC using a KC811 column (Shodex) with a UV detector at 230 nm (Waters). The concentration of phenolic compounds was determined by the Folin-Ciocalteau method (Queiroz et al. 2002). The hydrolysis factors were used to determinate the severity factor (Equation 1), as proposed by Schell et al. (2003), and its relation with the response variables was established. Additionally, the effects of each individual factor and its interactions were analyzed using the software STATISTICA 6.0 (StatSoft, 2002).
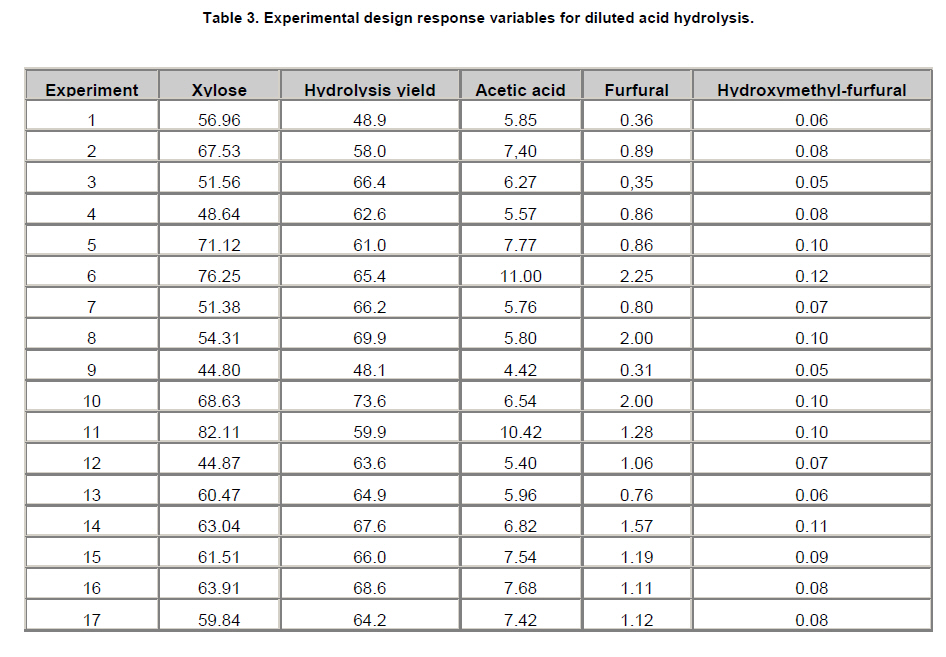
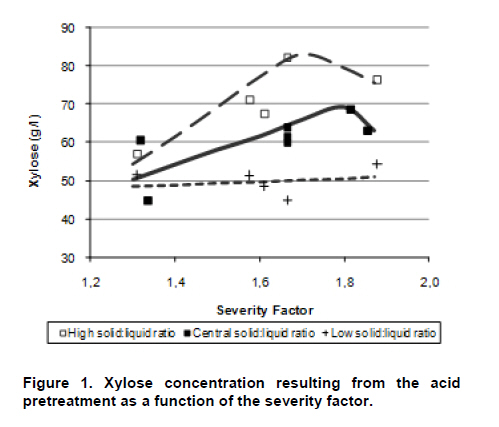
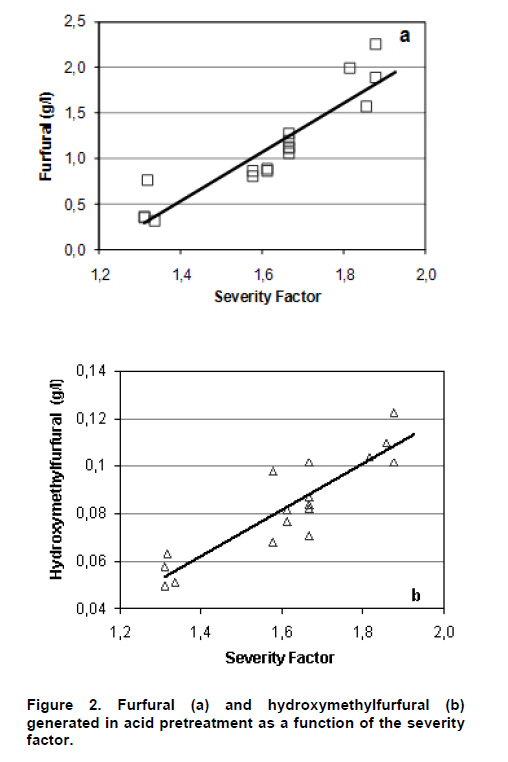
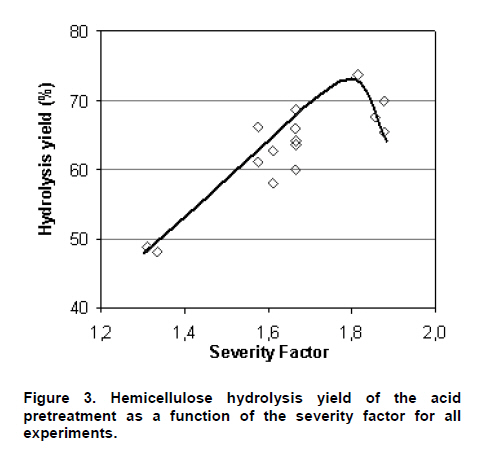
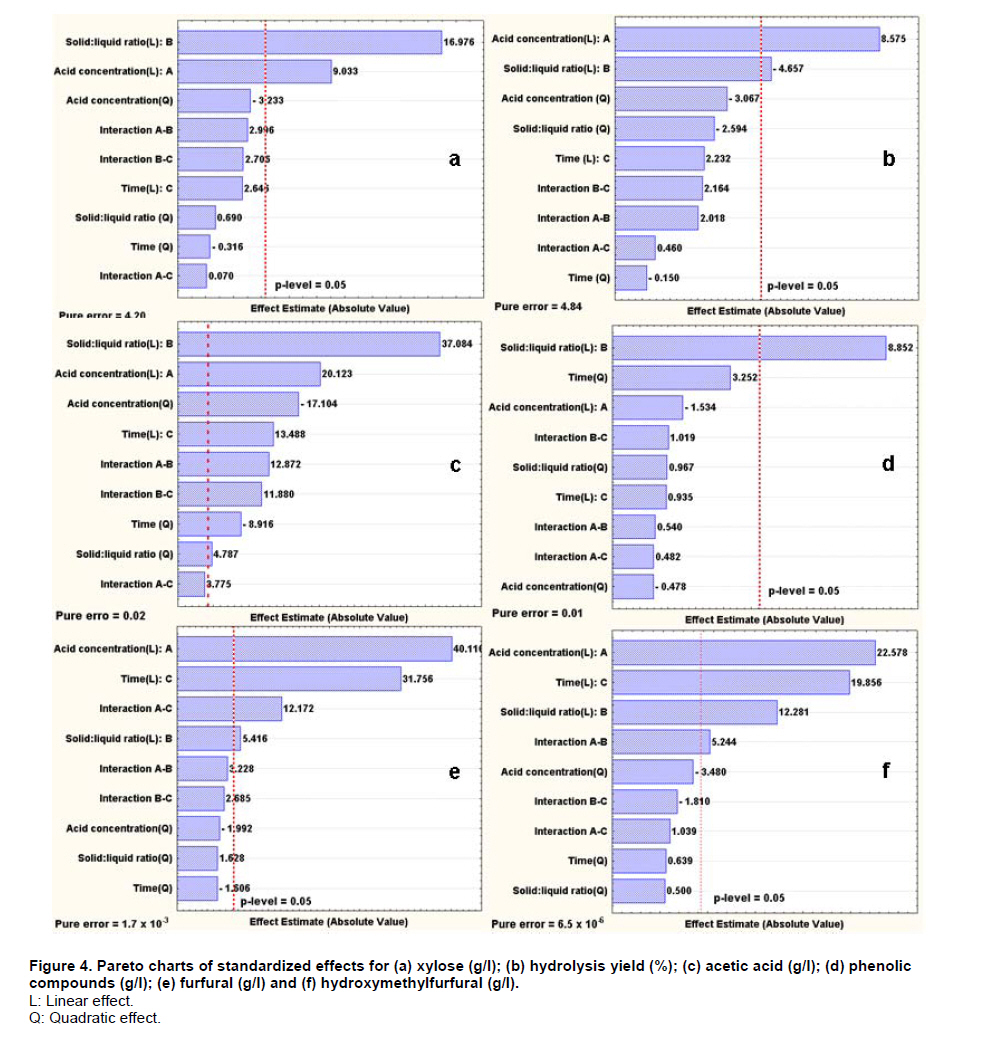
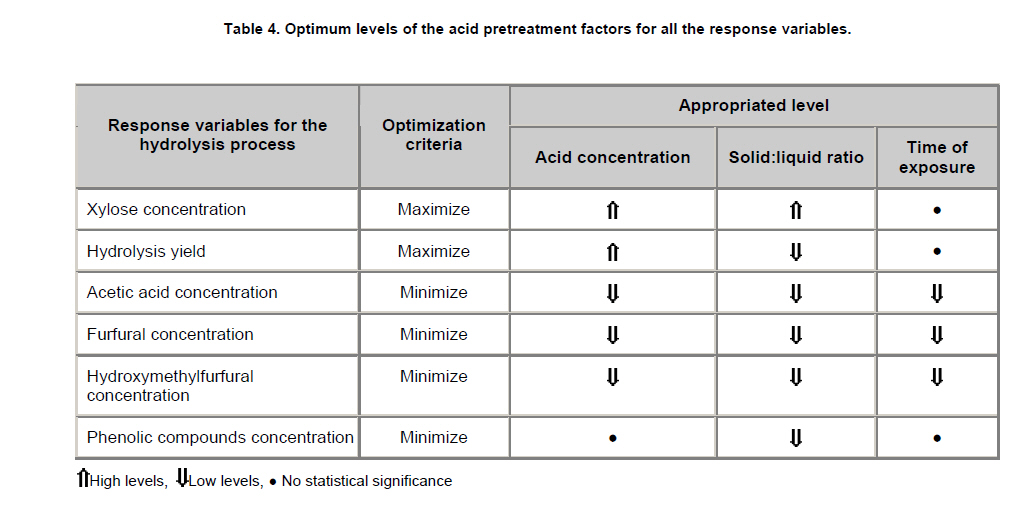
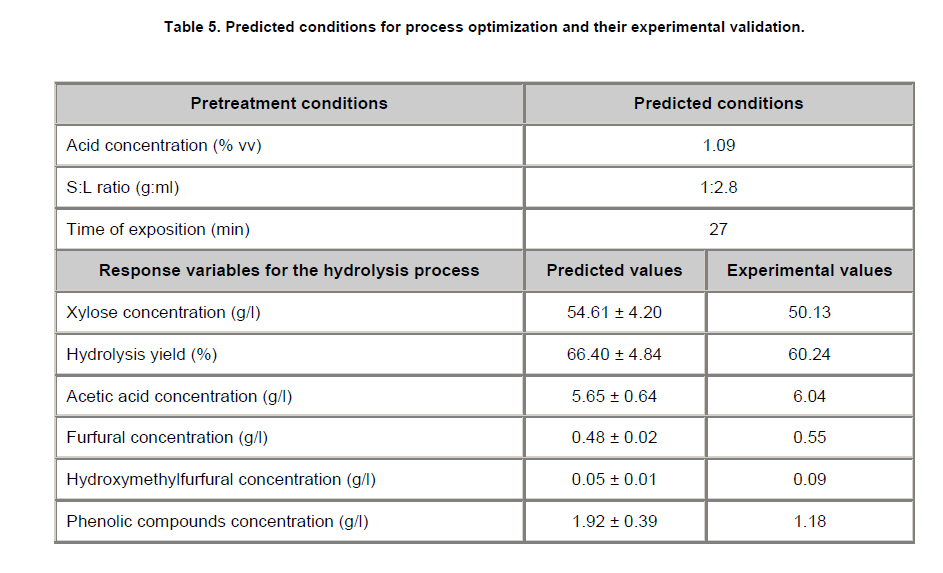
The experimental results for the diluted acid pretreatment are summarized in Table 3. The highest xylose concentrations (above 70 g/l in experiments 5, 6 and 11) were achieved with the highest S:L ratio (+α or +1). Other experiments carried out with high S:L ratios that resulted in low xylose concentrations were due to low acid concentration (-1). On the other hand, experiments that provided the lowest xylose concentrations used either the lowest S:L ratio (experiments 3, 4, 7, 8 and 12) or the middle value (experiment 9) combined with the lowest acid concentration (0.5%). These results show a strong influence of acid concentration and S:L ratio on xylose concentration, as was reported by Cheng et al. (2008) for sugarcane bagasse and Ballesteros et al. (2008) for cardoon biomass. Values ranging from 58.8% to 73.6% were observed for the hydrolysis yield, except for experiments 1 and 9, which resulted in values of 48.9% and 48.1%, respectively, corresponding to the -α and -1 levels of acid concentration. Moreover, the highest (73.6%) and the lowest (48.1%) hydrolysis yields were achieved using the highest (+α) and the lowest (-α) acid concentrations, respectively, showing a directly proportional relation between acid concentration and hydrolysis yield. The concentrations of furfural and hydroxymethylfurfural in the hydrolysates showed a strong dependence on acid concentration. Thus, the lowest concentrations of these furan compounds (experiments 1, 3 and 9) corresponded to low acid concentration (-α and -1) while the maximum concentrations of these inhibitors were achieved (experiments 6, 8 and 10) when high acid concentrations were used (+α and +1). Similarly, acetic acid concentrations were higher when high S:L ratios were used (+α and +1). Since the experimental conditions had a wide range, the experiments were assembled according to the S:L ratio for a better understanding of the influence of the severity factor (which takes into account the acid concentration, time of exposure and temperature) on xylose concentration (Figure 1). Xylose concentration is dependent on the severity factor for high and intermediate S:L ratios. Its maximum concentrations of 83 g/l (high S:L ratio) and 68 g/l (intermediate S:L ratio) were achieved with severity factors of 1.7 and 1.8, respectively. Increasing the severity factor further caused a decrease in xylose concentration. This is due to the dehydration of the released sugars to furan compounds (furfural from pentoses and hydroxymethylfurfural from hexoses), as described by Balat et al. (2008) and Lloyd and Wyman (2003). This reaction is more important as the experimental condition is more drastic, i.e., as the severity factor gets higher more furan compounds are generated (Figure 2). Similarly to the xylose concentration, the hemicellulose hydrolysis yield varied with the severity factor (Figure 3). No defined tendency was observed between the severity factor and the concentration of phenolic compounds (values ranged from 1.5 g/l to 2.3 g/l), nor with acetic acid concentration (values ranged from 4.4 g/l to 11 g/l). The statistical analysis showed the linear effect of the S:L ratio was the most important influence on the xylose concentration followed by the linear effect of the acid concentration (Figure 4a). No statistical significance (p < 0.05) was observed for the interactions or the quadratic effects of this response variable. The positive effect of S:L ratio on xylose concentration indicates that high-xylose hydrolysates were obtained when high S:L ratios were used. Additionally, it should be noted that the magnitude of the linear effect of the S:L ratio, expressed in absolute value (16.98) was almost twice that of the linear effect of the acid concentration (9.03), and these were first and second in importance to xylose concentration, respectively. In Figure 4b (Pareto chart for the hydrolysis yield) an opposite order in the importance of the factors can be observed. The linear effect of the acid concentration was the most important, followed by the linear effect of the S:L ratio, the magnitude of which was almost half that of the acid concentration. Again, only the linear effects of the acid concentration and S:L ratio showed statistical significance (p > 0.05). Furthermore, the linear effect of the S:L ratio on hydrolysis yield was negative, indicating that the use of low levels of this factor leads to a more effective extraction of xylose from the hemicellulosic fraction. Thus, the S:L ratio has opposite effects on xylose concentration and hydrolysis yield. In other words, to maximize xylose concentration a high S:L ratio should be used and to maximize hydrolysis yield a low S:L ratio should be used. For the acetic acid concentration, while no clear relation with the severity factor was noticed, statistical significance for all the individual effects was observed (Figure 4c). The linear effect of the S:L ratio was more important, which is reasonable since acetic acid arises from the hemicellulose component. The higher the S:L ratio is the more acetic acid is released into the hydrolysate. The sulfuric acid concentration appears as the factor with greatest effect on the concentration of furfural and hydroxymethylfurfural generated by sugar degradation (Figure 4e and Figure 4f). For these response variables, the linear effect of the time of exposure was second in importance, and it was statistically significant for both (p < 0.05). In addition, only the interaction of acid concentration with time of exposure and the linear effect of the S:L ratio showed statistical significance on furfural concentration, while the linear effect of the S:L ratio and the interaction of acid concentration with the S:L ratio showed statistical significance for hydroxymethylfurfural concentration. The Pareto chart for phenolic compounds concentration (Figure 4d) indicates statistical significance only for the linear effect of the S:L ratio, with a positive influence. This result denotes constant extraction of the acid-soluble lignin in the range of the hydrolysis conditions evaluated. A summary of the optimum level of each factor to maximize the performance of the diluted acid pretreatment is shown in Table 4. It became clear that high concentrations of sulfuric acid are necessary to obtain high xylose concentrations and hydrolysis yields during the pretreatment step, yet a low acid concentration is also necessary for controlling the concentration of inhibitors. Since high S:L ratios resulted in high concentrations of xylose and inhibitors, an ideal condition should be determined for obtaining a high substrate concentration and hydrolysis yield with low levels of inhibitors. Empirical models for each response variable (Equation 2) were obtained and used to determine the conditions for achieving the best performance of the pretreatment hydrolysis. The models for the pretreatment response variables had good coefficients of determination (R2 ≥ 0.83). Response variable = β0 + β1(Acid concentration) + β11(Acid concentration)2 + β2 (Solid:liquid ratio) + β22(Solid:liquid ratio)2 + β3(time) + β33(time )2 + β12(Acid concentration)(Solid:liquid ratio) + β13(Acid concentration)(time) + β23(Solid:liquid ratio)(time) β: Empirical coefficient The pretreatment conditions yielding the best hydrolysis performance were determined using the desirability function (Equation 3) under the optimization criteria described in Table 4. The experimental results of the optimized conditions (Table 5) were within the predicted confidence intervals for almost all variables. The furfural, hydroxymethylfurfural and phenolic concentrations were not within the confidence interval but had close values. D = (d1 (Y1) x d2 (Y2) x…x dk (Yk))1/K D: overall desirability Yi: Response variable di (Yi) = 0 for undesirable value and di (Yi) = 1 for desirable value k: number of response variables Experiments were carried out to determined the hydrolysates fermentability (part II of this work) and further experiments will be done aimed at acclimatizing cells to hydrolysates containing high concentrations of the inhibitory substances generated during acid pretreatment. Concluding RemarksThe severity factor had a very important influence on the xylose concentration and xylose yield, as well as on the generation of the inhibitors (furfural, hydroxymethylfurfural and acetic acid) during the diluted acid pretreatment. For some response variables, no relation with the severity factor could be established, which should be due to the absence of the S:L ratio in this expression. The use of statistical analysis allowed the individual effect of every acid pretreatment factor on the characteristics of the hydrolysates. Also, the conditions dictated by the statistical analysis were validated experimentally, and the results were in good agreement with the predictions. References
Note: Electronic Journal of Biotechnology is not responsible if on-line references cited on manuscripts are not available any more after the date of publication. Copyright © 2010 by Pontificia Universidad Católica de Valparaíso -- ChileThe following images related to this document are available:Photo images[ej10032t3.jpg] [ej10032t2.jpg] [ej10032t4.jpg] [ej10032f1.jpg] [ej10032f4.jpg] [ej10032t5.jpg] [ej10032t1.jpg] [ej10032f2.jpg] [ej10032f3.jpg] |
| |||||||||
