 |
| About Bioline | All Journals | Testimonials | Membership | News |
|
||||||
|
||||||
Electronic Journal of Biotechnology, Vol. 13, No. 4, July 15, 2010 Response surface methodology used for statistical optimization of jiean-peptide production by Bacillus subtilis Xiaoyong Zhang1, Jinyan Zhou2, Wen Fu3, Zhidong Li4, Juan Zhong5, Jie Yang6, Liang Xiao7, Hong Tan*8 1Chengdu Institute
of Biology Chinese Academy of Sciences
Chengdu 610041, PR China
Graduate University of Chinese Academy of Sciences
Beijing 100049, PR China.
E-mail: 1978zxy@126.com Financial support: Knowledge Innovation Project of the Chinese Academy of Sciences (No.KSCX2-YW-G-039-2). Code Number: ej10038 Response surface methodology (RSM) was used for statistical optimization of jiean-peptide (JAA) production by Bacillus subtilis ZK8 cells adsorbed on wood chips to form a novel fermentation system. The Plackett-Burman design was used in the first step to evaluate the effects of eight factors, including six fermentation medium components and two cell adsorption conditions. Among the variables screened, soybean meal hydrolysate (SMH) and MgSO4·7H2O in the fermentation medium had significant effects on JAA production. In the second step, the concentrations of SMH and MgSO4·7H2O were further optimized using central composite designs and response surface analysis. The optimized concentration of SMH and MgSO4·7H2O was 24% (v/v) and 0.38% (w/v), respectively, which increased the production of JAA in a shake flask system by 41% relative to optimization of a single variable component of the culture medium. Keywords: Bacillus subtilis ZK8, cell adsorption, jiean- peptide, response surface methodology, wood chips.
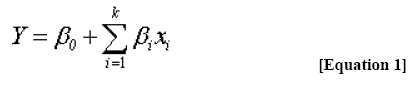
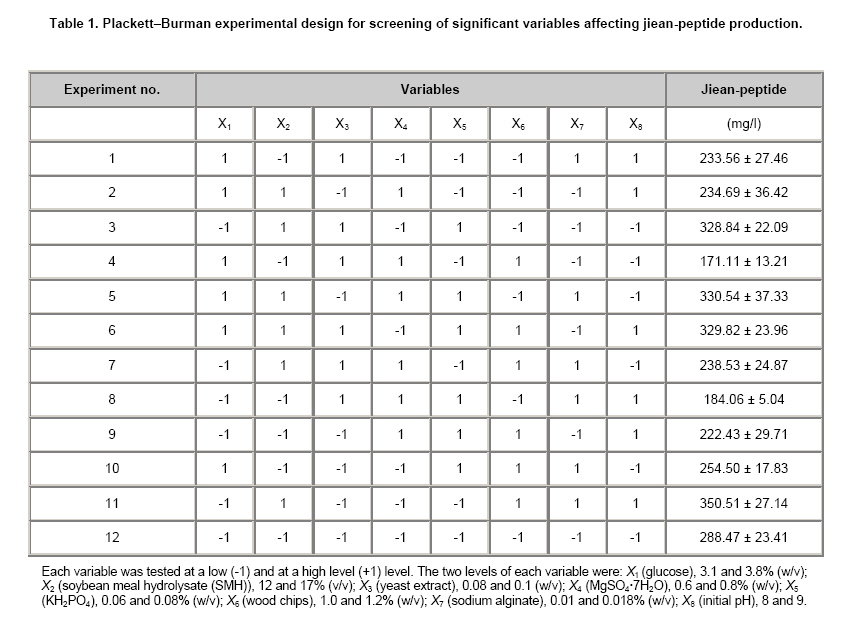
Different strains of Bacillus subtilis can produce a variety of antimicrobial cyclic lipopeptides, including iturin A, fengycins and surfactins (Hsieh et al. 2008). In 2001, our laboratory in Chengdu, China isolated a new strain of B. subtilis that was able to produce an agricultural antibiotic. The antibiotic was named jiean-peptide (JAA) and studies showed that it could be used as a fungicide against various crop diseases, including cotton fusarium wilt, tomato rhizoctonia rot and wheat powdery mildew, which can decrease the growth and productivity of these crops significantly. JAA poses little risk to the environment due to its low levels of toxicity and lack of allergic effect toward the host (Dai et al. 2005). Therefore, JAA has great potential for use against crop fungus diseases. JAA was believed to belong to the iturin family and earlier studies of iturin production by B. subtilis were focused on the use of submerged fermentation (Kajmura et al. 1995; Rahman et al. 2006; Mizumoto et al. 2007) and solid-state fermentation (Ohno et al. 1993; Mizumoto and Shoda, 2007); there are only a few reports of the production of iturin by B. subtilis cells adsorbed on wood chips. In an earlier study, we showed that B. subtilis cells adsorbed on wood chips were associated with a greater production of JAA compared to the production from submerged fermentation by free B. subtilis cells (Fu et al. 2009). The increased production might be, at least partly, because the cells adsorbed on wood chips can remain in a metabolically active state for a long time. A combination of this and maximum utilization of nutrients could result in a greater production of JAA (Iqbal and Saeed, 2005; Rahman et al. 2007). Despite the many advantages of B. subtilis cells adsorbedon wood chips over free B. subtilis cells in the production of JAA by fermentation, the composition of the culture medium and the cell adsorption conditions still need to be optimized. Traditional methods for optimization are “one-factor-at-a-time”techniques. Unfortunately, this approach frequently fails to identify the variables that give rise to the optimum response because the effects of factor interactions are not taken into account in such procedures (Deepak et al. 2008). An alternative strategy is statistical optimization, which allows rapid screening of a number of factors and factor interactions, and reflects the role of each component. Response surface methodology (RSM), a collection of mathematical and statistical techniques for building empirical models, is gaining recognition as a powerful approach for optimizing conditions for the production of industrially important products such as chemicals and enzymes (Khurana et al. 2007). Recently, RSM has been used to optimize the composition of the medium for cyclic lipopeptides production by B. subtilis in both submerged fermentation (Gu et al. 2005) and solid-state fermentation (Shih et al. 2008). Here, we describe the successful use of RSM for statistical optimization of the production of JAA in a novel fermentation system using B. subtilis ZK8 cells adsorbed on wood chips (Eucalyptus urophylla). Materials and MethodsB. subtilis ZK8, which gives a high production of JAA, is a mutant of the original B. subtilis ZK. Wood chips obtained from the trunk of mature E. urophylla tree after felling and sifted into small pieces (0.5~0.6 mm x 0.5~0.6 mm x 0.5~0.6 mm), were soaked in boiling water for 30 min, washed thoroughly with tap water, and left for 2 hrs in distilled water, which was changed three times. The washed wood chips were air-dried at 95ºC to constant weight, cooled and stored in a desiccator (Iqbal and Saeed, 2005). A 1.5% (w/v) sodium alginate gel was used as the adhesive agent in the process of cell adsorption. Adsorption of B. subtilis ZK8 on wood chips and shake flask cultivation B. subtilis ZK8 was cultured in seed medium (3% (w/v) peptone, 2.5% (w/v) glucose, 0.3% (w/v) MgSO4·7H2O, 0.4% (w/v) KH2PO4). After cultivating at 30ºC with shaking at 150 r/min for 20 hrs, the cell suspension (6 ml) was mixed vigorously with sterilized wood chips. Then sterilized 1.5% (w/v) sodium alginate gel was added and mixed thoroughly. The resulting mixture was inoculated into 250 ml shake flasks containing 60 ml of the fermentation medium and cultured at 30ºC with shaking at 150 r/min for 48 hrs (Song et al. 2005). The media and materials used for cell adsorption were sterilized by autoclaving at 121ºC for 30 min. The components and the quantities of constituents used in the fermentation medium and cell adsorption conditions varied according to the design of the matrix (He and Tan, 2006). Extraction and quantification of JAA A 10 ml sample of B. subtilis ZK8 culture was centrifuged at 12000 g for 10 min. The supernatant was recovered, adjusted to pH 2.0 with 15% (v/v) HCl, then centrifuged at 12000 g for 10 min. The precipitate was recovered and mixed with 10 ml of methanol/50 mM ammonium acetate (8:2, v/v). After extraction for 30 min, the mixture was centrifuged at 12000 g for 10 min and the supernatant was recovered. Samples of the supernatant were analyzed by reverse-phase, high-performance liquid chromatography (RP-HPLC) using an HC-C18 column (4.6 mm x 150 mm, Agilent, USA) in an LC-10AT HPLC system (SHIMADZU, Kyoto, Japan) operated at a flow rate of 0.8 ml/min. A mixture of methanol and 50 mM ammonium acetate (8:2, v/v) was used as the eluent and the outflow of the column was monitored by measuring the absorbance at 214 nm (Phae and Shoda, 1991). In brief, 15% (v/v) HCl was added to the supernatant of the culture broth until pH 2.0. The crude JAA precipitate was collected and extracted with methanol/50 mM ammonium acetate (8:2, v/v) (Hsieh et al. 2008). After removal of the extract under reduced pressure, the JAA was isolated by reversed phase silica gel column chromatography. After elution with a series of methanol/water mixtures (8:2, 7:3, 6:4, 5:5, 4:6 and 3:7; v/v), JAA was collected and dried to an off-white solid. The solid was dissolved in methanol/50 mM ammonium acetate (8:2, v/v) and subjected to RP-HPLC (HC-C18 column, 4.6 mm x 150 mm, Agilent, USA) and eluted with the following conditions: flow rate, 0.8 ml/min; mobile phase, methanol/50 mM ammonium acetate (8:2, v/v); absorbance wavelength, 214 nm. After collection and drying, the purified JAA was used as a standard. A Plackett–Burman (P-B) experimental design was used to screen the significant variables that influenced the concentration of JAA. There were eight variables, including six fermentation medium components (glucose, soybean meal hydrolysate (SMH), yeast extract, MgSO4·7H2O, KH2PO4 and initial pH) and two cell adsorption conditions (wood chips and sodium alginate), screened in 12 experiments. The design of experiments and the concentration of JAA are given in Table 1. On the basis of the results obtained by the P-B design, the fitted first-order model is
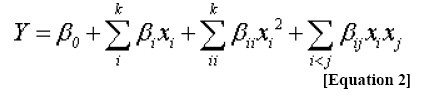
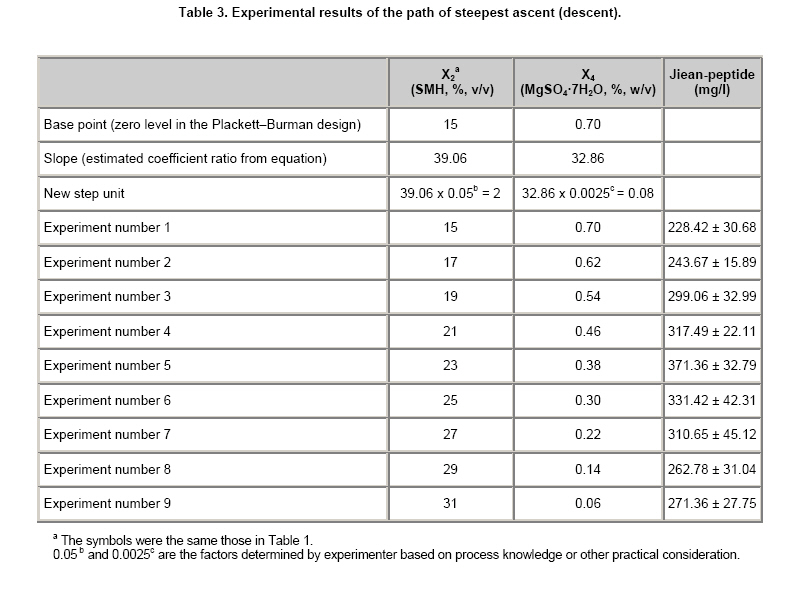
Where Y is the predicted response, β0 and βi are constant coefficients, and xi are the coded independent variables or factors. To move rapidly towards the neighborhood of the optimum response, the method of steepest ascent (descent) was used. The path of steepest ascent (descent) started from the centre of the P-B design (Chang et al. 2002). These new units were determined according to the estimated coefficient ratio from the first-order model Equation 1. To move away from the first design centre along the path of steepest ascent and descent, we moved 2% (v/v) in the SMH direction and 0.08% (w/v) in the MgSO4·7H2O direction. Other components were at the low level of concentrations from the P-B design. A central composite design (CCD) with five coded levels (-1.41, -1, 0, +1 and +1.41) was used to describe the nature of the response surface in the optimum region. According to this design, the total number of treatment combinations was 2k + 2k + n0, where k is the number of independent variables and n0 is the number of repetitions of experiments at the centre point (Song et al. 2007). The experimental results of the CCD were fit with a second-order polynomial equation by a multiple regression technique:
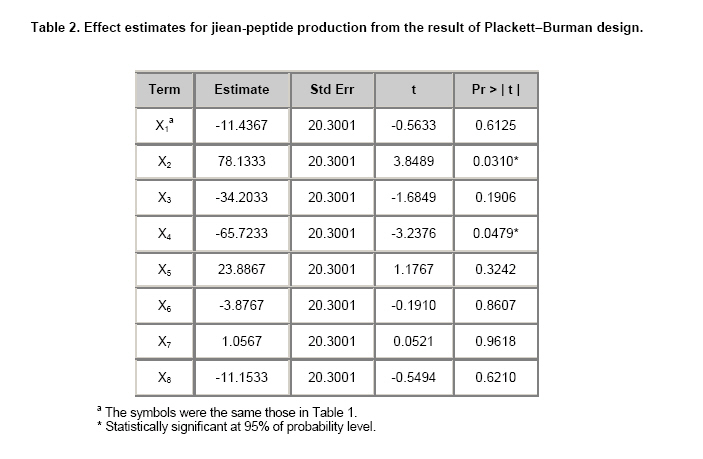
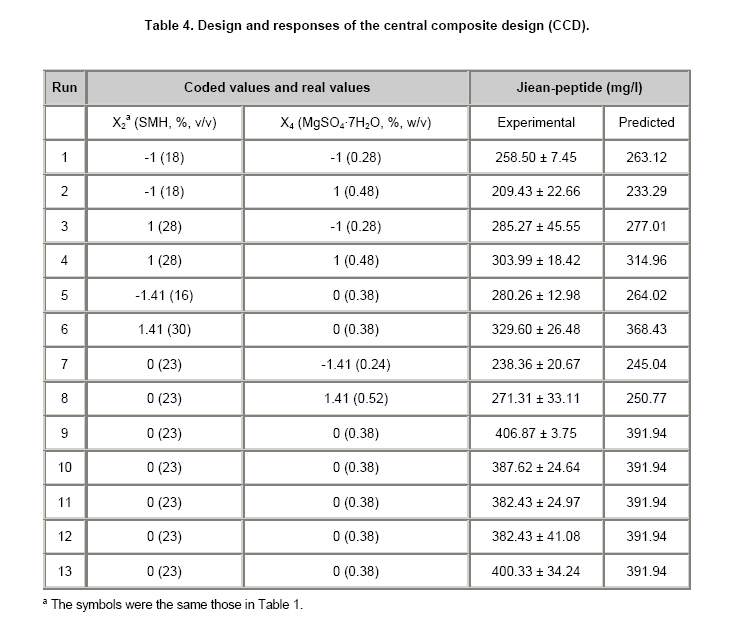
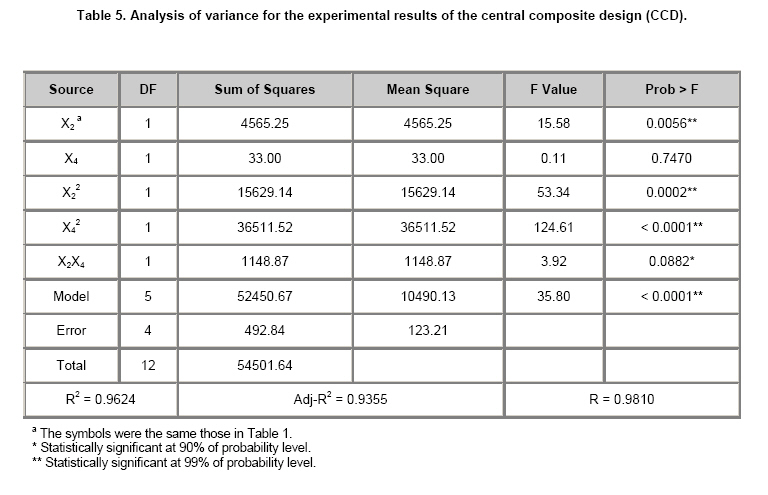
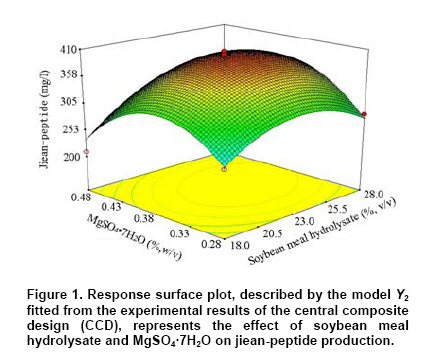
Where Y is the predicted response, β0 is the offset term, βi is the ith linear coefficient, βii is the ith quadratic coefficient and βij is the ijth interaction coefficient. All experiments were done in triplicate, and the average concentration of JAA was taken as the response. The P-B experimental design and statistical analysis of the data were done with the SAS software package (version 9.0, SAS Institute Inc., Cary, NC, USA), while the CCD and statistical analysis of the data were done with the Design Expert software package (version 7.1.5, State-Ease Inc., Minneapolis, MN, USA). Statistical analysis of the models was used to evaluate the analysis of variance (ANOVA). The quality of the polynomial model equations was judged statistically by the coefficient of determination R2, and its statistical significance was determined by the F-test. The significance of the regression coefficients was tested by Student’s t-test (Gangadharan et al. 2008). Results and DiscussionScreening of parameters using P-B design The experimental concentrations of JAA are given in Table 1. Using the SAS software (version 9.0), a first-order model was fit to the data obtained from the experiment. When the sign of the concentration effect of the tested variable was positive, the influence of the variable upon the concentration of JAA was greater at a high concentration, and when it was negative, the influence of the variable was greater at a low concentration (Gangadharan et al. 2008). The analysis of variance (ANOVA) for the P-B experiment was calculated, and the maximum and minimum effect of each variable on the concentration of JAA was determined by Student’s t-test (Table 2). According to the absolute value of t, the effects of the eight variables were in the order: X2 >X4 >X3 >X5 >X1 >X8 >X6 >X7 The effects of X2 (SMH) and X4 (MgSO4·7H2O) had confidence levels >95% and were considered to influence the concentration of JAA significantly. The remaining variables, including four fermentation medium components (X1, glucose; X3, yeast extract; X5, KH2PO4; and X8, initial pH), and two cell adsorption conditions (X6, wood chips; and X7, sodium alginate), had confidence levels <95% and were considered not significant. A first-order model equation was derived representing JAA production as a function of the independent variables: Y1 (mg/l) = 263.09 + 39.07X2 - 32.86X4 [Equation 3] Locating the region of optimum response by the steepest accent (descent) design On the basis of the first-order model (Equation 3), the path of steepest ascent was determined to find the proper direction of changing variables, increasing or decreasing the concentration according to the sign of the main effects to improve JAA production (Shih et al. 2008). The path of steepest ascent started from the centre of the factorial design and moved along the path in which the concentration of SMH (X2) was increasing, whereas the concentration of MgSO4·7H2O (X4) was decreasing. The design and results of the path of steepest ascent experiments are given in Table 3. It was shown that the highest production response was 371.36 ± 32.79 mg/l when the concentration of SMH (X2) was 23% (v/v) and the concentration of MgSO4·7H2O (X4) was 0.38% (w/v), which suggested that this point was near the region of maximum production response. Further optimization using CCD The CCD was conducted in the vicinity of the optimum to locate the true optimum concentrations of SMH (X2) and MgSO4·7H2O (X4) for JAA production. The levels of the variables for the CCD experiments were selected according to the results of the previous experiments. The design matrix and the corresponding experimental data are given in Table 4. The experimental results of the CCD were fit with a second-order polynomial equation: Y2(mg/l) = 391.94 + 23.89X2 + 2.03X4 + 16.95X2X4 - 47.40X22 - 72.45X42 [Equation 4] The fit of the model Y2 was evaluated by the coefficient of determination R2, which was 0.9624, indicating that 96.24% of the variability in the response could be explained by the model (Table 5). The statistical significance of the second-order model equation was evaluated by an F-test ANOVA, which revealed that this regression is statistically significant (P < 0.0001) at the 99% confidence level. Table 5 shows the significance of the regression coefficients of the model, indicating that SMH had a highly significant effect (P = 0.0056) on JAA production. The effect of the interaction of SMH (X2) and MgSO4·7H2O (X4) was significant (P = 0.0882) at the 90% confidence level. The contour plot described by the model Y2 is represented in Figure 1, which shows that the maximum concentration of JAA was approximately 400 mg/l. The optimal concentration for the two components obtained from the maximum point of the model was 24% (v/v) for SMH (X2) and 0.38% (w/v) for MgSO4·7H2O (X4). The model predicted a maximum response of 395.08 mg/l JAA concentration for this point. Validation of the optimization fermentation medium Experiments were done in triplicate using the optimized conditions representing the maximum point of the concentration of JAA to verify the modelling results. The predicted average concentration of JAA was 395.08 mg/l and the average concentration found by experiment was 412.23 ± 14.33 mg/l. This is an improvement of concentration by about 41% relative to that obtained by optimization of a single variable of the culture medium, where the concentration was 292.66 mg/l (Fu et al. 2009). The good correlation between predicted and experimental values after optimization justified the validity of the response model and the existence of an optimum point. Concluding RemarksThe statistical approach with rapid identification of important factors and development of a polynomial model showed significant results for optimizing JAA production in a novel fermentation system in which B. subtilis ZK8 cells were adsorbed on wood chips. The present study identified the effect of individual variables on JAA production, which was found to be influenced significantly by the concentration of SMH and MgSO4·7H2O in the medium. The optimum concentration was 24% (v/v) for SMH and 0.38% (w/v) for MgSO4·7H2O, which increased the production of JAA by 41% relative to that achieved by optimization of a single variable in the culture medium. References
Note: Electronic Journal of Biotechnology is not responsible if on-line references cited on manuscripts are not available any more after the date of publication. Copyright © 2010 by Pontificia Universidad Católica de Valparaíso -- Chile The following images related to this document are available:Photo images[ej10038t2.jpg] [ej10038t3.jpg] [ej10038t1.jpg] [ej10038f1.jpg] [ej10038t4.jpg] [ej10038t5.jpg] |
| |||||||||
