 |
| About Bioline | All Journals | Testimonials | Membership | News |
|
||||||
|
||||||
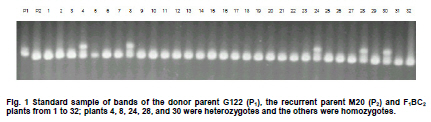
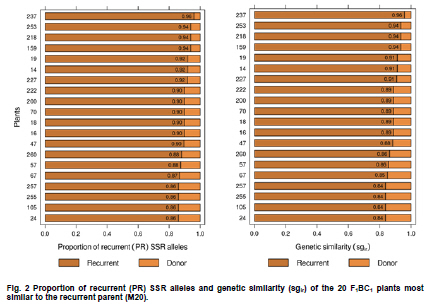
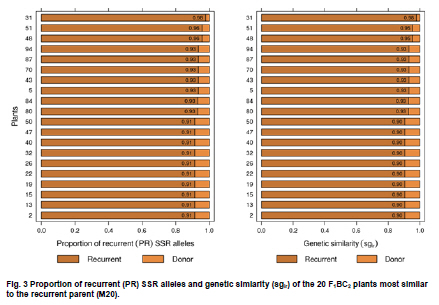
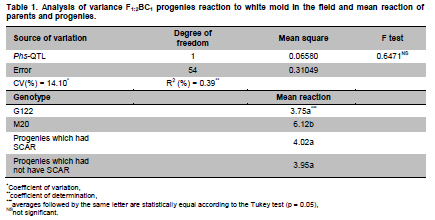
Electronic Journal of Biotechnology, Vol. 13, No. 6, December 15, 2010 Marker-assisted backcrossing using microsatellites and validation of SCAR Phs marker for resistance to white mold in common bean Flávia Fernandes Carneiro*1 · João Bosco dos Santos1 · Monik Evelin Leite1 1Departamento de Biologia, Universidade Federal de Lavras, Lavras, MG, Brazil *Corresponding author: bioffc@yahoo.com.br Financial support: Coordenação de Aperfeiçoamento de Pessoal de Nível Superior (CAPES). Code Number: ej10075 Molecular markers may accelerate selection through the identification of plants with higher proportion of recurrent parent genome, as well as identifying those plants bearing target alleles like quantitative traits loci (QTLs) for white mold resistance. The objectives of this work were: 1) to employ microsatellite markers (SSR) in order to accelerate the recovery of recurrent parent genome 2) to validate sequence characterized amplified region (SCAR) Phs associated with a QTL that confers resistance to white mold, as previously identified in bean populations. Lines G122 and M20 were crossed, which generated 267 F1 plants from backcross (BC) BC1 and 113 plants from backcross BC2.SSR polymorphic markers were adopted. The relationship between BC plants and the recurrent parent was estimated based on the recurrent genome proportion (PR) in each BC plant, and the Sorensen-Dice genetic similarity (sgir). To determine how much the phenotypic variation is explained by SCAR Phs, 56 F1:2BC1 progenies were evaluated on the field following a random block design with two replications through the straw test method. SSR markers are efficient in identifying individuals with a greater proportion of the recurrent genome. SCAR Phs was not efficient for the indirect selection of common beans for white mold resistance. Keywords: backcross, genetic similarity, Phaseolus vulgaris, SCAR, Sclerotinia sclerotiorum, SSR assisted selection. IntroductionIn general, the occurrence of diseases causes low productivity, unstable grain yield and poses a great risk to bean cultivation. White mold (Sclerotinia sclerotiorum) has been identified as a serious disease mainly in bean crops cultivated successively in the same area using central pivot irrigation systems where the temperature and humidity conditions become ideal for developing this pathogen. There are various methods for controlling white mold disease, the most efficient being the deployment of bean lines resistant to this plant pathogen. This method is restricted to only a few genotypes (Kolkman and Kelly, 2002; Schwartz et al. 2006), that have shown some potential for being utilized in breeding programs; although producers have not been able to easily utilize such bean lines because they are not adapted in the region. Thus resistance alleles must be transferred from exotic sources that are not adapted to elite crop lines. However, due to difficulties in evaluation and to the partial nature of resistance, breeding programs have had limited success in breeding for resistance to white mold. In Brazil, there is a controversy concerning the crops resistance levels due to the lack of resistance of the cultivars. There is also controversy about effect of physiological resistance and plant escape mechanisms like upright plant type, which changes the ranking of lines on the level of resistance (Antonio et al. 2008; Gonçalves and Santos, 2010). Breeding programs aimed at increasing such resistance level would certainly have a significant impact on the common bean production chain. This would not only allow the return of production systems to currently unproductive areas, due to their high infection levels, and contribute to reduction to use in pesticides which has not always been efficient. Marker-assisted backcrossing process is highly suited to monitor the degree of similarity of the resistant lines to the recurrent parent, predicting the degree of kinship among the backcrossed plants. As long as the resistance sources are not adapted to the region there is a need to introduce resistance into elite genotypes by means of backcrossing. However, one of the major limitations is the long period of time required, which could render the recurrent genotype obsolete at the end of the breeding program. So, molecular markers are important tools for improving the efficiency of this process since they allow identification of individuals that have a larger recurrent genome proportion, as well as assisting in the selection of plants that carry a desired marker linked to resistance (Hospital, 2001; Bouchez et al. 2002; Oliveira et al. 2008). Among the available types of molecular markers, microsatellite markers simple sequence repeats (SSR) have shown to be the most adequate for breeding programs due to their co-dominance and multi-allelic characteristics, and for their ability to automate the process (Oliveira et al. 2006). Several quantitative trait loci (QTLs) previously identified for white mold physiological resistance include the Phs (SCAR) marker that identifies a major quantitative traits locus (QTL) (Miklas et al. 2001; Miklas, 2006). The band amplified by the SCAR Phs primer pair (5’AGCATATTCTAGAGGCCTCC3’and 5’GCTCAGTTCCTCAATCTGTT3’) is derived from resistant parent G122 has 285 bp. This primer amplifies part of the allele for phaseolin T present in Andean beans as in G122. The phaseolin T allele is mapped in the P. vulgaris B7 linkage group (Freyre et al. 1998). The objectives of this study were: 1) To employ microsatellite markers (SSR) in order to accelerate the recovery of the recurrent parent genome 2) To validate SCAR Phs associated with a QTL that confers resistance to white mold as previously identified in other bean populations. Materials and MethodsTwo lines were used as parents: the first line was the G122 donor, a large Andean beige bean with red stripes, which exhibits an upright growth habit that possesses physiological resistance to white mold (Kolkman and Kelly, 2003). Nevertheless, it has several agronomical unfavorable agronomic characteristics, and it does not adapt very well to the conditions in Minas Gerais, in Southeastern Brazil. The second parent was the Mesoamerican M20 line, which has a carioca-type bean that shows a type II growth habit and carries Co-42, Co-5 and Co-7 alleles for anthracnose (Colletotrichum lindemuthianum) resistance. This line is resistant to some races of the pathogen that causes angular leaf (Pseudocercospora griseola), although it is highly susceptible to white mold. F1 generation was obtained from crossing the parents; then backcrossed with the recurrent parent (M20), to attain the first backcross generation, F1BC1. Some of the seeds originated from this backcrossing were preserved and others were backcrossed again with the recurrent parent, to produce the second backcross generation F1BC2. Later, seeds from these generations were sown in an experimental field, where 267 F1BC1 and 113 F1BC2 plants were obtained. DNA was extracted from the F1BC1 and F1BC2 plants and from the parents, according to the procedure used by Pereira et al. (2007), being each SSR reaction prepared with a 12 µl volume. Amplification products were separated by electrophoresis in 3% agarose gel and TBE buffer (0.045 M Tris-Borate and 0.001 M EDTA) at 80 V for three and half hrs. Afterwards the gel was treated with 0.5 µg ml-1 ethidium bromide then visualized in a Fotodyne ultraviolet light trans-illuminator and photographed with a Kodak digital camera. Polymorphic primers were initially selected using the parents from 480 pairs of SSR primers. Then the polymerase chain reaction (PCR) of whole backcrossing (BC) populations was set up using the polymorphic primers. Their sequences are available at http://www.css.msu.edu/bic. The plants resulting from the backcross program were evaluated, along their parents, for white mold resistance using SCAR Phs specifically designed for this type of resistance (Miklas et al. 2001). The expected banding pattern for the microsatellite markers in the backcross generation should show a homozygote banding pattern similar to the recurrent genotype and a heterozygote bands derived one from the recurrent parental and the other from the donor parent, the latter one being polymorphic (Figure 1). Thus, the DNA fragment identification amplified by microsatellite markers and separated by electrophoresis was conducted through visual analysis, which generated a matrix based on binary data, in which, the segregated individuals were genotyped in relation to the presence of a determined amplified allele (0) and the absence of the same allele (1). Since the polymorphic band is derived from the donor, in the current study, it is considered zero (0) due the fact that those plants present the homozygote genotypes are more similar to that of the recurrent parent. SSR data were submitted to the genetic similarity analysis through the NTSYS - PC 2.1 software (Rohlf, 2000). Genetic similarity estimates (sgir) between each BC plant (i) and the recurrent parent (r) were made through the Sorensen-Dice coefficient by applying the formula sgir = 2a/(2a + b + c), being a the absence of bands in i and r genotypes; b the absence of band only in individual i; and c the absence of band in r. As previously stated, in genetic similarity estimates (sgir), between each BC plant with the recurrent parent, a is the absence of bands in genotypes i and r, which contradicts the criterion adopted in other similarity studies. The proportion of the alleles from the recurrent parent (PR) was estimated by applying the methodology in Benchimol et al. (2005) through the formula PR = B + 0.5H/(B + H), in which, B is the number of plants with the recurrent allele and H is the number of plants with the heterozygote genotype. The correlation between genetic similarity estimates between each BC plant (i) and the recurrent parent (r) (sgir) and the corresponding PR was estimated for both BC1 and BC2. In the field, 56 F1:2BC1 progenies were evaluated to determine the level of phenotypic variation explained by SCAR Phs in tropical conditions. The experiment used randomized block design with two replications; each plot consisted of six bean plants. Each plant was inoculated by the straw test method as described by Terán and Singh (2009). Sclerotia were collected in the field in Ijaci, Minas Gerais, in overhead irrigated area. Later, the fungus was multiplied in petri dishes containing potato dextrose agar (PDA) medium with an addition of chloramphenicol in the proportion of one drop of antibiotic per 100 ml of PDA medium and maintained in biological oxygen demand (BOD) at 20 ± 3ºC for three days. The inoculum was multiplied a second time in order to obtain more uniformity, also in BOD at 20 ± 3ºC for three days, and a 12 hrs photoperiod. Three days after the second multiplication, Eppendorf tips with PDA discs containing mycelium were employed to inoculate the plants at 38 days of age. During inoculation, a cut was made on the main stem approximately 2.5 cm from the node and a tip was placed with an agar disc where mycelium had grown. Six to eight days after inoculation, an evaluation was made to determine the plant’s reaction to the white mold by applying the rating scale from 1 to 9 (Terán and Singh, 2009), in which: 1 - plants without symptoms; 2 - fungus invasion beyond the inoculation site; 3 - fungus invasion close to the first node ; 4 - fungus reaches the first node; 5 - fungus invasion beyond the first node; 6 - fungus invasion near the second node; 7 - fungus reaches the second node; 8 - fungus invasion beyond the second node; and 9 - plant death. A variance analysis was carried out on the progeny reaction to white mold through PROC GLM procedure of SAS® (SAS Institute, 2005) software to validate SCAR Phs. Results and DiscussionRecovery of the recurrent genome Of the 480 pair of primers tested for polymorphism between parents, only 25 pair of primers (5.2%) was polymorphic and employed in F1BC1 plants. Twenty three pairs of primers were used in F1BC2 plants, that is, 4.79%. The fewer number of primer pairs was applied in the second backcrossing due to the recovery of recurrent parent genome as two of the pair of primers used in the F1BC1 generation were not polymorphic among F1BC2 plants. Polymorphism revealed by the molecular markers was relatively low, and this could be due to the domestication and reduction process in the species genetic variability, which mainly occurs among genotypes originating from the same domestication center (Benchimol et al. 2007). Reduced polymorphism found in bean genotypes by SSR markers has been reported in other studies ( Sarikamis et al. 2009; Torga et al. 2010). Markers identified as polymorphic in the parent were genotyped in plants from both backcrossing generations (BC). Genetic similarity matrixes were generated from the genotyped data in order to estimate similarity between BC genotypes and the recurrent parent by identifying those that were genetically closest to the recurrent genome (M20). Based on 25 pairs of SSR primers in the 267 F1BC1 plants an average recurrent genome recovery of 74 ± 8%, based on the proportion of alleles from the recurrent parent (Benchimol et al. 2005). This value is in agreement with the expected F1BC1 generation average of 75% (x2 = 0.533, P = 0.465) and 63 ± 14% by the Dice coefficient, although the observed average did not agree with the expected result (x2 = 7.68, P = 0.006). However, there was a high and positive correlation (98.86%) between the two methods for the relationship estimate. By selecting the eight F1BC1 plants (numbers 222, 227, 14, 19, 159, 218, 253, and 237) with the highest proportion of recurrent alleles (Figure 2) the average obtained was 93% for both methods used, which corresponds to the genome recovery proportion expected in the third backcrossing cycle of 93.75% (x2 = 0.096, P = 0.757). It is concluded that the 25 pairs of primers, distributed in 9 of the 11 bean chromosomes, were efficient to sample the species genome, thus allowing an estimate of the plants BC1 relationship with the recurrent parent and to select the most closely related ones, which is equivalent to reducing up to two BC cycles. The 113 F1BC2 plants were genotyped with 23 of the 25 SSR primer pairs employed to genotype F1BC1 plants. The recurrent alleles average proportion result was that of 83 ± 7.3% (Benchimol et al. 2005), which is consistent with that of the expected 87.5% average in F1BC2 generation (x2 = 1.85, P = 0.174) and 80 ± 11.4% by the Dice coefficient; being the observed average close the expected average (x2 = 5.14, P = 0.023). There was a high correlation between both evaluation methods (99.05%), similar to that of BC1. Figure 2 and Figure 3 show that the progenies that are most related to the recurrent are the same in both evaluation methods. Hence, both genetic similarity and recurrent SSR allele proportions are efficient for selecting plants that are most similar to the recurrent parent. What probably contributed to reduce the average in both backcrossings through the Dice coefficient were the individuals with less recurrent genome recovery proportion, 7.69% in the first and 35.71% in the second backcrossing cycle. By selecting the five plants (numbers 31, 51, 48, 94, and 87) with the highest recurrent SSR alleles proportion, (Figure 3), the averages obtained were 95.20% (PR) and 94.8% (sgir), which corresponds to the genome recovery proportion expected in the fourth backcrossing cycle, 96.87% (x2 = 0.92, P = 0.33 and x2 = 1.41, P = 0.23, respectively). There would certainly have been a greater recurrent genome proportion if SSR marker assisted selection had been carried out in F1BC1 generation and only if F1BC1 plants most similar to the recurrent were used to make the second backcrossing. Considering the cost, the required work to obtain this information, and short growing cycle of common bean, it can be deduced that it is worth selecting plants with a higher proportion of recurrent alleles only in BC1since this generation was enough to select plants highly similar to the recurrent parent, equivalent to BC3 generation. Among the 20 F1BC1 plants that were most similar to the recurrent parent (Figure 2), 16, 260, 57, and 255 possessed the SCAR Phs marker and an average recovery of recurrent parent alleles of 88%, equivalent to the expected average of 87.5% in BC2 (x2 = 0.023, P = 0.879). Among the 20 F1BC2 plants most similar to the recurrent parent (Figure 3), 32 and 101 had the SCAR Phs marker and 91% of the alleles from the recurrent parent. Evaluation of SCAR Phs presence The two backcross F1BC1 and F1BC2 populations were genotyped with the SCAR Phs in order to identify those that possess the QTL, which confers white mold resistance. The band amplified by the SCAR Phs is derived from resistant parent G122 has 285 bp. This primer amplifies part of the allele for phaseolin T present in Andean beansas in G122. The phaseolin T allele is mapped in the P. vulgaris B7 linkage group (Freyre et al. 1998). Among the 267 F1BC1 plants, 128 showed the band amplified by SCAR Phs primers and 139 did not. As expected, approximately half of the plants had SCAR that conveys white mold resistance and the other half did not, and followed a 1:1 segregation ratio (x2 = 0.453, P = 0.501). Among the 113 F1BC2 plants, 22 possessed the SCAR Phs-amplified band and 91 did not and probably did not possess the QTL.The result was in accordance to the expected ratio, that is, 25% of the plants had QTL and 75% did not, as the bands segregated in a 1:3 ratio (x2 = 1.84, P = 0.175). SCAR Phs validation Among the 56 F1:2BC1 progenies evaluated in the field, 25 were segregating for SCAR and 31 were not. From the variance analysis, it can be inferred that there was no significant difference between the presence and absence of SCAR, and that it explained only 0.39% of the phenotypic variation for reaction to white mold (Table 1). It is important to emphasize that the inoculation method applied in each plant allowed physiological resistance to be identified independently from other factors that influence resistance, such as an upright plant type. It was also observed that the reactions of the parents were as expected, confirming inoculation efficiency (Table 1). The average rating of the progenies with SCAR marker was equal to that of those progenies without the marker. It could be inferred, at first, that there is a strong interaction between QTL and the environment, that is, QTL associated to phaseolin T did not confer resistance, in experimental field conditions, as in the case of temperate environments (Miklas et al. 2001). In this case, it can also be deduced that the greater resistance observed in G122 is due to other QTLs or even phaseolin T QTL that expressed in G122 background but not in the progenies with a 75% average of recurrent allele parent (Chaib et al. 2006). However, it is important to consider that SCAR was segregating at a 1:1 ratio; thus it could have contributed to the progenies average resistance decrease. Nevertheless, the environmental effect was noteworthy toward this QTL expression reduction, which makes it almost useless in controlling the disease in the environment tested. Studies seeking to identify molecular markers for white mold resistance are very important since it is difficult to evaluate the phenotype, mainly in the field, due to the difficulty of obtaining uniform pathogen inoculation. In addition the evaluation of resistance in relation to this plant pathogen in the field is also affected by the plant’s escape mechanisms, such as the upright plant type associated to the physiological resistance, which overestimates the resistance (Miklas et al. 2001).The combination of physiological resistance with the plants escape mechanisms is the best strategy for breeding when seeking to minimize yield loss due to damage caused by this plant pathogen. This goal can be achieved by introducing the physiological resistance from non-adapted sources through backcrossing using marker assisted selection to assist in the process of recovering individuals with higher frequency of the recurrent genotype. However the SCAR Phs is not efficient in marker-assisted selection in common beans for white mold physiological resistance adapted in the tropical. This result disagrees with Miklas (2007) who was successful in backcrossing resistance from G122 into susceptible Pinto bean using Phs SCAR for temperate conditions. As mentioned before the QTL from G122 did not express in the present conditions due to its interaction by environments, although it expressed large effect in temperate conditions. References
Note: Electronic Journal of Biotechnology is not responsible if on-line references cited on manuscripts are not available any more after the date of publication. Copyright © 2010 by Pontificia Universidad Católica de Valparaíso -- Chile The following images related to this document are available:Photo images[ej10075f2.jpg] [ej10075t1.jpg] [ej10075f1.jpg] [ej10075f3.jpg] |
| |||||||||
