 |
| About Bioline | All Journals | Testimonials | Membership | News |
|
||||||
|
||||||
Electronic Journal of Biotechnology, Vol. 14, No. 3, May 15, 2011 Enhancement of γ-aminobutyric acid in a fermented red seaweed beverage by starter culture Lactobacillus plantarum DW12 Anussara Ratanaburee1 · Duangporn Kantachote*1 · Wilawan Charernjiratrakul1 · Pimpimol Penjamras2 · Chaiyavat Chaiyasut 3 1 Department
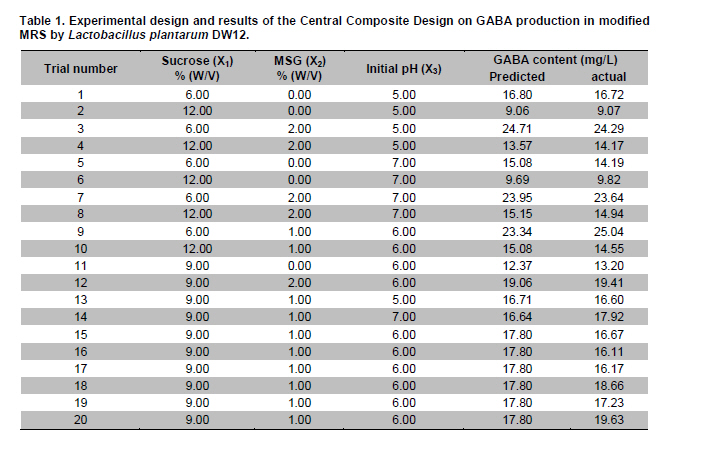
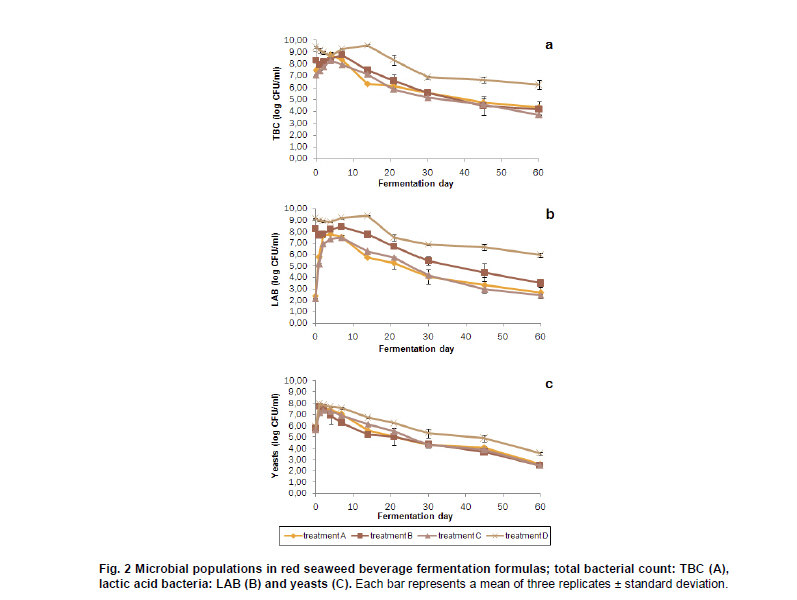
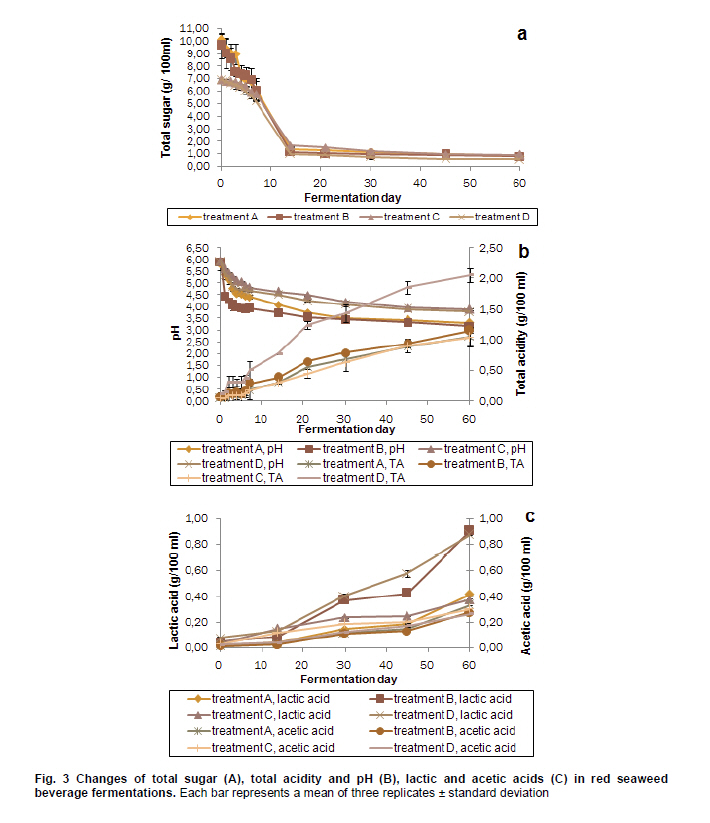
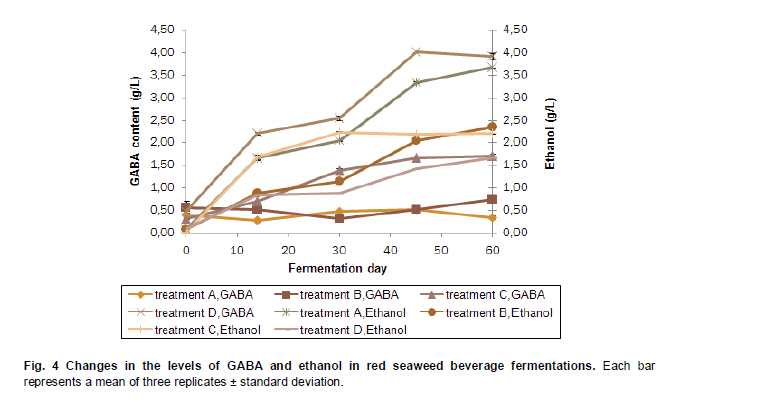
of Microbiology, Faculty of Science, Prince of Songkla University, Hat Yai, Thailand Corresponding author: duangporn.k@psu.ac.th Financial support: The first author would like to thank Faculty of Science, Prince of Songkla University for giving research assistant scholarship and Graduate School, Prince of Songkla University for supporting a budget to do research.Code Number: ej11024 Abstract Lactobacillus plantarum DW12, a gamma-aminobutyric acid (GABA) producing strain, was used as a starter culture to produce a functional fermented red seaweed beverage (FSB). Optimal conditions for producing FSB were established using Central Composite Design by varying the amounts of monosodium glutamate (MSG), sucrose and the initial pH in MRS medium. After a verification test, 1% MSG, 6% sucrose and an initial pH of 6 were selected. Four treatments were tested: traditional formula (A), red seaweed-cane sugar-potable water = 3:1:10, w/w/v, initial pH 6; the traditional formula with a 5% starter culture consisting of 4.1 x 10⁹ CFU of DW 12/ml (B); formula A modified by changing the amounts of cane sugar and MSG to 6% and 1%, respectively (C); formula C with a 5% starter culture added (D). Comparison among the 4 treatments showed that the treatment D produced the highest amount of GABA (4000 mg/L) during days 45-60 while the GABA content of A, B and C treatments was 340, 730 and 1690 mg/L, respectively. However, the results of the sensory test for the treatments C and D showed that the presence of MSG produced an unsatisfactory salty taste. All finished products from the 4 treatments met Thai standard guidelines for chemical and microbiological qualities after 120 days. The results indicated that enrichment of the GABA content in FSB is possible by adding MSG and the GABA producing strain DW12; however, the appropriate amount of MSG addition should be further studied. Keywords: functional fermented plant beverage, γ-aminobutyric acid, Lactobacillus plantarum, monosodium glutamate, red seaweed, response surface methodology. Introduction Fermented plant beverages (FPB or FPBs) are non-alcoholic and produced by lactic acid bacteria (LAB) from different plants such as fruits, cereals and vegetables. The components required for making FPB are plant material, sugar and potable water (3:1:10 (w/w/v)) (Prachyakij et al. 2008). Normally, the acceptable fermenting time before drinking FPBs varies from between 2 to 6 months depending on when they achieve a good appearance. FPBs are considered to be a novel functional food product of Thailand because they contain high nutrients, often antimicrobial compounds and potentially some human LAB probiotics (Kantachote et al. 2008; Prachyakij et al. 2008; Duangjitcharoen et al. 2009; Kantachote et al. 2010). It would be of interest to produce FPBs that have more defined health benefits such as the presence of γ-aminobutyric acid (GABA).GABA is a non-protein amino acid compound that is synthesized by decarboxylation of glutamic acid via the glutamate decarboxylase enzyme (Komatsuzaki et al. 2008). Therefore, adding monosodium glutamate (MSG) into the LAB culture media can increase the amount of GABA in culture broths (Lu et al. 2008). It is well recognized that GABA has a variety of well-characterized physiological functions i.e. reducing hypertension, diuretic effects, inhibiting proliferation of cancer cells (Park and Oh, 2007) and preventing diabetes (Adeghate and Ponery, 2002). Therefore, the development of functional foods containing GABA has been intensively investigated and produced. Amongst microbes that produce GABA, LAB are the most attractive organisms due to their important roles in producing these fermented foods (Huang et al. 2008; Kim et al. 2009). For instance, Lactobacillus brevis, L. plantarum and Lactococcus lactis are GABA producing LAB (Yokoyama et al. 2002; Li et al. 2008; Lu et al. 2009; Di Cagno et al. 2010). Currently, the bio-synthetic production of natural GABA in beverages produced by LAB is being explored using soymilk (Tsai et al. 2006), dairy products (Park and Oh, 2007), black raspberry juice (Kim et al. 2009) and functional grape must beverages (Di Cagno et al. 2010). Red seaweed (Gracilaria fisheri) grows well in southern Thailand. Generally, this seaweed has been used to produce agar for use in foods like desserts and also for microbiological culture media. However, most recently the red seaweed has been considered as a raw material for producing functional foods. An aqueous extract of G. fisheri has been fractionated and shown to contain: polyphenols, phenolic acid, carotenoids and mycosporine-like amino acids. In addition, Lee et al. (2010) have suggested that seaweed is believed to be a good candidate for the production of safe biologically-active substances. Based on the above observations, red seaweed is now recognized as an attractive raw material for producing functional foods like FPBs. Determining the optimal conditions for fermentation can be investigated by optimizing traditional methods and also from the response of surface methodology (RSM). However, the use of RSM provides more possibilities to test multiple process variables with fewer experimental trials compared to the study of one variable at a time. Based on RSM, the central composite design (CCD) method is popularly used in the vicinity of the optimum conditions to locate the true optimum values of the multiple variables. Hence, the aims of this study were to use CCD for optimizing the initial pH and appropriate concentrations of sucrose and MSG to enhance the amount of GABA present in a fermented red seaweed beverage (FSB) by a selected strain of LAB. The changes of microbial populations and chemical properties during the fermentation were also studied. Materials and Methods Analysis of GABA by HPLC One ml of a culture broth was freeze-dried and the residue was dissolved in 1 ml of an ethanol-water-triethylamine (4:4:2) solution and 80 µl of an ethanol-water-triethylamine-phenylisothiocyanate solution (6:1:1:1) was added. This remained at room temperature for 20 min to allow the formation of phenylisothiocyanate-GABA (PITC-GABA) and then filtered through a 0.45-µm filter and analyzed by HPLC according to the method as described by Cho et al. (2007) with slight modifications as follows: the HPLC was equipped with a Hypersil ODS C18 column (4.0 x 250 mm, 5 µm), a HP 1100 series binary pump, a HP 1100 series autosampler, column oven (46ºC), and an HP 1100 series UV detector (254 nm). The elution solvent system was (A); 1.4 mM sodium acetate, 0.1% triethylamine and 6% acetonitrile (pH 6.1) and (B); 60% acetonitrile. The column was eluted for 50 min with a linear gradient of 0-100% at a flow rate of 1.0 ml/min with (B). Authentic GABA was used as a control and for making a standard curve for calculating the amount of GABA in the samples. Selection of GABA producing LAB A total of 340 LAB strains were isolated from various fermented foods. They were initially screened based on their rapid growth in de Man Rogosa and Sharp (MRS medium) (OD660nm > 1) thus only 124 LAB strains were selected for further investigation for their ability to produce GABA that was detected by thin layer chromatography (Choi et al. 2006). It was found that only 64 strains produced GABA; however, among them only 10 strains clearly showed an ability to produce GABA in MRS broth containing 2% MSG. Consequently, they were grown in MRS broth containing 0.5% MSG at 30ºC for 24 hrs under static conditions and the amount of GABA was detected by HPLC. A strain that produced the highest amount of GABA was selected to use as a starter culture and it was identified using traditional methods as described by Kantachote et al. (2009), such as a commercial test kit (Lactobacillus API 50 CHL 50300, Bio Merieux Co., France) and 16S rRNA genotyping. The selected strain was maintained in MRS agar at 5ºC and subcultured every 2 weeks. The bacterium was subcultured twice to obtain an active culture for the inoculum of each experiment and the incubating conditions for the FSB were set at 30ºC for 24 hrs under static conditions. Description of the experimental design As the fermenting time for producing FSB is very long, MRS broth was chosen as a model to optimize conditions for reducing fermentation time. Consideration of the original composition of the FSB medium and other factors that might affect GABA production, those most likely to have an effect were: initial pH, concentrations of sugar and MSG. The normal sugar used for FPBs is sucrose and its concentration varies in the range of 6 to 12% (Kantachote and Charernjiratrakul, 2008a; Kantachote and Charernjiratrakul, 2008b; Prachyakij et al. 2008). Therefore, the first parameter to be investigated in the MRS medium was the amount of sugar and as a consequence the glucose in the MRS was eventually replaced by sucrose. Addition of MSG to the MRS medium for enhancing GABA production was then varied from 0 to 2% (Cho et al. 2007; Park and Oh, 2007). Varying values of the initial pH from 5 to 7 was also tested as GABA production by LAB from MSG is normally accelerated at these pH values (Cho et al. 2007; Di Cagno et al. 2010). Optimization of the MRS medium for applying to FSB to enhance GABA The optimal combination of sugar, MSG and initial pH for producing GABA in MRS medium by L. plantarum DW12 was examined using different amounts of sugar: X1 (w/v), MSG: X2 (w/v) and initial pH: X3. A Central Composite Design (CCD) was used to describe the nature of the response surface in the normal experimental region. The levels of the 3 variables (X1, X2 and X3) were studied at 3 levels; coded -1, 0, +1 for low (X1: 6, X2: 0 and X3: 5); middle (X1: 9, X2: 1 and X3: 6) and high levels (X1: 12, X2: 2 and X3: 7). To avoid bias, 20 trials were performed in a random order in which 14 axial points (trials 1-14) and 6 center points (trials 15-20) were considered (Table 1). For assessment of the 3 factors, Equation 1 was used. Y = β0+β1X1+β2X2+β3X3+β11X12+β22X22+β33X32+β12X1X2+β13X1X3+β23X2X3 [Equation 1] Where γ is the predicted response, β0: model constant, βi (β1-3):linear coefficients, βii (β11-33): quadratic coefficients, βij (i.e. β12): cross product coefficients; X1, X2 and X3 are independent variables. The experimental design and statistical analysis were performed using Stat-Ease software (Design-Expert 6.0.2 Trial, Stat-Ease Corporation, USA). The optimal fermentation conditions for producing GABA were achieved by solving the regression equations including analyzing the response surface contour plots using the same software. The significances of all terms in the polynomial were judged statistically by computing the F-value at a probability level (P) of 0.01 or 0.05. The model is then resubmitted for statistical analysis to neglect all terms that are statistically insignificant (P > 0.05). Regression coefficients are used to generate a contour map for the regression model and the quality of the fit of the model equations were expressed by the coefficient of determination, R2. The above experimental trials were conducted in 250 ml Erlenmeyer flasks with each flask containing 100 ml of MRS broth and glucose being replaced by sucrose, addition of MSG and adjustment of the initial pH according to the details in Table 1. Three replicates were carried out for each trial and all flasks were incubated at 30ºC under static condition for 25 hrs. Sampling was done every 5 hrs to monitor pH and growth by measuring turbidity with a spectrophotometer set at a wavelength of 660 nm. The amount of GABA was examined after 10 hrs of incubation due to the situation that had produced the highest amount of GABA (data not shown). The optimal experimental conditions, were based on contour plots and the polynomial model for giving the highest value of GABA (6% sucrose, 1% MSG and a pH of 5.73) was verified and all parameters as previously mentioned were measured at the beginning of the experiment and after 10 hrs of incubation. Experimental design for red seaweed fermentation Dried red seaweed was purchased from a local market in Patthani province, Thailand. After cleaning by potable water, it was soaked in potable water until saturated and it was ready for use after being drained. The starter culture was prepared by growing L. plantarum DW12 in MRS broth under static condition at 30ºC until the culture reached its early stationary phase (15 hrs). The cells were harvested by centrifugation at 6,000 rpm for 15 min at 4ºC. After twice washing with 0.85% NaCl, the cell pellet was resuspended to produce 4.1 x 10⁹ CFU/ml (preliminary work) for use as the inoculum. In order to produce FSB as a source of GABA, the initial formula for seaweed fermentation was modified from the traditional formula using data obtained by the CCD. Hence, there were 4 different treatments designed for producing FSB as follows; a traditional formula (seaweed: cane sugar: potable water (3:1:10; w/w/v) without inoculation, and an initial pH of 6 as a control (treatment A); a 5% starter culture was added to the traditional formula (treatment B), a modified formula which is similar to the treatment A, except the amount of sugar was 6% and 1% MSG was added (treatment C) and a 5% starter culture was added to the modified formula (treatment D). The mixed composition of the fermentation after adding 5% of the starter culture had a total volume of 12 L in a 15 L plastic bucket. The space above the fermentation liquid was covered with a plastic bag containing potable water then the bucket’s lid but this was not tightly sealed (Kantachote and Charernjiratrakul, 2008a). All fermentation buckets were incubated at 30 ± 2ºC for 60 days to monitor changes of microbial populations, chemical properties, amount of GABA and microbiological quality, while 120 days of incubation was used to evaluate the sensory test. Enumeration of microbial counts was carried out at days 0, 1, 2, 4, 7, 14, 21, 30, 45 and 60 according to standard methods as described by BAM (2002). Plate Count Agar (PCA) and MRS agar were used to enumerate total bacterial counts (TBC) and LAB by the pour plate method, whereas Potato Dextrose Agar (PDA) were used to count yeasts by the spread plate technique. Standard microbiological methods (BAM, 2002) were used to check microbes at days 0, 14, 30, 45, 60 and 120. Total coliform bacteria and E. coli were counted by the Most Probable Number (MPN) method, while Salmonella sp., Staphylococcus aureus and Clostridium perfringens were grown on Bismuth Sulfite agar (BS), Baird-Parker medium and Perfringens agar, respectively. Yeast numbers were enumerated on PDA by the spread-plate method. All samples used for the microbial counts were also used to monitor the chemical characteristics as follows: the pH (pH meter), total sugar as glucose (Dubois et al. 1956), total acidity as lactic acid (AOAC, 2002). Moreover, samples at days 0, 14, 30, 45 and 60 were used to determine the amounts of end products or metabolites. Acetic acid, lactic acid, ethanol and methanol were assayed by gas chromatography (GC) according to the method of Yang and Choong (2001) while the amount of GABA was determined as previously described. As there was no investigation of the MSG consumed in this study, the GABA conversion efficiency (%) was calculated from Equation 2.
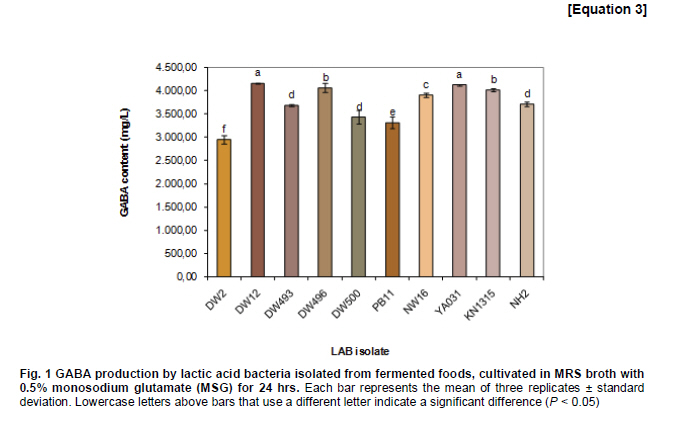
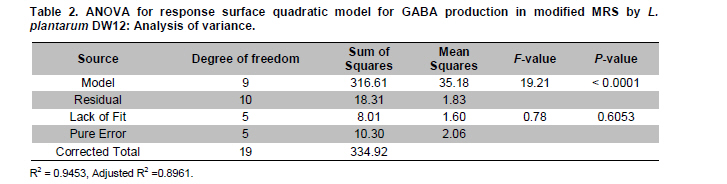
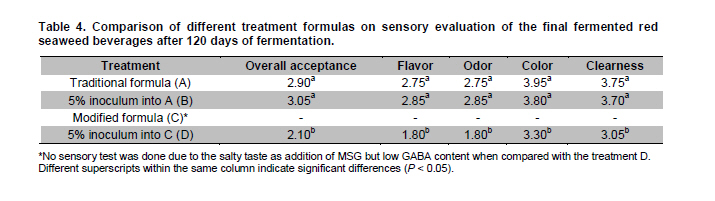
[GABA] = concentration of GABA at time of sampling (g/L) [GABA]max = concentration of GABA when all MSG converted to GABA by fermentation (g/L) [GABA]0 = concentration of GABA at the time of starting fermentation (g/L) [MSG]0 = concentration of MSG added (this study, 1% = 10 g/L) 169.13 and 103.12 are molecular weights of MSG and GABA, respectively. After 120 days of fermentation all sets of the FSB, except for the treatment C due to its salty taste were organoleptically evaluated by 20 panelists using the 5-point hedonic scale on the following factors: flavor, odor, color, clearness and overall acceptance (Meilgard et al. 1998). However, for all treatments the amount of GABA, counting of microbial populations and microbiological quality were also conducted at this time. Statistical analysis All experiments were performed in triplicate and the raw data for all parameters were analyzed using the multiple general linear model in order to establish whether the monitored parameters were affected by the variable conditions used for the fermentation. A mean value and standard deviation are presented. Statistical significance was evaluated using DMRT (Duncan’s Multiple Range Test) and P < 0.05 was considered to be significant. Results Selection of GABA producing LAB Among 10 selected LAB strains, strain DW12 gave the highest amount of GABA (4156 mg/L, productivity 173.17 mg/L/hr) and although there was no significant difference between strains DW12 and Lactobacillus acidophilus YA031 (4144 mg/L, productivity 172.67 mg/L/hr) (Figure 1) the former strain was selected for use as a starter culture due to it being isolated from a fermented seaweed beverage whereas the latter strain was isolated from a commercial yogurt. The strain DW12 was identified as Lactobacillus plantarum DW12 using traditional methods, such as by a commercial test kit (API 50CHL) and 16S rDNA genomic sequence analysis (data not shown). Optimization of the MRS medium for applying to FSB to enhance GABA Varying concentrations of sucrose, MSG and initial pH values for GABA production in MRS medium by L. plantarum DW12 were optimized using the CCD. The optimum GABA production under the static condition was predicted and this was confirmed by the actual observations (Table 1). Data obtained from the experimental trials were analyzed by linear multiple regression using the software as mentioned previously and in order to account for possible errors, the center point in the design was repeated six times. The application of the response surface method gave the following regression Equation 3 for GABA determination. Y (GABA) = 6.53609 - 5.0857X1 + 8.63364X2 - 2.08182X22 [Equation 3] According to Equation 3 , the GABA concentration represented as (Y), is a function of the sucrose (X1) and the MSG concentration (X2). The highest amount of GABA to be obtained from the prediction was 24.71 mg/L (trial no. 3; 6% sucrose, 2% MSG and initial pH 5) while the actual value of this trial was 24.29 mg/L. In contrast, the highest actual value of GABA (25.04 mg/L) was found in trial no. 9 (6% sucrose, 1% MSG and initial pH 6) while the predicted value of GABA was only 23.34 mg/L. The amount of GABA is related to the bacterial growth as the growth in trial no. 9 (OD660nm = 4.54 ± 0.06) was considerably higher than that found in the trial no. 3 (OD660nm = 2.54 ± 0.08). The final pH of both trial numbers was the same at a pH of 3.9. The statistical significance of the Equation 3 was checked by the F-test, and the analysis of variance (ANOVA) for a response surface linear model (Table 2). The ANOVA of the linearity of the Equation 3 indicated that the model significance had a P-value of < 0.0001. The values of the coefficient R2 and adjusted R2, being a measure of the fitness of the regressed model, were 0.9453 and 0.8961 respectively. This indicates that the experimental data were in good agreement with the predicted values. Based on Table 3 the variable with the largest effect on GABA yield was the linear term of the concentration of sucrose (X1) (P < 0.0001) followed by the linear term of MSG (X2) (P < 0.0001) and the quadric term of the MSG addition (X22) (P = 0.0288). Consequently, the optimal levels for the 3 factors as obtained from the maximum point of the polynomial model including contour plots (data not shown) were estimated by the Design Expert software to be sucrose, MSG and initial pH at 6%, 1% and 5.73, respectively to gave a predicted GABA value at 23.43 mg/L with the desirability (R2) being 0.9360. Hence, these optimal levels were selected to verify GABA production by L. plantarum DW12. It was found that 25.01 mg/L GABA was obtained in the verification test and this was very close to the actual result in the trial no. 9 (25.04 mg/L). Therefore, the conditions of the trial no. 9 (6% sucrose, 1% MSG and initial pH 6) were selected for producing FSB to obtain high GABA levels and this was adopted as the modified medium recipe. Experimental design for red seaweed fermentation The TBC in each treatment of the FSB throughout the fermentation are shown in Figure 2a. Significant differences were found for the initial numbers of TBC in A, B, C and D treatments at 7.45, 8.37, 7.05 and 9.41 log CFU/ml, respectively. The highest TBC level for most of the fermentation times was in treatment D and there was no significant difference observed for treatments A, B and C. At the end of fermentation (60 days), the TBC level was in the order of treatments D > A > B > C (6.23, 4.32, 4.18 and 3.69 log CFU/ml). The initial numbers of LAB were significantly different in treatments A and C at 2.37 and 2.46 log CFU/ml, compared to B and D treatments at 8.24 and 9.16 log CFU/ml, respectively (Figure 2b). However, LAB numbers in treatments (A and C) significantly increased within the first 2 days of fermentation whereas there was little change in the LAB levels observed in the inoculated treatments (B and D) at day 7. Consequently, at 14 days the LAB level significantly declined for treatments (B and D), whereas treatments (A and C) were found at day 7. Over 60 days, the numbers of LAB in B and D treatments (3.49 and 5.97 log CFU/ml) were higher than those found in A and C treatments (2.65 and 2.46 log CFU/ml). The initial numbers of yeasts in all treatments were approximately 6 log CFU/ml (Figure 2c). After 1 day, yeast numbers in all treatments rapidly increased to roughly 8 log CFU/ml but over 7 days of fermentation a big decrease was found. The highest number of yeasts was found in the treatment D, particularly from day 7 until day 60 while treatments A, B and C gave a similar result. The numbers of yeasts at day 60 were 2.60, 2.50, 2.47 and 3.57 log CFU/ml for treatments of A, B, C and D, respectively. The change in sugar concentrations throughout the fermentation was similar in all treatments as they all regularly decreased for 7 days and then decreased more rapidly from day 7 to day 14 (Figure 3a). The lowest initial sugar concentration in C and D (modified formula) treatments was roughly 7% and for the other treatments (A and B) were roughly 10%. However, over 14 days of fermentation there was no significant difference observed for the sugar levels in all treatments that slightly decreased and at the end of fermentation was between 0.6-0.8%. A sharp drop of the pH from 6 to 4.3 for the treatment B and to 5.3 for the other treatments was found within 1 day of fermentation and after that for all treatments there was a slight decrease (Figure 3b). Over 60 days, the pH value of all treatments was in a range of 3.2-3.8 and the highest was found in the treatments C and D. Over the first 7 days, the total acidity in all treatments was less than 0.5% but then a rapid increase was observed, as the sugar was consumed particularly in treatment D (Figure 3b). After day 60, the treatment D had a higher total acidity (2%) than that found in treatments A, B and C (1%). The levels of acetic acid and lactic acid in all treatments had similar behaviors as their amounts increased along with the fermenting times and the levels of the former were lower than those of the latter (Figure 3c). The amount of acetic acid was found to be in a range of 0.26-0.33 g/100 ml with the highest amount in the treatment D. In contrast, treatment C gave the lowest amount of lactic acid at 0.38 g/100 ml and in the A, B and D treatments the amount of lactic acid was 0.42, 0.92 and 0.91 g/100 ml, respectively. Increasing ethanol levels occurred with increasing fermentation times. The highest ethanol was also found in treatment A (3,660 mg/L) while for treatment B and C the ethanol levels were higher (2,340 and 2,220 mg/L) than that for treatment D (1,650 mg/L) (Figure 4). The amount of methanol was always less than the detectable level (3 mg/L) in all treatments. A significant increase of GABA levels throughout the fermentation times was found only in treatments C and D with added MSG (Figure 4). However, the highest GABA content was observed at days 45 and 60 in treatment D with added starter culture (3,998mg/L, productivity 88.84 mg/L/day) followed by the GABA content in treatment C with added MSG but no addition of starter culture (1,690 mg/L, productivity 37.56 mg/L/day), whereas for treatments A and B with no added MSG, GABA levels were very low at 339 mg/L (productivity 7.53 mg/L/day) for A without addition of starter culture and 730 mg/L (productivity 16.22 mg/L/day) for B with added starter (Figure 4). The conversion efficiency of MSG to GABA (based on maximum GABA production at day 45 in Figure 4) was highest in treatment D (58%) followed by treatment C (22%) whereas the lowest efficiency was found in treatments A and B at roughly 2%. The microbiological quality and chemical quality of all FSB treatments were also investigated after 60 and 120 days of fermentation. Based on Thai Microbiological Quality Guidelines, Section of Food Analysis, Division of Medical Science, Ministry of Public Health, all the finished products of FSB met standard guidelines as there was no detection of; bacterial indicators (E. coli and total coliforms); foodborne pathogenic bacteria (S. aureus, Salmonella sp. and C. perfringens) and methanol. The standard guideline for methanol is 240 mg/L. However, at day 60 all treatments did not pass the standard guideline for yeast counts (2 log CFU/ml). In contrast, at day 120 there were no problems with yeast contamination (< 2 log CFU/ml). These finished products were therefore used for the sensory evaluation. Moreover, the numbers of LAB at day 120 in all treatments (A, B, C and D; 2.44, 3.42, 2.32 and 5.67 log CFU/ml) were close to those at day 60 (Figure 2b) while the GABA content in treatments A, B, C and D were 450, 453, 1125 and 2,915 mg/L, respectively. Based on a preliminary test, treatment C was not included in the sensory test because its taste was more salty than for treatment D because of the addition of MSG but its GABA content was significantly lower than that found in the treatment D. The sensory evaluation results were the lowest for treatment D for all factors tested (overall acceptance, odor, color, clearness and flavor) while there was no significant difference found in treatments A and B (Table 4). Both fermented red seaweed beverages obtained from treatments A and B had a higher score for their color (3.80-3.95) and clearness (3.70-3.75) although there were only moderately acceptable for flavor (2.75-2.85), odor (2.75-2.85) and the overall acceptance (2.90-3.05). The overall characteristics of the FSB products were a clear solution with yellow color, a little sweet with sour flavor and a small amount of seaweed odor. In addition, to its sour taste the treatment D had a salty taste. Discussion The optimal conditions for the MRS obtained from the CCD analysis after the verification test (6% sucrose, 1% MSG and initial pH 6.0) were used to create a modified formula for producing FSB by L. plantarum DW12. The results obtained in the present study were in agreement with Di Cagno et al. (2010) who reported that the highest amount of GABA was produced by L. plantarum when the initial pH was 6.0 and 1% MSG was added to the medium (Ueno et al. 1997; Lu et al. 2008). However, the maximum GABA content in the trial no. 9 was only 25.04 mg/L (Table 1) and GABA productivity was only 2.5 mg/L/hr. That value was very low when compared with the original MRS medium containing 0.5% MSG (Figure 1). The explanation for this is that the amount of sucrose used in the modified MRS medium was very high (6%) compared to that of 2% of glucose in the original MRS medium. As previously described the modified MRS medium was used as the model for studying the optimal fermentation conditions for producing FSB and the final composition of the beverage usually requires a fermenting time of at least 2 months to obtain a normal product. Hence, the more suitable sampling time should be 2 months to obtain a higher GABA content; however, the optimal conditions obtained in this model could be applied for producing FSB by allowing the fermentation to continue until its normal fermentation time for obtaining a product. Among the FSB treatments significant differences were found for the initial numbers of TBC and LAB; however, there were no significant differences for the yeast numbers (Figure 2a and Figure 2c). This also indicated that inoculation did produce higher numbers of TBC and LAB but the numbers in the control A and C were almost the same as for B and D treatments after 2 days and LAB were the dominant bacteria in all treatments. Due to the numbers of LAB being very close to the numbers of TBC this indicated that almost all the TBC were LAB. However, contamination by yeasts occurred in all treatments (Figure 2c) presumably from the red seaweed used from Pattani province as the initial numbers of yeast was roughly 6 log CFU/ml compared to 3-3.5 log CFU/ml when the red seaweed was obtained from Songkhla province (Prachayakij et al. 2008). This highlights the possibility that different sources of seaweed and their processing to obtain dried seaweed can cause different amounts of microbes, particularly yeasts and can have significant effects on the microbiological quality of the finished products. Other factors that might have an effect on the microbial population were the addition of inoculants and MSG (treatment D) and the high concentration of sugar in treatment B (10%) compared to treatment D (6%). The MSG is a major source of nitrogen (Di Cagno et al. 2010) and the osmotic pressure in the treatment B is higher than the treatment D. This could explain why the microbial populations in the treatment D were higher than those in the treatment B (Figure 2a and Figure 2b). As expected for all treatments a decreasing amount of sugar was related to an increasing total acidity and a declining pH. However, the total acidity in treatment D (2%) was higher than the other treatments (1%) even though the sugar concentration was lower (6% compared to 10%) (Figure 3a and Figure 3b). This was most likely due to the treatment D being supplemented with MSG (Figure 3b and Figure 4). However, the results for treatment C indicated that a lower acidity was not due to the addition of a starter culture. This overall profile is in general similar to the findings of Prachayakij et al. (2008) who used L. plantarum DW3 as a starter culture in FSB. However, L. plantarum is a facultative heterofermenter often found in FPBs (Kantachote et al. 2008a; Kantachote et al. 2009) so considerable amounts of both lactic acid and acetic acid were detected (Figure 3c). However, higher amounts of acetic acid and ethanol and less lactic acid were found in treatments A and C presumably due to the presence of a slightly different natural population of LAB (Figure 3c and Figure 4). In addition, the results in Figure 4 show that the inoculant DW12 played an important role in GABA production in the FSB. Addition of MSG to the FSB fermentation provided the most important increase in GABA production (treatments C and D) with a significantly higher productivity and conversion efficiency than that found in treatments without the addition of MSG (A and B). In addition, using a GABA producing strain like DW12 as a starter culture was also important for obtaining a higher level of GABA in FSB as the conversion efficiency in the treatment D was 2.64 times that of treatment C without inoculation. Indeed, red seaweed was also a source of MSG but this was not high. The levels of GABA obtained in treatment D, roughly 4,000 mg/L during days 45 and 60 of the fermentation are high for the product to be considered as a functional fermented beverage. In contrast, the GABA content in treatment C was only 1690 mg/L, and the results showed that the starter culture is required to obtain FSB enriched with GABA. Based on GABA productivity, treatment D by L. plantarum DW12 (88.84 mg/L/day; initial pH 6, 1% MSG, 30ºC, 45 day) was significantly lower than that found in functional grape must beverage by L. plantarum DSM19463 (166 mg/L/day; initial pH 6, 0.27% L-glutamate, 30ºC, 3 day) (Di Cagno et al. 2010). It seemed to be not suitable to make comparisons as above because of the differences in the kind of plant used, the fermentation time and the dose of MSG added. However, GABA content in the treatment D is high enough to achieve a functional fermented beverage (will be discussed later). Oral administration of GABA in rice germ of 26.4 mg daily has been shown to be effective in treating neurological disorders (Okada et al. 2000) while oral administration of GABA of 10 mg daily for 12 week was effective for hypertensive patients (Inoue et al. 2003). One need therefore drink less than 10 ml/day of the FSB obtained by treatment D to provide similar functional benefits. However, the residual MSG in FSB must be considered especially as it had an effect on the taste of FSB, particularly its salty taste (will be discussed later). This result indicates that the MSG added to the FSB was not completely converted to GABA by the starter culture DW12 and/or by other indigenous lactobacilli. This means that the amount of MSG added was too high and it should be reduced to achieve an appropriate amount for an FSB. After 60 days of fermentation, the numbers of beneficial microbe like LAB in the treatments after inoculation (B and D) were higher than those in the control treatments (A and C) and this was not surprising due to the addition a 5% inoculum of L. plantarum DW12. In addition, it is not known if the naturally produced LAB had similar beneficial properties to those of L. plantarum DW12. The finding that the numbers of yeasts did not initially pass the Thai standard guideline could possibly be reduced by using an antiyeast strain such as L. plantarum DW3 (Prachyakij et al. 2008). However, over 120 days all treatments met all the Thai standard guidelines for FSBs and fortunately the amount of LAB were similar to those present at day 60 although the GABA content of treatment D at 120 days had decreased by 25%. This does indicate that FSB in all treatments provided suitable conditions for maintaining viable LAB. In general, FPBs will be sold in undiluted form to ensure preservation of the finished products and they will be diluted by consumers before drinking and how much to dilute depends on their taste. In this study the finished FSB products were tested without dilution and this was the main reason that panelists gave only moderately good scores for all the factors tested and low scores for flavor and odor by treatment D (Table 4). The main problem of FSB from the treatment D was caused by its salty taste from the original MSG content and this may also interfere with the odor of this beverage. This work has produced a similar result to that of Kim et al. (2009) who reported that addition of 2% MSG as a source for GABA in black raspberry juice produced a negative perception to the consumers. Hence, further studies should be conducted on how much MSG needs to be added to achieve a high GABA content and a more satisfactory result from the sensory test. Overall the key features of the FSB, that were significantly better than those found in the traditional formula (treatment A), inoculation without addition of MSG (treatment B) and the modified formula without addition of starter (treatment C), were the presence of a high amount of GABA and the presence of sufficient LAB, presumably mostly L. plantarum DW12 (treatment D), that might also act as a probiotic will make this FSB be a novel functional beverage. Acknowledgments We would like to thank Dr. Brian Hodgson for his assistance in English. References
The following images related to this document are available:Photo images[ej11024t3.jpg] [ej11024t4.jpg] [ej11024f1.jpg] [ej11024f4.jpg] [ej11024f3.jpg] [ej11024t2.jpg] [ej11024t1.jpg] [ej11024f2.jpg] |
| |||||||||


 copy/ej14(3)/photo/ej11024t1.jpg)