 |
| About Bioline | All Journals | Testimonials | Membership | News |
|
||||||
|
||||||
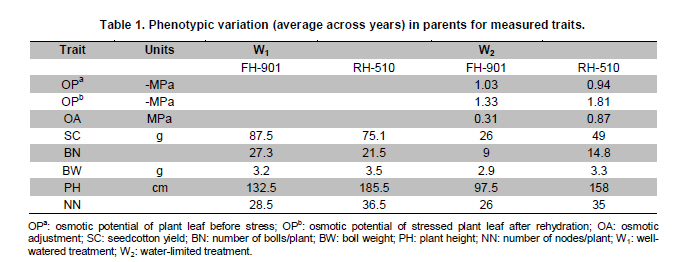
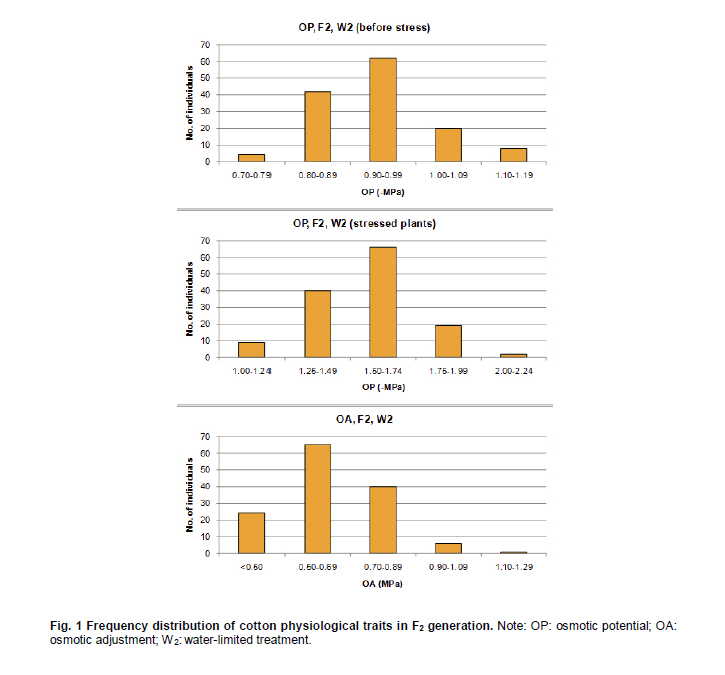
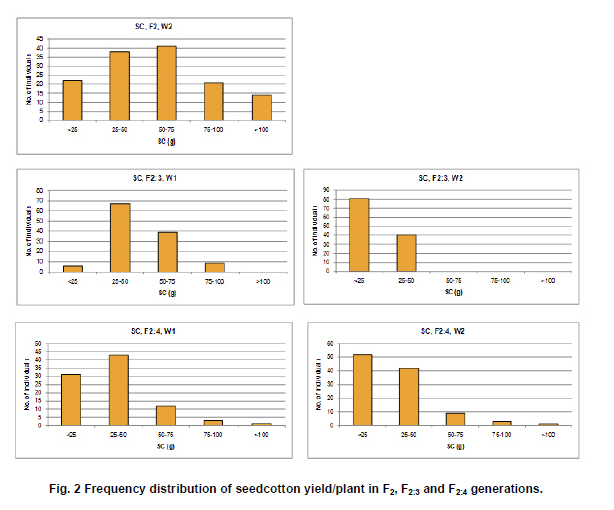
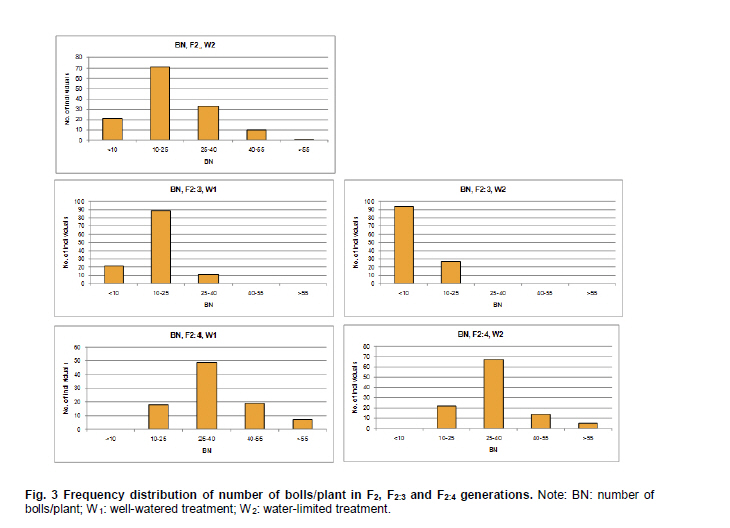
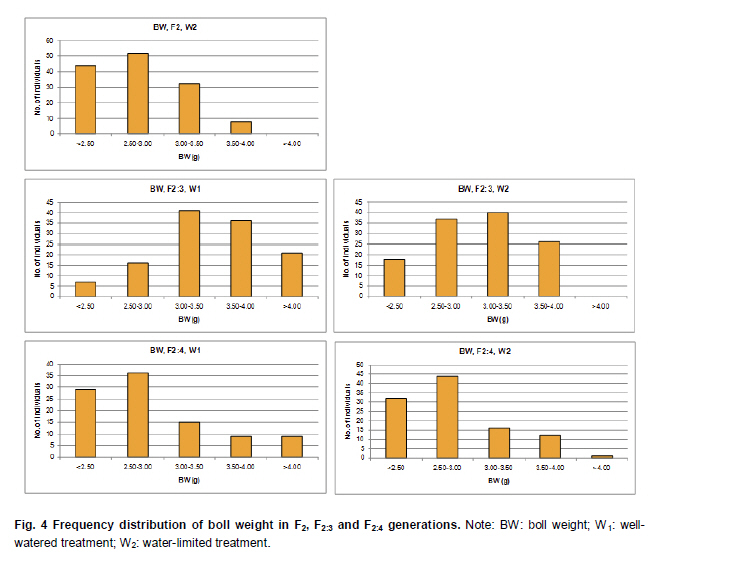
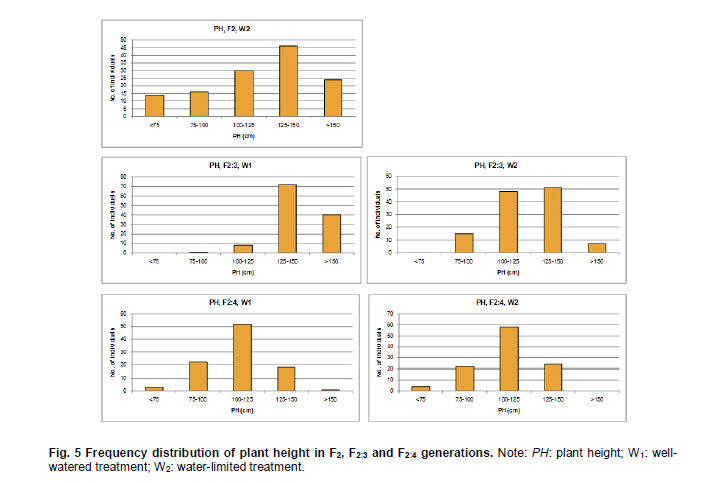
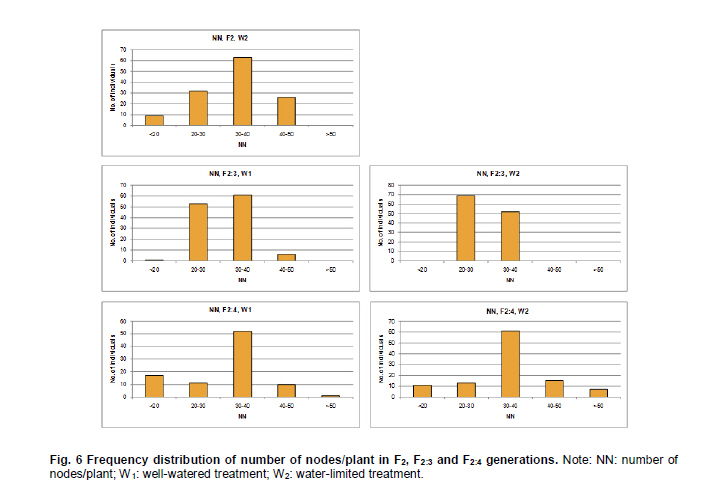
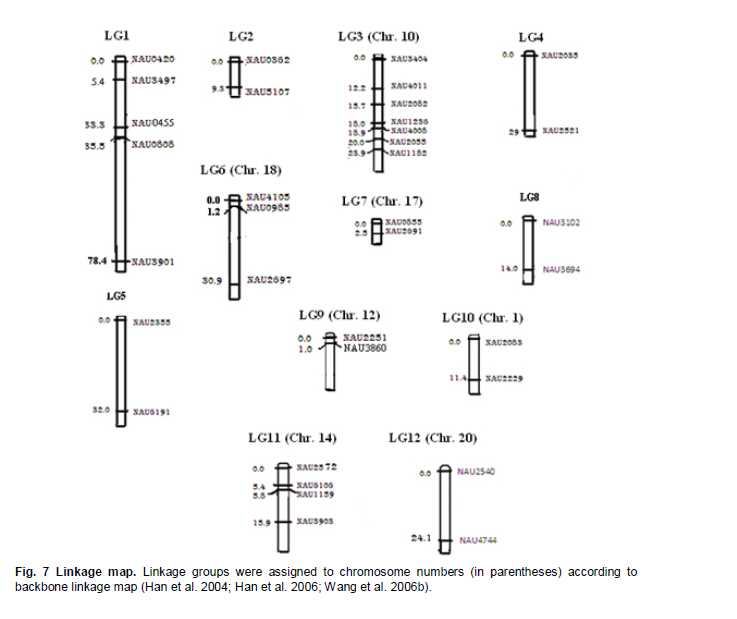
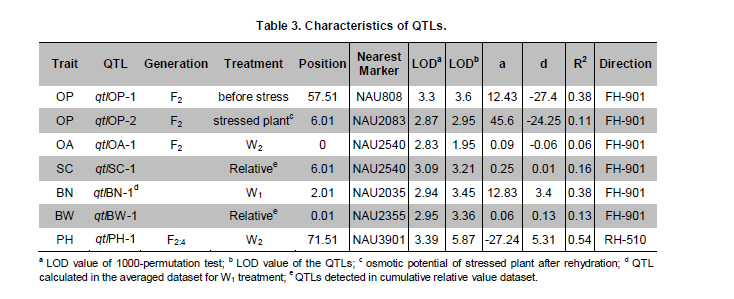
Electronic Journal of Biotechnology, Vol. 14, No. 3, May 15, 2011 QTL mapping for physiology, yield and plant architecture traits in cotton (Gossypium hirsutum L.) grown under well-watered versus water-stress conditions Muhammad Saeed1 · Wangzhen Guo1 · Ihsan Ullah2 · Nabila Tabbasam2 · Yusuf Zafar2 · Mehboob-ur-Rahman2 · Tianzhen Zhang*1 1 Cotton Research Institute, National key Laboratory of Crop Genetics and Germplasm Enhancement, Nanjing Agricultural University, Nanjing 210095, China *Corresponding author: cotton@njau.edu.cn Financial support: This work was financially supported in part by grants from the High-tech program 863 (2006AA100105), Jiangsu province key project (BE2008310), the 111 Project (B08025) and China and Pakistan Joint Research and Development Project (16-409). Recieved: August 23, 2010 Accepted: February 23, 2011 Code Number: ej11026 Abstract Increasing scarcity of irrigation water is a major threat to sustainable production of cotton (Gossypium hirsutum L.). Identifying genomic regions contributing to abiotic stress tolerance will help develop cotton cultivars suitable for water-limited regions through molecular marker-assisted breeding. A molecular mapping F2 population was derived from an intraspecific cross of the drought sensitive G. hirsutum cv. FH-901 and drought tolerant G. hirsutum cv. RH-510. Field data were recorded on physiological traits (osmotic potential and osmotic adjustment); yield and its component traits (seedcotton yield, number of bolls/plant and boll weight); and plant architecture traits (plant height and number of nodes per plant) for F2, F2:3 and F2:4 generations under well-watered versus water-limited growth conditions. The two parents were surveyed for polymorphism using 6500 SSR primer pairs. Joinmap3.0 software was used to construct linkage map with 64 polymorphic markers and it resulted into 35 markers mapped on 12 linkage groups. QTL analysis was performed by composite interval mapping (CIM) using QTL Cartographer2.5 software. In total, 7 QTLs (osmotic potential 2, osmotic adjustment 1, seedcotton yield 1, number of bolls/plant 1, boll weight 1 and plant height 1) were identified. There were three QTLs (qtlOP-2, qtlOA-1, and qtlPH-1) detected only in water-limited conditions. Two QTLs (qtlSC-1 and qtlBW-1) were detected for relative values. Two QTLs (qtlOP-1 and qtlBN-1) were detected for well-watered treatment. Significant QTLs detected in this study can be employed in MAS for molecular breeding programs aiming at developing drought tolerant cotton cultivars. Keywords: composite interval mapping, cotton, drought tolerance. Introduction Cotton is the world’s leading natural fiber crop. Regardless of whether it is irrigated or not, cotton is often exposed to drought, which adversely affects both yield and lint quality (Pettigrew, 2004). Drought, induced by soil and/or atmospheric water deficit, poses the most important environmental constraint to plant survival and crop productivity (Boyer, 1982). With increasing aridity and population growth, water is expected to become even scarcer in the near future (Chaves et al. 2003). Developing drought resistant crop plants is vital to meeting increased demand for agricultural products and mitigating the effects of an anticipated environmental shift towards greater aridity (Parry et al. 2005). This solution, however, requires comprehensive understanding of plant adaptive mechanisms and responses to water stress at their underlying physiological and genetic mechanisms. Cotton is originated from wild plants adapted to semi-arid, subtropical environments, however, intensive selection has narrowed the genetic variability for drought tolerance (Rosenow et al. 1983) which made difficult to further improve the yield potential. To exploit the existing variability for drought tolerance in cotton, low heritability of yield under stress, length of required-time for improvement program and inherent variation in the field are the limitations of conventional breeding approaches. Molecular marker technology can be helpful in the identification of genomic regions harboring important QTLs involved in drought tolerance. A wide range of responses at the molecular, cellular and whole plant levels have been determined in plants those help to tolerate water deficit (Xiong and Zhu, 2002; Bartels and Sunkar, 2005). A variety of adaptive mechanisms are considered important in conferring drought tolerance in different plant species, however, some basic cellular responses to drought appear conserved among all plants. Accumulation of osmoprotectants helps through osmotic adjustment (OA) to maintain metabolic activity, growth and productivity during drought (Ashraf and Harris, 2004; Ashraf and Iram, 2005). A relationship between OA and plant productivity under water-limited environments has been found in a number of crops, for example, wheat (Moinuddin et al. 2005), sunflower (Chimenti et al. 2002) and canola and mustard (Niknam et al. 2003). In the past, there are some reports of quantitative trait loci (QTL) mapping under arid conditions for various traits thought to be associated with stress tolerance, such as osmotic adjustment (Lilley et al. 1996), water use efficiency (WUE) (Mansur et al. 1993) and abscisic acid levels (Tuberosa et al. 1998). There is limited research on drought tolerance in cotton. QTL mapping for drought tolerance in cotton has been reported for productivity, physiology and fiber quality (Saranga et al. 2001). Levi et al. (2009a) concluded that the improvement of drought related traits in cotton NILs may lead to improved drought resistance via MAS, but that conventional breeding may be necessary to combine the introduced QTL(s) with high yield potential. This finding was further supported by characterization of photosynthetic activity of two cotton Near isogenic lines (NILs) and their recipient parents under dryland vs irrigated field conditions (Levi et al. 2009b). Two NILs performed extremely well compared to their recipient parents in drought related traits but they did not differ significantly from their recipient parents in yield. In the present research, QTL mapping was done for physiology; yield and its components; and plant architecture traits of cotton grown under well-watered vs water-stress conditions. This is the first effort in which intraspecific Upland cotton (Gossypium hirsutum L.) populations are used for QTL mapping of drought tolerance. The field experiments of this research project were performed at National Institute for Biotechnology & Genetic Engineering (NIBGE), Faisalabad, Pakistan and laboratory work was carried out at the Cotton Research Institute, National Key Laboratory for Crop Genetics and Germplasm Enhancement, Nanjing Agricultural University, Nanjing, China. There were some significant QTLs detected for osmotic potential, seedcotton yield, number of bolls/plant, boll weight, and plant height which can be used in MAS for future molecular breeding programs. These will be helpful in evolving drought tolerant cotton varieties which may help to grown in water-limited environments successfully. Materials and Methods An F2 population was raised from intraspecific cross between two G. hirsutum cultivars (FH-901, a drought sensitive and RH-510, a drought tolerant cultivar, Rahman et al. 2008). The F2 population consisting of 136 individuals was raised during 2005. Next year (2006), 136 lines of F2:3 generation evaluated, which were bred to grow 136 lines of F2:4 generation during 2007. All these field experimentation and phenotyping was carried out at National Institute for Biotechnology and Genetic Engineering (NIBGE), Faisalabad, Pakistan. This institute is situated 31º-26'N latitude, 73º-06'E and at an elevation of 184.5 meters from the sea level. There were two water regimes: well-watered (W1) and water-limited (W2). Daily rainfall during each growing season was recorded. The experiment was laid out according to randomized complete block design with irrigation treatments in the main blocks and genotypes/family lines in the sub-blocks with three replications. F2 was evaluated under water-limited (W2) growth conditions. F2:3 and F2:4 were evaluated both under well-watered (W1) and water-limited (W2) growth conditions. All other standard agronomic practices for normal crop growth were applied to both the treatments equally. The two water regimes were described as: W1: One sowing irrigation and 5 subsequent irrigations as required for normal crop growth and development, total water applied including rainfall was 792 and 826 mm in 2006 and 2007, respectively. W2: One sowing irrigation and one supplement irrigation 40 days after sowing (DAS), total water applied including rainfall was 465, 460, and 632 mm in 2005, 2006 and 2007, respectively. During 2007, there were unusual more rains during cotton growing season in Faisalabad region (field experimentation site of this project) of Pakistan. Due to this the water-limited treatment (W2) could not maintained accurately during F2:4 generation. So F2:4 lines under water-limited treatment (W2) did not experience stress conditions evenly throughout growth period. Phenotyping Osmotic adjustment was measured by the rehydration method of Blum (1989). This method estimates osmotic adjustment as the difference in osmotic potential of leaves before stress and osmotic potential of stressed plants after rehydration. Leaves were sampled from the same plant two times. Firstly, before stress application and secondly, when the plant was under water stress. For rehydration, petioles of detached leaves were inserted into water and incubated at 10ºC for 4 hrs in dark. Upon rehydration a 5 x 5 piece of leaf tissue was excised, avoiding midrib, and placed immediately in a 5 mL disposable plastic syringe and stored at -20ºC. After 2 weeks, samples were thawed and tissue sap was collected in 0.2 mL tubes. After centrifugation (at 13000 rpm) for 5 min, the sap was directly used to determine osmotic potential (OP) with a vapor pressure osmometer (Wescor, model 5200 Wescor, Loga, UT). Due to the size of the experiment, osmotic adjustment phenotyping was done in F2 generation only. Seedcotton was hand-picked from all the plants 180 DAS and was sun dried for one day after removing trash and dry carpels before weighing. The total number of bolls/plant (BN) was scored by counting and boll weight (BW) was estimated by dividing seedcotton yield (SC) per plant by number of bolls/plant (BN). Plant height (PH) was recorded in centimeters from the first cotyledonary node to the apical bud. The number of nodes per plant was counted including cotyledonary node to the apex of the plant. For F2:3 and F2:4 generations, relative values for all traits were also calculated by using formula: Relative value = value under W2 treatment/value under W1 treatment. This helped to eliminate inherent differences in genetic potential for traits among genotypes. Traits were also averaged across generations (F2:3 and F2:4) and respective treatments (W1 and W2). Average value of W2 treatments of F2, F2:3 and F2:4 generations was divided by average value of W1 treatments of F2:3 and F2:4 generations to get overall relative value for respective trait, as illustrated for overall relative seedcotton yield below: Overall relative seedcotton yield = (Average seedcotton yield of W2 treatments of F2, F2:3, F2:4) / (Average seedcotton yield of W1 treatments of F2:3, F2:4). DNA extraction Plant leaf samples were collected from six-weeks old plants. Three leaves per plant were harvested from individual F2 plants and stored at -80ºC until analysis. Genomic DNA was extracted as described by Paterson et al. (1993). SSR screening The parents were surveyed for polymorphism using 6500 simple sequence repeat (SSR) primer pairs that were separately obtained from the following sources: BNL primers from Research Genetics Co. (Huntsville, AL, USA, http://www.resgen.com); JESPR from sequences of Reddy et al. (2001); TM from Dr. John Yu, USDA-ARS, Crops Germplasm Research Unit, TE, USA; CIR from Nguyen et al. (2004). The SSR primers of NAU (Nanjing Agricultural University) were expressed sequence tags (EST)-SSR designated “NAUXXX”, using “NAU” as a short prefix for Nanjing Agricultural University, and “XXX” as the serial number of the SSR marker (Han et al. 2006). Marker nomenclature consisted of a letter that specified the origin of marker, followed by the primer number. Microsatellites were amplified by standard PCR procedures described by Zhang et al. (2000). DNA bands of SSRs were developed with silver staining and recorded with SX-image system (Sixing Biological Technology Co. Shanghai, China). One hundred and thirty six F2 individuals were screened for the 63 pairs of microsatellite markers. The chi-square test for goodness of fit was used to assess the Mendelian 1:3 (for dominant marker) and 1:2:1 (for codominant marker) inheritance ratio in F2 segregating population. Linkage map construction Linkage map was derived from 64 (63 primer pairs yielded 64 marker loci) markers using Joinmap3.0 (Van Ooijen and Voorrips, 2001). The Kosambi mapping function (Kosambi, 1944) was used to convert recombination frequency to genetic map distance (centiMorgan, cM). Markers were grouped with log-of-odds (LOD) scores = 3. Linkage groups were assigned on chromosomes using our backbone linkage map (Han et al. 2004; Han et al. 2006) and bacterial artificial chromosome (BAC)- fluorescent in situ hybridization (FISH) results (Wang et al. 2006b). QTL analysis QTL Cartographer2.5 software program was used to analyze marker-QTL associations using test statistics composite interval mapping (CIM). Input files for each program containing the linkage map, and the phenotypic and molecular marker data were prepared according to the instructions given in the manuals (Basten et al. 2001; Van Ooijen and Voorrips, 2001). The proportion of observed phenotypic variance attributable to a particular QTL was estimated by the coefficient of determination (R2) from the corresponding model (Basten et al. 2001) for analysis. Permutation-1000 test (P < 0.05) was performed to determine threshold LOD value to declare a QTL. Results Phenotypic variation Significant differences existed between parents and also between individuals in F2, F2:3 and F2:4 generations under both well-watered and water-limited growth conditions for each trait (Table 1 and Table 2). The frequency distribution of all traits in F2, F2:3 and F2:4 generations showed typical quantitative variation and all variables fitted a normal distribution (Figure 1, Figure 2, Figure 3, Figure 4, Figure 5 and Figure 6). SSR analysis and genetic linkage map construction Sixty three SSR primer pairs, which were found to be polymorphic between parents, were chosen to analyze the F2 population. In total, sixty four SSR polymorphic segregating loci were generated. Linkage analysis led to a final genetic map (Figure 7) with 12 LGs comprising 35 loci, totally covering 273.11 cM, which is 5.84% of the allotetraploid cotton genome. With the help of our backbone linkage map (Han et al. 2004; Han et al. 2006; Wang et al. 2006b), LG3, LG6, LG7, LG9, LG10, LG11 and LG12 were assigned to Chrs. 10, 18, 17, 12, 1, 14, and 20, respectively. The number of markers of the 12 LGs ranged from 2 to 7 markers with an average length of 22.76 cM. The LG with greater number of markers consisted of 7 marker loci covering 23.94 cM, and the smallest-sized was an LG consisting of 2 marker loci covering only 1.0 cM. Overall, the average distance between consecutive loci was 8.03 cM, but the density of markers varies between LGs, ranging from 1.0 cM (LG9) to 32.38 cM (LG5). The largest gap between two adjacent loci was 42.92 cM (LG1). QTL analysis Analysis of the F2, F2:3 and F2:4 populations resolved 7 QTLs (osmotic potential 2, osmotic adjustment 1, seedcotton yield 1, number of bolls/plant 1, boll weight 1 and plant height 1) (Table 3). The characteristics of QTLs contributing to every trait are described below: Physiological traits. Two QTLs (qtlOP-1 and qtlOP-2) were detected for osmotic potential and one QTL (qtlOA-1) was detected for osmotic adjustment (Table 3). qtlOP-1 was detected in the non-stressed plants dataset, whereas, qtlOP-2 was detected in the dataset of water-stressed plants. The nearest markers to these QTLs were NAU808, NAU2083 and NAU2540 respectively. The phenotypic variance explained (R2) value for these QTLs was 38.3%, 11.4% and 6% respectively. Yield and its component traits. Three QTLs were detected for yield and its component traits (seedcotton yield 1, number of bolls/plant 1 and boll weight 1) (Table 3). qtlSC-1 was detected for the overall relative seedcotton yield. The nearest marker to qtlSC-1 was NAU2540 located on chromosome 12. Phenotypic variance explained (R2) value was 15.7%. qtlBN-1 was detected for number of bolls/plant. This was detected in well-watered environment (W1). The nearest marker to qtlBN-1 was NAU2035 and the phenotypic variance explained was 37.9%. This was a major QTL affecting number of bolls/plant. One QTL (qtlBW-1) was detected for boll weight. qtlBW-1 was detected for cumulative relative value. The nearest marker to qtlBW-1 was NAU2355. Plant architectural traits. One QTL (qtlPH-1) was detected for plant height. It was detected in F2:4 generation for water-limited environment. The nearest marker to this QTL was NAU3901. Phenotypic variance explained (R2) value was 54.1%. This was a major QTL controlling plant height. It was not detected in W1 treatment, so qtlPH-1 is related to water-stress. Discussion The narrow genetic base of cotton had been discussed in many papers. There are many reports of low polymorphism detection in cotton intraspecific crosses (Song et al. 2005; Han et al. 2006; Guo et al. 2007) and in intraspecific crosses of Upland cotton (Mei et al. 2004; Shen et al. 2005; Ulloa et al. 2005; Zhang et al. 2005). According to Iqbal et al. (2001), one hypothesis which may explain the apparent lack of diversity in cultivated Upland cotton is that one or more genetic bottlenecks may have occurred during the later stages of development of G. hirsutum latifolium, possibly as a result of rigorous selection for early maturity. Although there was low polymorphism detected in our two parents, two significant QTLs, affecting osmotic potential (qtlOP-2) and plant height (qtlPH-1) under drought conditions were identified. It suggested that the two parents had valuable polymorphism in some specific regions. It is attributed to high level of divergence of the parents since both the genotypes were selected from different programs. FH-901 is from Cotton Research Institute, Faisalabad, Punjab, Pakistan, while RH-510 was evolved at Cotton Research Station, Rahim Yar Khan, Punjab, Pakistan. Rahim Yar Khan station is working to release varieties with high drought tolerance while FH-901 evolved in region experienced more rain fall than Rahim Yar Khan. It explains that two parents might have significant differences at some specific genomic regions. So it is obvious that important QTLs were detected in spite of the low polymorphism rate between the two parents. The importance of osmotic adjustment (OA) as an effective mechanism for crop drought tolerance has received considerable recognition. In our present study, QTLs for osmotic adjustment (qtlOA-1) and seedcotton yield (qtlSC-1) shared the common marker (NAU2540). On our backbone linkage map (Han et al. 2004; Han et al. 2006; Wang et al. 2006b), Marker NAU2540 is located on Chr. 20. The higher seedcotton yield corresponded with lower osmotic potential at this locus. This finding supports the previous studies that osmotic adjustment is an important physiological mechanism involved in sustained productivity of plants under water-deficit environments (Saranga et al. 2001; Rahman et al. 2008). The association of osmotic adjustment and seedcotton yield is of importance in breeding programs and marker NAU2540 will be useful in marker-assisted selection (MAS) with the objective of improving seedcotton yield under water-limited environments. Improvement of cotton needs consideration of a large number of traits affecting yield simultaneously. Plant architecture traits, especially plant height, have positive correlation with cotton yield (Wang et al. 2006a). Tall growing cotton cultivars are relatively high yielding compared to dwarf cultivars. It is a well-established fact in cotton that tall cotton genotypes are more drought tolerant than the short statured ones. In most cotton improvement programs for drought tolerance, selection is made for taller genotypes. Seedcotton yield is determined by two constituent components, i.e. number of bolls per plant and boll weight. Under water deficit during the flowering stage, seedcotton yield reduction of cotton cultivars is mainly due to square and young boll shedding (Saranga et al. 2004). Although, there was no strong correlation observed between seedcotton yield and plant height under W2 in F2:4 generation, plant height was found to be strongly associated with yield component traits (number of bolls/plant and boll weight) and seedcotton yield was also strongly associated with number of bolls/plant (Table 4). In our present study, highly significant association of plant height with number of bolls/plant can be of importance in such a way that selection for plant height will help to increase number of bolls/plant and will result in higher seedcotton yield under water-deficit environment. As phenotypic variance explained (R2) value associated with qtlPH-1 is quite high, so it is evident that it is a major quantitative locus controlling plant height under stress conditions. This QTL can be a good candidate for MAS in molecular breeding programs aimed at developing high yielding cotton cultivars both under normal and water-stress conditions simultaneously. References
The following images related to this document are available:Photo images[ej11026t4.jpg] [ej11026f7.jpg] [ej11026f4.jpg] [ej11026t3.jpg] [ej11026t2.jpg] [ej11026f5.jpg] [ej11026f3.jpg] [ej11026f2.jpg] [ej11026f1.jpg] [ej11026f6.jpg] [ej11026t1.jpg] |
| |||||||||
