 |
| About Bioline | All Journals | Testimonials | Membership | News |
|
||||||
|
||||||
African Population Studies/Etude de la Population Africaine, Vol. 17, No. 1, May 2002, pp. 1-17 The Onset of Fertility Transition in Zimbabwe: A Re-analysis of Census and Survey Data Using Robust Demographic Techniques William MUHWAVAPSI/SFH, Lusaka, Zambia Code Number: ep02001 AbstractThe present study is designed to resolve the controversy arising from fertility decline in Zimbabwe by conducting a comprehensive analysis of all the fertility data available from national censuses and surveys. This includes the first in-depth analysis of the 1994 Demographic and Health Survey data and the first combined analysis of all inquiries since 1969. As well as examining summary measures of total fertility, the study presents estimates of parity progression for each cohort interviewed in the two DHS surveys using the method proposed by Brass and Juarez to adjust for truncation bias. In addition, we check our fertility estimates against the Census enumerations by carrying out an intercensal population projection based on them. The results suggest that fertility fell slightly during the Civil War of the 1970s but may have risen briefly immediately after Independence. A sustained fertility decline then began in the mid-1980s and continued into the 1990s. We agree with the view that the two DHS surveys in Zimbabwe underestimate current fertility. This same view is corroborated by earlier enquiries. Thus, adjustment of the data leaves unaltered the conclusion that total period fertility has fallen by about a third. The total fertility rate in 1994 in Zimbabwe was about 4.7 children per woman. What is it now? RésuméCet article est une contribution au débat sur la baisse de la fécondité au Zimbabwe. Il fait une analyse globale de toutes les données disponibles à partir des recensements et enquêtes nationaux. Les données résultant d'une analyse approfondie de l'EDS et de la première analyse transversale de toutes les enquêtes menées depuis 1969 sont également prises en compte. L'étude présente une estimation de la progression de parité pour chaque groupe de personnes enquêtées au cours des deux EDS et examine aussi la synthèse des mesures concernant la fécondité totale. Pour rectifier les biais probables, la méthode proposée par Brasset Juarez a été utilisée. En outre, nous avons confronté nos estimations avec les données du recensement en effectuant une projection inter-censitaire de la population sur cette base. Les résultats ont montré que la fécondité a légèrement baissé au cours de la guerre civile des années 1970 et qu'elle a pu augmenter brièvement tout de suite après l'indépendance. Puis commença une baisse prolongée de la fécondité au milieu des années 1980 qui continua jusqu'aux années 1990. Nous sommes d'accord que les deux EDS menées au Zimbabwe ont sous-estimé la fécondité actuelle. Des enquêtes plus récentes ont corroboré ce point de vue. C'est pourquoi, même les ajustements opérés sur les données ne changent en rien la conclusion établissant que la fécondité a baissé d'un tiers au cours de cette période. Le taux global de fécondité au Zimbabwe était en 1994 de 4,7 enfants par femmes. Qu'en est-il maintenant ? Introduction Studies which have examined fertility decline in Zimbabwe have come up with contradictory conclusions. For example, Thomas and Muvandi (1994a, 1994b) suggest that data from the 1984 Zimbabwe Reproductive and Health Survey and the 1988 Zimbabwe Demographic and Health Survey (ZDHS) are not comparable since the two surveys employed different sample designs. In the 1988 ZDHS, more educated women were interviewed than in the earlier survey. Thus, the differences in the educational characteristics of the samples could have exaggerated the extent of fertility decline. This view has been contested by Blanc and Rutstein (1994) who point out that the difference in educational levels between the two surveys is not statistically significant, which is an accurate assessment of sample designs for the two surveys. On the other hand, another study of the 1988 data (Udjo, 1996) concludes that fertility decline has been modest in Zimbabwe. When this research was started it was unclear whether fertility was declining in Zimbabwe. The articles which had been produced then were unconvincing, mostly because of their methodological weaknesses or because they were relying on one or, at the most, two data sets. In particular, most of the studies which have attempted to document fertility change in Zimbabwe are based on the 1988 ZDHS (Thomas and Muvandi, 1994 Blanc and Rutstein, 1994; Mhloyi, 1991; van de Walle and Foster, 1990; Freedman and Blanc, 1992; Foote et al., 1993; Muhwava and Muvandi, 1994). While the first report of the 1994 survey supports the view that fertility has declined in Zimbabwe, more detailed analysis is needed of all the data available to ascertain the magnitude of the decline. In particular, the rates obtained from the birth histories collected in the two ZDHS for periods before the surveys should be compared with those from earlier surveys and censuses. Against this background, this research uses the wealth of demographic data available for Zimbabwe since 1969 to build a picture of the fertility patterns and trends and try to account for these changes. The study goes as far back as 1969 and comes more up-to-date than the 1988 ZDHS by including the 1992 census and 1994 ZDHS data. The study uses the birth histories available from both the 1988 and 1994 ZDHS to analyse the extent to which the changing fertility pattern in Zimbabwe reflects changes in the timing or spacing of births. It also investigates whether the fertility decline has been due to changes in the onset of reproduction, the spacing of births or the proportion of women reaching high-order parities by undertaking a detailed analysis of parity progression in the 1988 ZDHS and 1994 ZDHS. The initiation of fertility transition in Zimbabwe and other Sub-Saharan African countries, for example Kenya and Botswana, has raised the question of what factors have contributed to fertility decline in these countries. Caldwell et al. (1992) note that these three countries share three common characteristics: infant mortality levels below 80 per thousand live births, high levels of education, especially among girls, with almost all girls of primary school age attending school and 20-40 % in secondary school and high level of contraceptive use. These factors play an important role in affecting motivation to restrict family sizes. In this paper, an attempt is made to trace the history of fertility decline using robust methods which give an accurate assessment of what has been happening to fertility in Zimbabwe. Like most Sub-Saharan African countries, there is rudimentary evidence that before a sustained fall in Zimbabwe, fertility rose well beyond 7 children per woman. Before the 1988 Zimbabwe Demographic and Health Survey, no demographer had anticipated changes in fertility levels in Zimbabwe. This data set provided some evidence of fertility decline, but some experts refused to acknowledge this on the basis of unreliability of demographic data in African populations. However, the 1994 Zimbabwe Demographic and Health Survey confirmed that changes were occurring in fertility levels. These changes have brought about new interests in African demography especially the reasons for such a transition. However, this paper will focus on when the transition could have started and the pace of change. ObjectivesTo investigate fertility trends in Zimbabwe using all the data available (1969, 1982 and 1992 Censuses, 1984 Zimbabwe Reproductive and Health Survey, 1987 Intercensal Demographic Survey and the 1988/89 and 1994 ZDHS). To investigate whether the fertility transition observed in Zimbabwe is a result of changes in the onset of reproduction and of spacing and/or stopping patterns using birth history data from the 1988 and 1994 ZDHS and ascertain the pattern of changes in parity progression. Quality of Fertility Data on ZimbabweThe data to be used are from the 1969 Census, 1982 Census, 1984 Zimbabwe Reproductive and Health Survey (ZRHS), 1987 Intercensal Demographic Survey (ICDS), 1988 Zimbabwe Demographic and Health Survey (ZDHS), 1992 Census and 1994 ZDHS. Reported current fertility estimates are presented in Table 1. The total fertility rates give the impression of a fluctuating trend in fertility during the period since 1969. For example, when the TFR of 5.6 for the 1982 census is compared with the ZRHS figure of 6.5, one obtains the impression that fertility rose dramatically during the mid-1980s. Nevertheless, this 1984 estimate is the only one which contradicts the impression of an overall trend towards lower fertility during the period under consideration. The 1984 estimate might reflect a genuine phenomenon or might be an artifact in the data. In particular, while there could have been a post-war baby boom in the early 1980s, other explanations exist as to why the 1984 estimate might be out of line. First, the 1984 survey has a small sample size (2574 women) and the estimate is likely to be affected by sampling error. Second, it might be that all the other surveys and censuses have consistently underestimated fertility. The CSO (1992) noted 'the possibility of underestimating the total fertility rate using data from the 1982 and the subsequent surveys cannot be ignored'.
All censuses and surveys which are being used for this study have included questions which allow the estimation of lifetime fertility. Establishing the trend in lifetime fertility in Zimbabwe is difficult as can be seen from Table 2.
The average parities (Pi) from the 1982 Census are lower than those from the 1969 census for all age groups. However, this trend reverses between 1982 and 1984 as the mean parities for 1984 are consistently higher than those for 1982 in all age groups. The censuses and surveys from 1984 onward show a consistent fall in the parities of all age groups except 15-19 years where there is no clear trend.
Fertility Trends The P/F ratio method is a procedure for comparing the cumulated fertility of cohorts up to the current age (P) with the corresponding measure, calculated from the period rates for synthetic cohorts (F). The Brass P/F ratio method assumes that the reported age-specific fertility rates are approximately accurate in age structure though not necessarily in the overall level. Secondly, it assumes the average parities reported for younger women are correct and thirdly, that the fertility patterns have remained constant over time. The P/F ratios for the different censuses and surveys for Zimbabwe are presented in Table 3.
The P/F ratio method can be used to detect fertility trends by examining the behaviour of P/F ratios for older and younger women. If fertility has remained constant over time and there are no reporting errors, then ratios of the mean parities (Pi), and the synthetic mean parities (Fi) would be 1.0 for all age groups. In situations where fertility is changing, lifetime fertility will be different from the level implied by the cumulated age specific fertility rates. In all the surveys and censuses the P/F ratios are consistently above one except for the age group 15-19 in 1982, 1988, 1994 and the 20-24 year age group in 1994 (see Table 3). However, they are particularly high in the 1987, 1988, 1994 surveys and 1992 census for age groups expected to have least reporting errors. This pattern seems to suggest declining fertility as current fertility is persistently lower than lifetime fertility. However, P/F ratios greater than one could also result from the systematic underreporting of births in the reference period, that is the 12 months before the interview date. The magnitude of the P/F ratios in Table 3.6 seems to suggests that both phenomena are present in the data, that is declining fertility and underreporting of current fertility. There is strong evidence of under-reporting of lifetime fertility omission of births in the 1969 census, where the P/F ratios drop with age. The pattern of increasing P/F ratios with age observed in the 1984 and subsequent inquiries represents strong evidence of fertility decline. Adjusted total fertility rates obtained by applying the P/F ratio method to the different censuses and surveys in Zimbabwe are presented in Table 4. Estimated total fertility rates based on four age group combinations are shown. The fertility levels obtained using P2/F2 deviate substantially from the other estimates indicating that this adjustment factor is vulnerable to reporting errors. According to Venkatacharya (1989), 'in an analysis of current fertility level in a number of Sub-Saharan English-speaking African countries around 1980, it was found that the P2/F2 values were high for many countries and it is only the ratios 25-29 and 30-34 that came close to some reasonable levels'. In this respect, the average of these two age groups is taken as most reliable.
The adjusted estimates show total fertility falling from a high level of above 8 in 1969 to 5.1 in 1994. This represents a fall in fertility of about 39 % from 1969 to 1994. However, adjustment of the data in this way yields over-estimates of total fertility if fertility is in decline. Further analysis of the data is required using more robust demographic techniques to separate errors from actual fertility change. In Tables 5 and 6, age cohort -period fertility rates and P/F ratios are presented. An examination of Panel A in Table 5 suggests that there was a modest decline in fertility largely concentrated in the previous 5 years. Comparing the periods 0-4 and 5-9 years before the survey, the largest decline is noted in the age group 15-19, where the fertility rate has fallen by about 36 %. All the other age groups show substantial declines in the same reference period ranging from 10 % for age group 40-44 to 20 % for age group 20-24. Fertility rates fell by about 37 % from the period 25-29 to 0-4 years before the survey for the age group 15-19. In Panel B, there is an indication that there are serious omissions of births by the cohort aged 45-49 years. Fertility decline is further confirmed in Panel C where cumulative fertility by age group has shown changes. For example, cumulative fertility for the age group 30-34 fell from 4.5 for the period 10-14 years before the survey to 3.7 in the period 0-4 years before the survey. In Panel D, the P/F ratios provide supporting evidence of fertility decline in the most recent period (0-4) where the P/F ratios are consistently above one and increase with age. For earlier periods, the P/F ratios are near unity or deviate from one with no clear pattern.
Table 6 based on the 1994 ZDHS, provides further evidence of an ongoing decline in fertility. The fertility rates in Panel A show a declining trend during the 10-year period before the survey. Cumulative fertility for each age group in Panel C shows significant changes. For example, cumulative fertility for the age group 30-34 fell from 4.6 for the 10-14 year period to 3.0 in the period 0-4 years before the survey. The P/F ratios for the two most recent periods before the survey are consistently above one and show an increasing trend over the age groups, which is indicative of fertility decline.
Trends in Family Formation In this section, a step further is taken to distinguish the impact of family limitation from temporary changes related to ages at first marriage and length of the birth interval using parity progression ratios. The results are presented in Table 7 for the DHS using the truncation approach proposed by Juarez and Brass (1983) using life table estimates of parity progression. Here, b60s are used and these are probabilities of having the next birth within 60 months.
There is a close agreement between the adjusted B60s for equivalent cohorts between the two surveys at lower parities: 1/2; 2/3; 3/4 and 4/5. At higher-order parities the measures are inconsistent, but both surveys show a declining trend. The pattern of inconsistencies suggest that women exaggerate the intervals between all but their most recent births. This gives a misleading impression of lower B60s in the truncated data than untruncated data for progression ratios which are currently being completed. Thus, the most recent adjusted B60s are biased upward. There is no clear trend in progression from eighth to ninth births and this might be a result of small sample size, which causes large sampling errors or because at such high parities the women observed have been highly selected, that is they are faster movers with natural fertility. The adjusted B60s presented in Table 7 can be used further to analyse trends by time period and cohort as this provides a clear indication of whether the changes occurring are cohort linked or period linked. To effectively show the trends, the B60 at each time period or cohort is measured according to change from an initial base. Here, the initial base is chosen as the B60 for women aged 45-49 at the time of the survey, as these are the oldest women included in the survey. The trends by cohort are provided in Table 8 and these show the parity progression of each age group relative to 1000 for women aged 45-49 years.
The Table does not show that the reduction in fertility started with a particular cohort at all parities. Instead, the reduction in fertility began at lower parities among younger cohorts. The parity progression ratios show a declining trend from the oldest to the youngest cohorts for all birth orders except 1/2 where the trend is rather erratic in 1988. The declines are occurring at all birth orders except the transition from the 6th to the 7th birth, where no clear trend exists in the first survey. The parity progression ratios are substantially lower for the 1994 ZDHS compared with the 1988 ZDHS at most birth orders. An examination of the trends by period is presented in Table 9. The table is constructed from Table 8 by organising the measures by diagonals of the age cohort assuming that the mean birth interval is 2.5 years, so the orders move two births back in time for each five years of the age cohort. The measures are obtained by setting 10 years before 1988 and 15 years before 1994 to 1000. The table shows that, while there are some indications of fertility decline in the 1970s, an accelerated reduction in fertility started at the same time for all parities, that is 10 years before the 1988 survey and 15 years before the 1994 survey. In the 1988 ZDHS, a trend in the transition to the second birth and high order births is only clear for 5 years before the survey. The evidence of declines in the progression at all parities since 1982 is equally clear from the second survey. By the middle of the 1980s fertility had fallen by over 5 %. During the 15 year period proceeding 1994, progression to fourth and higher-order births fell by about 25 %.
The results from the truncation approach reveal that there has been substantial fertility reduction at low, as well as middle and higher-order parities, in Zimbabwe. Fertility decline started slowly in the 1970s and accelerated in the early 1980s. The downward trend has been maintained in the early 1990s. Parity progression ratios can be computed also from data from censuses or surveys which do not include maternity histories but has information on current and lifetime fertility classified by birth order. Brass devised a method of overcoming the problem of censored cohorts which is referred to as "P/F Synthesis and Parity Progression Ratios". The method is based on projecting the future fertility experience of young women under the assumption that the current age- and order-specific fertility schedule remains constant. The projected parity progression ratios obtained from the 1982 census are provided in Table 10. Although the data above are for a period with uncertainties over what was happening to fertility in Zimbabwe, there are some trends which are evident from Table 10. The PPRs for all birth orders show a declining trend across cohorts. Also, by examining the PPRs for each cohort, women tend to limit their family sizes at 5/6.
Completed Family Sizes The first method used is to examine progression among women who have, or
have almost completed their childbearing. Parity Progression Ratios (PPR: the
proportion of women going from an nth to an n+1 birth)
are a sensitive measure of fertility but very robust to data errors such as
the misdating of births or confusion between childlessness and failure to report.
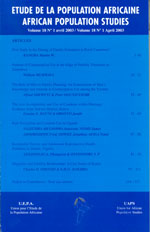
However, before presenting the PPRs, it is important to evaluate the data. An
examination of women by proportion in parity n and over shows the quality
of reporting of children ever born. Assuming there is no differential death
and emigration, the proportion in parity n and over can only grow with
time. So, comparing a cohort from one study to the next allows examination of
the quality of data. This is set out in Fig
1.
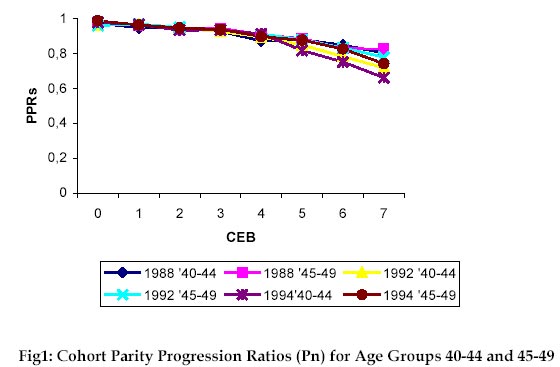
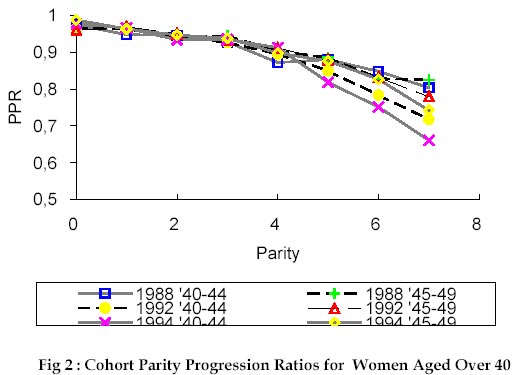
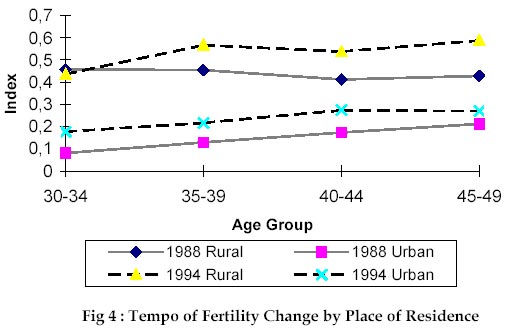
The data in Columns B, C and D and Columns E and F of Table 11 refer to approximately the same cohort at different points in time. One would expect the proportions in parity n+ in Column C to be higher than in B, and those in Column D to be higher than both B and C and those in F to be higher than E. The ratios that do not conform to these expectations are parity 1 in Column C, parities 7 and 8 in Column D and parities 6, 7 and 8 in Column F. It can be concluded that the 1992 census may have overestimated the proportion of nulliparous women, and the 1994 survey underestimated the proportion at parity 6 and over. To compute parity progression ratios from a distribution of women by children ever born, the parity distribution is cumulated up from the bottom to obtain the numbers N(I) of women with I or more children ever born, I=0,1,2....Then the parity progression ratio p(I) for the progression from ith to I+1st birth is computed as N(I+1)/N(I). These ratios are presented in Fig 2. The progression ratios are high. For example, about 90 % of the women who had a fourth birth order moved to birth order five. Progression to higher-order births tends to be lower in the cohorts aged 40-44 than those aged 45-49 but this may be due to the fact that women aged 40-44 are likely to have more births, so the transition proportion will be higher at the end of reproduction. Thus, these data fail to establish whether fertility fell among women born in the 1940s. Differential Trends in Fertility Decline An assessment of the differential transitions presented in this section gives an indication of whether all the population subgroups are participating in the fertility transition which has been observed at the national level. Here, consideration is given to administrative regions, place of residence and level of education. Considering the categories of the above variables limits the sample size, for example, there are small sample sizes for women in urban areas or with secondary or higher education. Hence, a condensed measure of the quantum of fertility change is used. The measure is based on progression from the first birth to the sixth birth and is obtained by multiplying together the ratios to the second, third, fourth, fifth and sixth births. The results are presented in Figs 3 to 4. Change by Place of Residence The results show that the quantum of fertility change has not been uniform across population subgroups. Urban women show a consistent decline over the cohorts for bot74 surveys. In rural areas, marked declines are evident among young women in the 1994 survey. Regional differentials are also apparent. Urban provinces have been experiencing declines in both surveys. There is an indication that fertility decline started in urban provinces and later spread to the south-east and Mashonaland regions. There are no clear signs of declines occurring in Matebeleland. Discussion and Conclusion The results show that fertility, as measured by the total fertility rate has been declining in Zimbabwe. Despite the evidence that has been presented of underestimation of fertility in all the censuses and surveys, once these are corrected a clear picture of the trend in fertility still emerges. Total fertility probably declined from approaching 7 to nearer 6 in the 1970s, perhaps due largely to spousal separation and women postponing births during the war period. In the early 1980s, there was probably an increase in fertility as a result of the post-war baby boom. However, a strong family planning programme was introduced in the early 1980s and this had strong impact on the quantum of fertility. It has reduced achieved parities and led to a sustained fall in period fertility. The analysis based on parity progression ratios and trimeans, which have been used to show the speed and rate of fertility change in Zimbabwe. There is evidence that modest changes have been occurring at the onset of childbearing, especially increases in the age at first birth. However, most of the declines are occurring to parity progression ratios among inter-live births. The parity progression ratios show that there has been a slow decline in fertility that occurred in the 1970s, and there was an acceleration in the 1980s, and this momentum has been maintained in the 1990s. These changes in parity progression ratios have been coupled with increases in the length of the birth intervals. The modest declines in the 1970s can be attributed to the postponement of childbearing during the war which ended in 1980. However, the declines after 1980 are linked to the limitation of family sizes. The parity progression ratios calculated by pairwise comparison of truncated and untruncated cohorts show sharp changes in the progression from parity 5 to 6 for women aged 30-44, and parity 4 to 5 for younger women suggesting a tendency towards limiting at these birth orders. For women who are aged 45-49, sharp declines are observed at parity 7. This pattern indicated that completed family sizes are smaller for younger cohorts. The patterns of fertility decline which has been presented for Zimbabwe here is similar to that observed by Brass and Jolly (1993) for Kenya, where reductions in fertility are spread over all birth orders. Brass and Jolly (1993) also note that these patterns have been experienced elsewhere in Sub-Saharan Africa, especially Botswana and Nigeria. This pattern seems to be unique to Sub-Saharan Africa as it is different from that in Asia and Latin America where the declines started at the middle birth orders and spread successively to high-orders and then low order births. References
Copyright 2002 - Union for African Population Studies The following images related to this document are available:Photo images[ep02001f3.jpg] [ep02001f4.jpg] [ep02001f2.jpg] [ep02001f1.jpg] | |||||||||||||||||||||||||||||||||||||||||||||||||||||||||||||||||||||||||||||||||||||||||||||||||||||||||||||||||||||||||||||||||||||||||||||||||||||||||||||||||||||||||||||||||||||||||||||||||||||||||||||||||||||||||||||||||||||||||||||||||||||||||||||||||||||||||||||||||||||||||||||||||||||||||||||||||||||||||||||||||||||||||||||||||||||||||||||||||||||||||||||||||||||||||||||||||||||||||||||||||||||||||||||||||||||||||||||||||||||||||||||||||||||||||||||||||||||||||||||||||||||||||||||||||||||||||||||||||||||||||||||||||||||||||||||||||||||||||||||||||||||||||||||||||||||||||||||||||||||||||||||||||||||||||||||||||||||||||||||||||||||||||||||||||||||||||||||||||||||||||||||||||||||||||||||||||||||||||||||||||||||||||||||||||||||||||||||||||||||||||||||||||||||||||||||||||||||||||||||||||||||||||||||||||||||||||||||||||||||||||||||||||||||||||||||||||||||||||||||||||||||||||||||||||||||||||||||||||||||||||||||||||||||||||||||||||||||||||||||||||||||||||||||||||||||||||||||||||||||||
| |||||||||