 |
| About Bioline | All Journals | Testimonials | Membership | News |
|
||||||
|
||||||
African Population Studies/Etude de la Population Africaine, Vol. 19, No. 2, Sup. B, 2004, pp115-138 Disability in South Africa Heston Phillips and Amadou Noumbissi Statistics South Africa, South
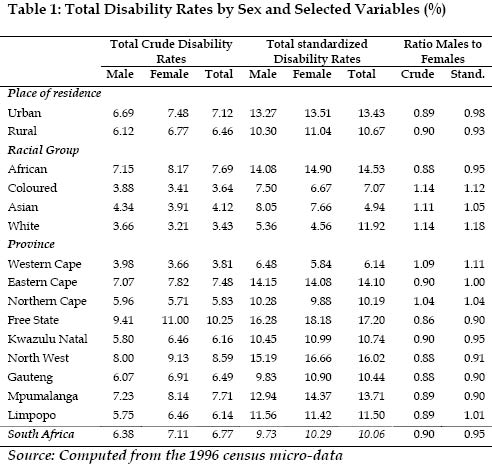
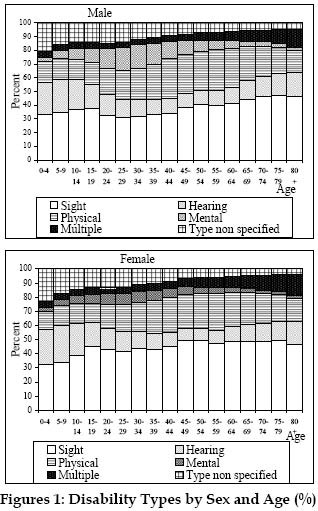
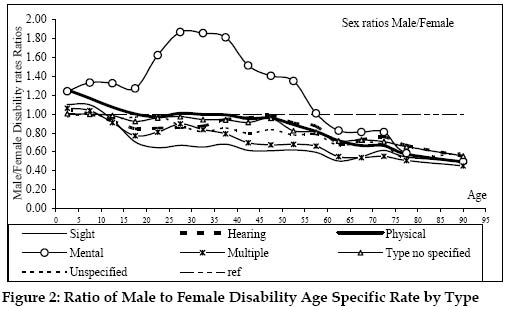
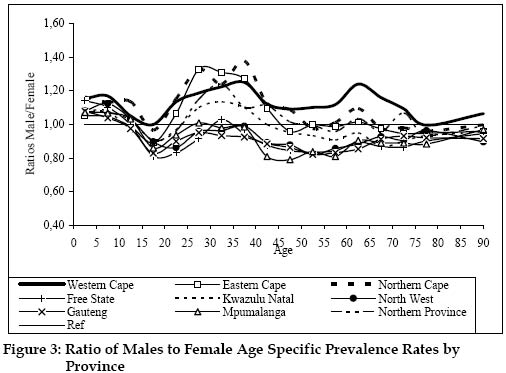
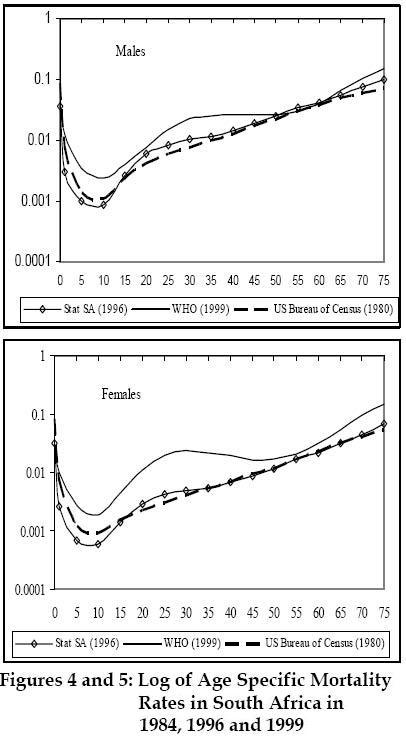
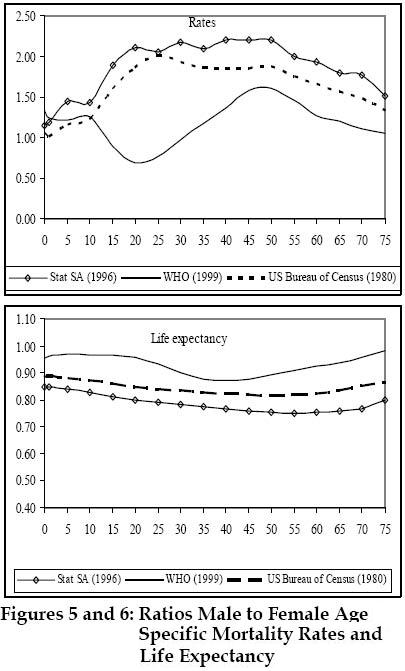
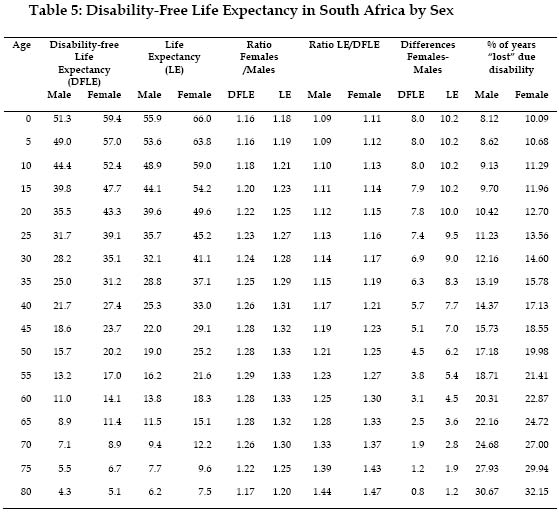
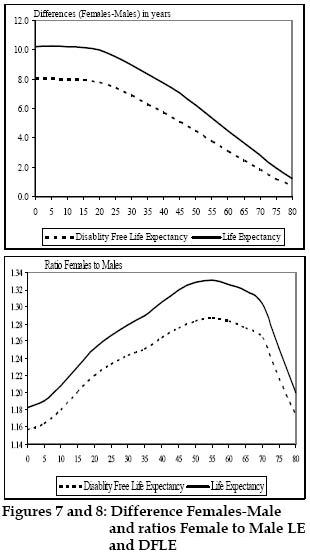
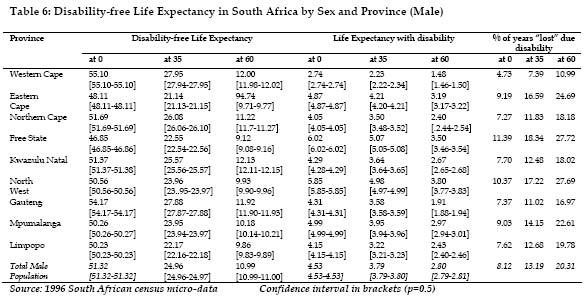
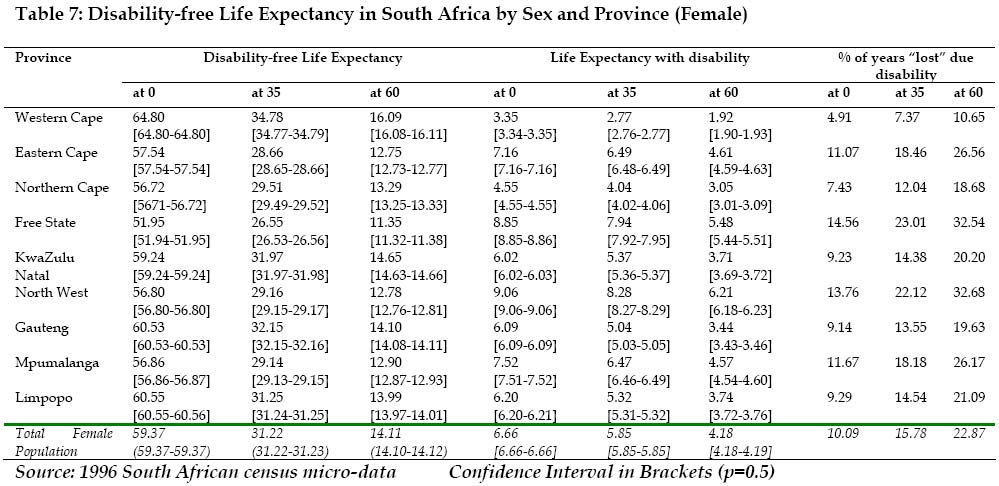
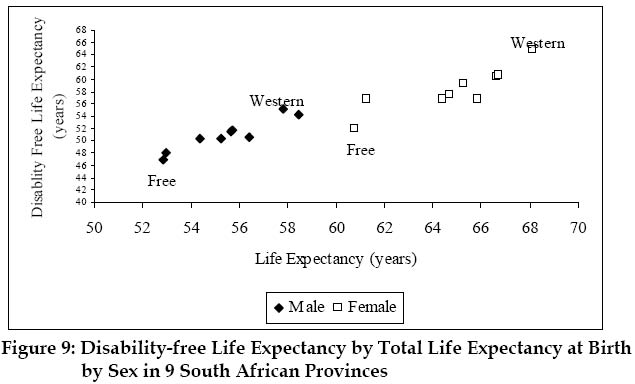
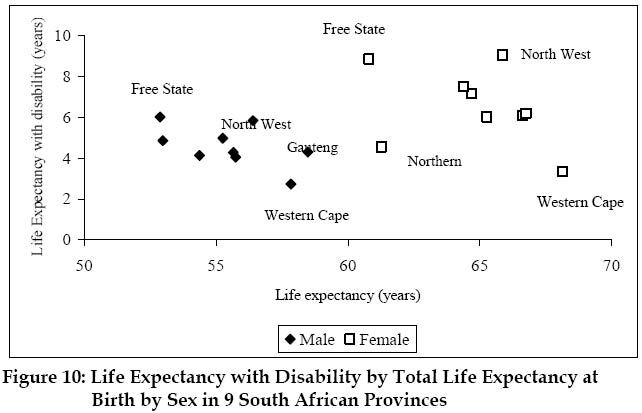
Africa Code Number: ep04038 ABSTRACT Very little research has been done on the demography of the disabled in Africa although many African censuses contain information on disability. This information can be used to characterize this phenomenon in Africa and compute useful indicators such as Disability Free Life Expectancy used in the evaluation of health especially at old ages. This paper focuses on the prevalence and the patterns in South Africa using the 1996 South Africa census micro data. We then examine the spatial variations in the disability-free life expectancy. Women seem to have higher disability rates than men at adolescent ages and at the oldest ages. At the youngest ages and for adults aged, men seem to report higher disability rates than women. Results also show that women live longer, have higher health expectancies and spend a greater part of their life in poor health than men. Wealthiest and more urbanized provinces such as Western Cape and Gauteng have higher life expectancy and higher disability-free life expectancy. Poorest provinces such as Free State and North West have the lowest life expectancy and higher life expectancy with disability. INTRODUCTION Disability reduces the ability of individuals to be integrated into the society by reducing their ability to participate actively in social and economic life. About ten % of the world population is disabled (UNDP, 1993). These persons may have experienced trauma, injury or diseases that have permanently or temporarily affected their physical or mental capacities (Noumbissi, 2003). This may have occurred during the daily life as the result of an accident, contamination, disease or injury in social conflicts such as wars. Degenerative diseases due the aging may also lead to disability. According to the new International Classification of Functioning, Disability and Health (ICF), disability is part to the general framework of health. The new classification includes all chronic diseases such as asthma or HIV/AIDS when they prevent people from actively participating in normal everyday activities (WHO, 2001). We used perceived or reported disability-respondents were asked to indicate whether or not there were any people with serious visual, hearing, physical or mental disabilities in the household (Statistics South Africa, 2000). Disability reduces the ability of a person to actively participate into society. In absence of a clear policy, the disabled tend to face various limitations and exclusions from social life. In some countries, especially in the developing world, they have limited access to education and employment. Research shows that disability is associated with poverty (Cambois et al., 2001; Crimmins et al., 1996; Guralnik et al., 1993). Especially in Africa, much disabled people are reduced to begging in the streets in order to survive. They frequently do not have access to institutions for care. Very little research has been done on the demography of the disabled in Africa. Few exceptions such as Surveys the Needs of Persons with Disabilities realized in the Upper East region of Ghana by the Navrongo Health Research Centre (NHRC, 1999) are rare. Studies conducted in developed world refer to disability in order to estimate a series of health indicators summarizing the expected number of years to be lived in "full health" (Mathers et al. 2001; WHO, 2001). Health expectancy indicators such as disability-free life expectancy (DFLE), and healthy life expectancy or disability-adjusted life expectancy (DALE) are used to study the well-being of the elderly (Mathers et al., 2001; Cambois et al., 2001; Cambois et al., 1999; Cambois, 1996; Sullivan, 1971). An analysis of disability is important because insights from this study can increase the awareness of the extent of the problem in Africa; also information obtained would help generate health indicators necessary to evaluate the progress toward universal health and rehabilitation; finally, such analysis could contribute to global efforts to prevent disability, help rehabilitate the disabled persons, and ensure their full participation in social and productive life (Noumbissi, 2003; United Nations, 1982). Using the 1996 South Africa census micro-data, this paper focuses on the disability prevalence and patterns in South Africa. We also examine the spatial variations in the Disability-Free Life Expectancy (DFLE). DATA AND METHODS Many African censuses contain question on disability which, along with information on individuals and household characteristics, can help advance our understanding of the incidence, prevalence, patterns, and correlates of this phenomenon. Because disability is a rare phenomenon, census data are appropriate for estimation of parameters at local levels with fewer concerns on sample size limitations. This paper uses the 1996 South Africa census micro-data currently archived by the African Census Analysis Project (ACAP) of the University of Pennsylvania. This data provide an opportunity to estimate the disability prevalence rates by various variables. Respondents were asked to indicate whether there was any person with serious visual, hearing, physical or mental disabilities in the household (Statistics South Africa, 2000). Because a person may have more than one disability, the type of disability was classified as follow: sight, hearing, physical, mental disability and multiple. This self-reported disability status may reflect cultural differences in reporting of disability across socioeconomic groups within the society (Mathers et al., 2001). Also the severity of the disability was not clearly defined, rather the interviewers were instructed to consider as “a serious disability one which prevents the person from performing normal activities of daily living, for example, getting in or out of bed, dressing, washing or even working, without assistance or equipment” (Stat South Africa, 2000). Persons residing in institutions and the homeless were not asked this question. The exclusion of these persons from our analysis will not bias the results in a substantial way because only 2470 homeless out of 9 059 571 households were surveyed (Statistics South Africa, 1998). Persons residing in institution constitute less than 3 % of the population and consist mostly of White and Colored children probably in boarding schools and elderly Whites living in homes for the aged (sees Figure A.1 in Appendix). Most of the elderly living in institutions are probably disabled, thus the disability rates may be underestimated especially for the white and colored population. We also dropped individuals for whom information on the disability status was unknown. Among those who stated their disability status, ten % did not specify the type of the disability. Given the high levels of unknown disability type, we have kept them in a special “unknown” category for all the analysis. We estimate the Disability-free Life Expectancy (DFLE) by combining the prevalence rates observed and mortality rates. This method is known as Sullivan method’s or observed prevalence-based life table (Sullivan, 1971; Cambois, 2001). This method combines the observed disability prevalence with the life tables of each sub-population and distributes the number of persons years lived within each age group across status according to the age-specific prevalence rates (Sullivan, 1971; Cambois, 2001). Disability-Free Life Expectancies measures the burden of disability in a sub-population. The South Africa life tables by sex and province are based on the estimates by Statistics South Africa (1996) and Dorrington et al. (2001) combining both census data and deaths from the civil registration system. All the computations are based on period life table models and all the rates refer to the survival experience of a synthetic population. Unfortunately, life tables by racial group are not available because registered deaths are no longer available by population group since the repeal of the Population Registration Act of 1991 (Statistics South Africa, 2000). RESULTS More than 6.7 % of the population (6.4 for men and 7.1 for women) has been reported as disabled, whatever the type of disability (Table 1). As shown in table 1, the total crude disability rates are higher in urban than in rural areas; Africans are about 2 times more affected by disability than any other racial group and Whites population have the lowest rate; Free State followed by North West, Mpumalamga and Eastern Cape have the higher prevalence rates while Western Cape is the province with the lowest rate. This classification is not affected by the differences in the age structure among racial groups and among provinces. Source: Computed from the 1996 census micro-data Table 1 suggests that when male disability rates (crude or standardized) are high, female disability rates are also high. Female disability rates appear higher than male disability except for Coloured, Asian and White population who have excess male disability. In Western Cape and Northern Cape female disability rates seem lower than men disability rates. Most of this gender gap observed by racial group and province of residence is not due to the differences in the age structure among racial groups and provinces except for Eastern and Limpopo Provinces where the gender difference is partially due the difference in the age structure. Patterns by Types of Disability Sight impairment seems to be the most important type of disability reported by both male and female (Figures 1). The sight impairment seems to increase by age and in average, it accounts for 37 % for male and 45 % for female (Figures 1). Physical impairment is the second type of disability (22 % for male and 20 % for female) and hearing impairment the third (15 and 20 % for men and women respectively). At youngest ages (under 10) the male children have, for all types of disability higher rates than female and after age 10. At older ages (after 60) women have higher disability rates than men and the women disadvantages even increase with age so that, at oldest ages, all types of disability clearly affect about 1.7 times more women than men (See Figure 2). Compared to other disabilities type, mental impairment shows an atypical pattern. Between 0 and about 60, men are more affected by mental disability than female. The gender gap is even wider between 20 and 60, with a maximum around 35 where male rates are almost two times higher than female. Sight impairments followed by physical impairments appears as leading type of disability among Africans and Asian populations. Among Whites hearing impairment appears as the second cause of disability after sight impairment and before physical impairment. For the colored population physical impairments seems to be the first type of disability among men. The fact that white population has the highest proportions of non specified type of disability (Table 2) is surprising and need further explanation. Sight impairment followed by physical impairment is the most important type of disability for all provinces except Western Cape which seems to have a different pattern, especially for men. In this province, physical impairment is the highest type of disability reported among men (27 % for physical and about 24 % for sight). As already stated, the province of Western Cape has the lowest total disability rates. In provinces where disability rates are highest such as Free State and North West, sight impairment appears by far the most important type of disability: proportions of persons with sight impairment are closed to or higher than 50 %. Gauteng is one of the provinces where the sight impairments seem to be very prevalent (more than 50 % among disabled female and about 43 % among disabled male). Such racial and spatial differences may be due culture differences, differences in the access to health system facilities and/or the level of the development of each sub-population. The environment impact may also be mentioned in the explanation of the differences especially for the sight impairment. The second objective of this paper is to examine the spatial variation of the burden of disability using Disability-free Life Expectancy (DFLE). DFLE combines the prevalence rates observed and mortality rates by age. South African official life tables are available only by sex and province. As already stated, there is not any official life table by racial group for the period under study because the variable racial group is no longer collected by the civil registration. Age Specific Disability Rates by Gender and Province As expected, the proportion of reported disabled increases with age confirming the impact of degenerative diseases associated with the aging process and the cumulative effect of infection and accident. Women seem to have higher disability prevalence rates than men at adolescent ages (between 15 and 25) and at the oldest ages (Table 4). At the youngest ages (below 10) and for adults aged between 25 and 40, men have reported higher disability cases than women. While the excess female disability rates at adolescent ages is probably related to the reproductive health issues, the excess male disability rates at the adults ages is probably due violence that affect more men than women. Disability by age and by province seems to present an identical gender patterns (Figure 3). As shown in Figure 3, provinces with the lower prevalence rates present higher sex gap. All the provinces show higher male disability cases than women at the youngest ages (below 10) and higher women seem to have higher disability prevalence rates than men at the oldest ages (Figure 3). Western Cape presents specific patterns with higher male disability rates at all ages while Gauteng show higher female disability rates at all ages expect at youngest ages (below 10). The gender gap which seems to vary across province may reflect biological differences between males and females and probably gender differences in the access to health and economic resources. Mortality by Age in South Africa Using surveys, census and vital registration system data as well as data from the national population register data various life tables have been computed for South Africa (Dorrington et al., 2001; Statistics South Africa, 2000; US Bureau of Census; Lopez et al., 2000). Studies documented a steady increase in mortality in South Africa since the 1990s. Figures 4 and 5 present age-specific mortality rates estimated at three different points in time by three sources. The steady increase in mortality may due to a rise in injury related deaths among the young aged between 15 and 30 and to the recent increase in AIDS related deaths which affect mainly persons in their reproduction ages (Dorrington et al., 2001). According to the life table elaborated by WHO, recent increase in mortality rates concern more women than men. The excess male mortality at all ages is disappearing and being replaced by an excess female mortality at the adolescent and young adult ages (Figures 5 and 6). This may be due to the fact that the HIV/AIDS epidemic is worsening the reproductive health issues of young women. However, the 1999 life table produced by WHO may have overestimated the mortality levels. While the life tables proposed by Statistics South Africa (2000) are based on actual data, WHO incorporated the incidence of HIV/AIDS on the life table by using prevalence estimates from available sources and models (Lopez et al., 2000). For the estimation of disability-free life expectancy, we will use only the 1996 life tables by sex, place and province published by Statistics South Africa. Disability-Free Life Expectancy Sex Differences At all ages, the Disability-free Life Expectancy (DFLE) for women is higher than men DLFE (Table 5). The sex gap seems to be higher for life expectancy than disability-free life expectancy (Figures 7 and 8). Women lost more years of healthy life due to disability than men (at age 0, women loses about 10 % of total life expectancies while the loss for men is about 8 %. At 70, the lost is about 27 % for women and 24 % for men). Women live longer and spend more time with disability than men. This result is consistent with prior studies where women have been found to have higher life expectancies and higher healthy-life expectancies than men (Mathers et al., 2001). Women live longer than men, spend more years in good health, but also spend “a greater part of their life in poor health” (Cambois et al., 2001). To explain the male/female differences, two factors can be suggested. Men are more subject to fatal diseases while women are more subject to chronic diseases (Cambois et al., 2001; Verbrugge, 1989). Women have longer survival in poor health followed by higher prevalence of disability than men (Cambois et al., 2001; Crimmins et al., 1994). Spatial Variations Provinces with higher life expectancy seem to have higher healthy-life expectancy for both women and men (Tables 6 and 7; Figure 9). Provinces such as Western Cape, and Gauteng with higher life expectancy -life expectancy at birth is greater than 57 for men and greater than 66 women- have the higher disability-free life expectancy (greater than 54 for men and greater than 60 for women). Both life expectancy and disability-free life expectancy (DFLE) are higher for women than men in all provinces and the differences between the two sexes seem to increase as women’s life expectancy increases (LE). Also the range for men’s life expectancy is only 5.6 years while for women the range is 12.9 years. There is a linear relationship between LE and DFLE for both men and women (Figure 9). The difference between LE and DFLE or life expectancy with disability (DLE) seems to decline when LE increases (Figure 10). Considering the mortality level, DLE seems especially high for men and women in North West province, while DLE seems especially low in Northern Province or Limpopo for women and in Western Cape for the two sexes. North West and Free State are the provinces years lost due to disability for both male and female are highest (more than 10 % of total life expectancy at birth), while Western Cape has the lower years lost (less than 5% of total life expectancy at birth). With Gauteng, Western Cape is the wealthiest province of the country (Central Statistics, 1997) and has the largest proportion of urban population after Gauteng (86% of the population of Western Cape resides in urban areas). Western Cape is the only province where Africans are minority (about 18% of the population). The majority of people residing in the province are Coloured(about 57%), followed by the White population (24%). In term of education and income, Africans living in Western Cape are better off than those living in others provinces (Central Statistics, 1998a). Theses factors explain why the life expectancy and healthy-life expectancy are so high in Western Cape. On the contrary, the population of Free State as well as North West province is predominantly African living in non urban areas. Free State with Eastern Cape is the poorest provinces of the country. CONCLUSION Some health indicators necessary for the evaluation of progress toward universal health and rehabilitation are based on disability data. Even though some African census questionnaire contains information on disability, very little has been done on the demography of the disabled in Africa. This paper used information on perceived or reported disability collected in the 1996 South African census to examine the prevalence and the patterns of disability as well as the gender and regional variations in the disability-free life expectancy using Sullivan method’s (Sullivan, 1971; Cambois, 2001). The results obtained seem to reflect socioeconomic differences more than cultural differences in reporting of disability across socioeconomic groups within the society. Results show that women have reported more disability than men (6.4 % of men have been reported disabled compared to 7.1 for women). Women seem to have higher disability prevalence rates than men at adolescent ages (between 15 and 25) and at the oldest ages. At the youngest ages (below 10) and for adults aged between 25 and 40, men seem to report higher disability rates than women. This pattern is practically constant when racial groups and province are considered. The excess female disability rates at adolescent ages is probably related to sight impairment rates that are clearly higher among women age 15 and more than men (see Figure A.4 in the appendix). The excess male disability rates at youngest ages are consistent with the higher men rates for all types of disability, especially physical impairment, at this age. The excess male disability rates for physical impairments at the youngest age are probably due to accidents that may affect more boys than girls. At adult ages, the excess male disability rates may be due to hearing impairment since the difference between male and female rates for others types of disability, especially physical impairment, seems negligible at this age. Using life tables constructed by Statistics South Africa by sex and province, we then examine sex and regional variations in the Disability-Free life expectancy. With about 8 and 10 % of years lost due to disability for men and women respectively, women seem to have higher life expectancies and higher healthy-life expectancies than men. Women seem to live longer than men, spend more years in good health, but also spend a greater part of their life in poor health. Wealthiest and more urbanized provinces such as Western Cape and Gauteng with higher life expectancy also have higher disability-free life expectancy. On the other hand, the poorest provinces such as Free State and North West have the lower life expectancy and lower disability free life expectancy. In other words, poorest provinces seem to have lower life expectancy and higher life expectancy with disability while wealthiest provinces seem to have higher life expectancy and lower life expectancy with disability. These results
are consistent with previous research conducted in developing world (Cambois et
al., 2001; Mathers et al., 2001). And at least two factors have been advanced
to explain this male/female differences. Men are more subject to fatal diseases
while women are more subject to disabling diseases (Cambois et al., 2001;
Verbrugge, 1989). A longer survival in poor health followed by higher prevalence
of disability may also explained the sex differences in the health expectancy
rather than the differences in the type of diseases (Cambois et al., 2001;
Crimmins et al., 1994). Previous research has also shown that disability is
associated with poverty, education, place of residence (Cambois et al., 2001;
Crimmins et al. 1996, Guralnik et al. 1993). As noted by Cambois and colleagues
(Cambois et al., 2001), factors associated to disability are correlated with
socioeconomic resources, work conditions, behavior and habits, availability and
access to the health care system and the environment. Census data provide the
raw materials that can used to explore the subject and find weights for some
for some suggested factors. REFERENCES
APPENDICES Figure A1 Copyright 2004 - Union for African Population Studies The following images related to this document are available:Photo images[ep04038fA2.jpg] [ep04038t1.jpg] [ep04038fA1.jpg] [ep04038fA3.jpg] [ep04038t7.jpg] [ep04038t4.jpg] [ep04038f9.jpg] [ep04038f3.jpg] [ep04038f5-6.jpg] [ep04038f2.jpg] [ep04038f4-5.jpg] [ep04038t6.jpg] [ep04038t5.jpg] [ep04038t2.jpg] [ep04038f1.jpg] [ep04038f10.jpg] [ep04038fA4.jpg] [ep04038t3.jpg] [ep04038f7-8.jpg] |
| |||||||||