 |
| About Bioline | All Journals | Testimonials | Membership | News |
|
||||||
|
||||||
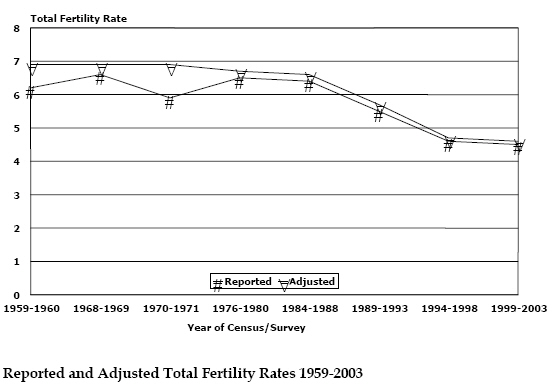
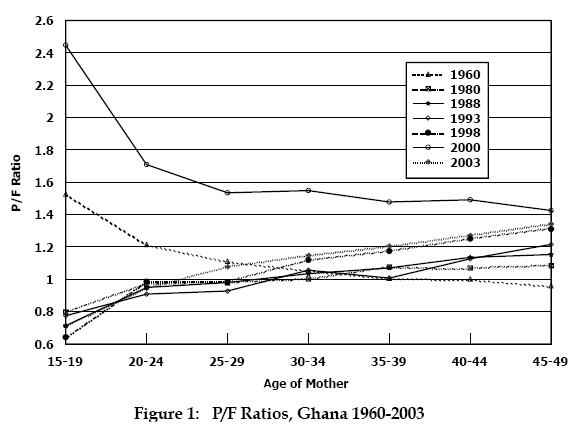
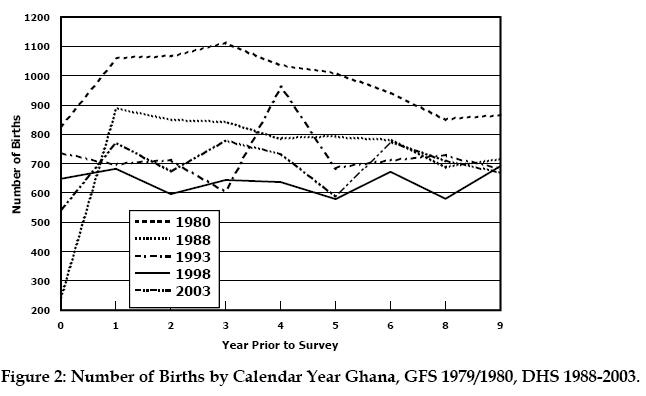
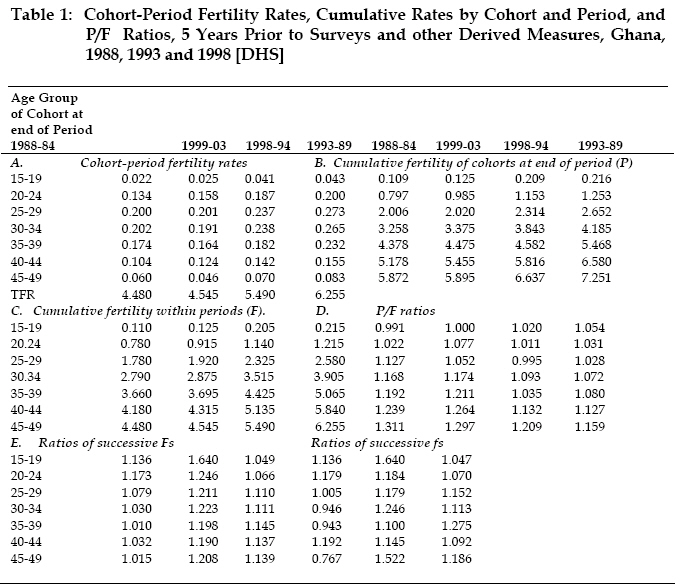
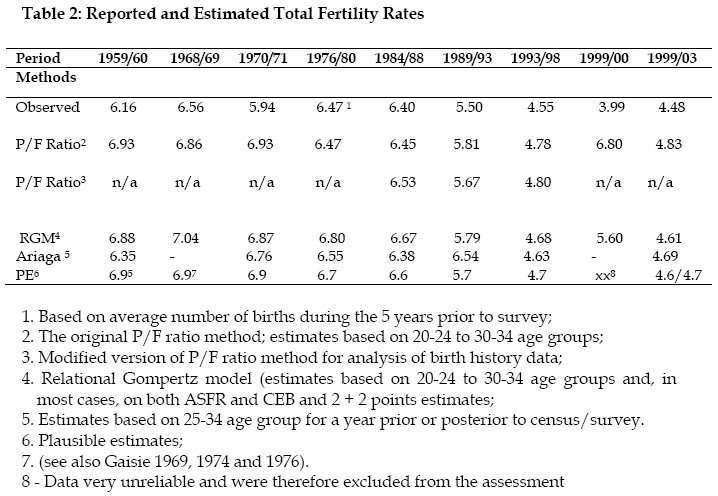
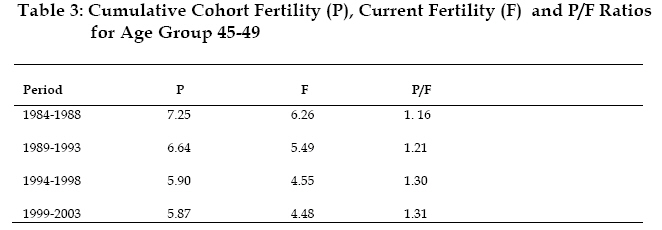
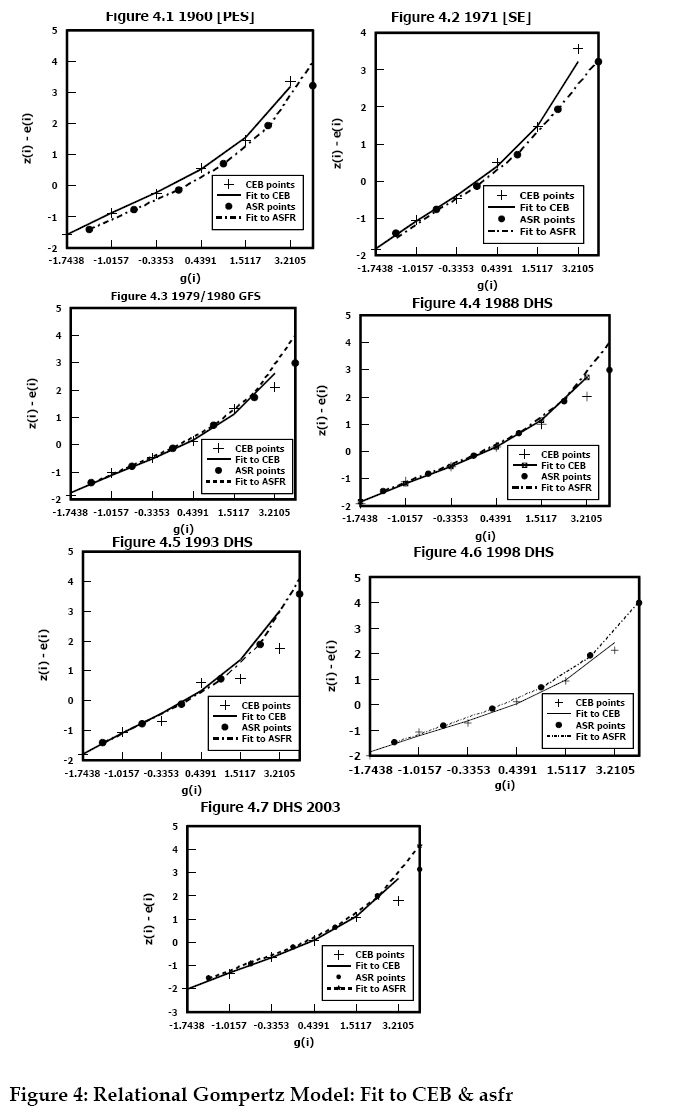
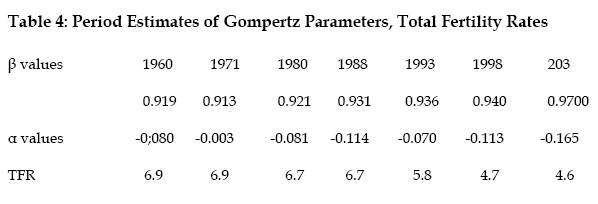
African Population Studies/Etude de la Population Africaine, Vol. 20, No. 2, 2005, pp. 1-24 Fertility Trend in Ghana Samuel Gaisie University of Botswana, Department of Demography, gaborone - botswana Code Number: ep05009 Abstract The study traces the likely route of the movement of fertility through the demographic transition. The information is critical for construction of population projections as well as for monitoring and evaluating action programmes The original P/F ratio method and modified versions, one through the intermediary of relational Gompertz model , for analysing birth history data, are employed in assessing data quality as well as in determining fertility levels and trends. The derived estimates suggest that the level of fertility in Ghana fell from about seven children per woman in the 1960s and 1970s to 4.6 children per woman by the turn of the 20th century. The pace of the decline, slowed down considerably between the late1990s and the beginning of this century when the total fertility rate dropped from 4.8 to 4.6 The changing youth population, substantial increase in the number of females aged 15-49 years, increasing aging population and the huge discrepancy between contraceptive use and the level of fertility are some of the crucial issues that call for policy options and research-based evidence for designing context specific development strategies and action programmes Introduction Sample surveys (i.e. 1960 Post-Enumeration Survey, 1968/69 Demographic Sample Survey and 1971 Supplementary Inquiry) provided the information required for determination of the level of fertility in the 1960s and 1970s. All the estimates of the total fertility rates indicated that the country’s fertility was high and stable, lying in the neighbourhood of between 6.7 and 7 children per woman. A total fertility rate of 6.9 children per woman appeared to be the most plausible estimate (Gaisie 1969, Gaisie 1974, Gaisie and deGraft Johnson 1976). The estimates were derived by P/F ratio method for estimating total fertility rate (Brass 1968). It became quite obvious during the application of the method that the reliability of the estimates depended on the accuracy of the P/F ratios, which are almost invariably subject to distortions by errors arising from age misstatements, misconception of the reference period and omission of births. The direction of adjustment therefore depends on the nature of the distortions of P/F ratios. The results of the 1979/1980 Ghana Fertility Survey (GFS) showed that total fertility rate had declined to about 6.47 children per woman. Eight years later, the 1988 Demographic and Health Survey recorded a total fertility rate of 6.43 children per woman. The corresponding figures for the three five-year periods prior to the survey (i.e. 5-9, 10-14 and 15-19 years) range between 6.97 to 7.27 children per woman. It appears therefore that fertility has been declining during the five years preceding the 1979/1980 survey and this has led to the notion that fertility decline stalled between 1980 and 1988. However, examination of the distribution of the mean number of children born by exact specified ages for birth cohorts suggests that fertility has been relatively stable, portraying inconsistency between the cumulated fertility rates and the period rates. The following are the concluding observations made in respect of the seemingly decline of fertility as reflected in the raw data: “In conclusion, data from the GFS suggest that fertility at the national level has remained more or less stable at about seven children per woman until at least the early to mid 1970s, but gives some indication of a small recent decline particularly in the last five years. A detailed evaluation of the data and further monitoring of fertility levels are however needed for more firm conclusions to be reached” (CBS/WFS 1983:54) Adjustment of the 1979/1980 figure suggests that the total fertility rate for the recent period before the survey was underreported by 3.4 per cent and that the level of fertility at that time was higher than reflected in the observed data (i.e. total fertility rate of 6.69 as compared with 6.47). The findings of the 1993, 1998 and 2003 Demographic and Health Surveys underscore significant and steady fertility decline since then; falling from 6.43 in 1988 to 5.50 in 1993, 4.55 in 1998 and then to 4.44 in 2003. Unfortunately, the P/F method cannot be employed in evaluating and adjusting the figures for this period because of the rigid assumption of constant fertility regime. Thus, it is difficult to determine the magnitude or the pace of the fertility decline without violating the most crucial assumption underpinning the method. Fortunately, the DHS provide information on birth histories of the respondents which can be utilized to estimate fertility levels and trends. The need to detect and measure trends in fertility with accuracy and sensitivity in a society that is experiencing population expansion is sine qua non. The information is critical for construction of population projections as well as for monitoring and evaluating action programmes for reducing the rate of growth via family limitation. This study therefore attempts to trace the likely route of the movement of fertility through the demographic transition Birth History Data Birth history has become an effective tool for collecting data for direct estimation of fertility levels and trends. The purpose of the birth-history questionnaire is to elicit a complete chronological record of the respondent’s fertility, in addition to responses to questions on children ever born (i.e. lifetime fertility) and children born during the twelve months prior to the survey, detailed information on the reproductive history of each female respondent in the childbearing age bracket is collected. The instrument was applied in the World Fertility Survey (WFS) in the 1980s and it is now being utilized in the ongoing Demographic and Health Surveys (DHS). This study is based on the 1988, 1993, 1998 and 2003 DHS data sets. Besides possible sampling errors, the birth history data are also subject to response errors (e.g. age misstatements, misdating of events and omissions). In fact, misplacement of events has been one of the difficulties of measurement encountered by analysts. Questions relating to the birth histories are very demanding, especially in situations where the bulk of the respondents areilliterate and live in rural environments where there are virtually no written records of vital events. How can an illiterate rural woman recollect the dates of birth of all the children she has had over a relatively long period without written records. It seems therefore that most of the number of dates of birth of the children are estimates, presumably plausible ones, that are constructed by interviewers while some of them are imputed though survey reports usually claim that a high percentage of women were able to provide the requested information. Results of a simulation exercise undertaken by Potter indicate that event misplacement can seriously bias estimates of change exhibited in period fertility derived from birth-history data. The distortions tend to overestimate a decline in fertility, or indicate a decline when it does not exist (Potter 1977:349). Thus, assessment of the major errors affecting the birth-history data is critical to the estimation of plausible fertility rates. Omission and Misplacement of Events Information on the age of the individual respondent and/or date of birth, the total number of live births each has had, and the date of birth of each child provides the materials for birth-history analysis. The major concern is the extent of the accuracy of the information and the consequences for fertility measurement. On the basis of their experience in utilizing an elaborate editing procedure, involving three separate edits on the computer in detecting and adjusting for gross errors of misreporting dates of events and ages of mothers, the Bogues believe that “by careful interviewing and editing the ages of mothers at the birth of each child can be fixed within two or three years, even in low-literate populations, and year of birth of children can be ascertained even more precisely”. Grouping the mothers into the conventional five-year intervals and combining two or more consecutive calendar years to obtain a two-year average set of rates, can reduce the errors arising from misreporting of dates of birth of the children and ages and/or dates of birth of mothers to “an acceptable low magnitude”. They also intimate that failure to report all events is inherent in the data and must be corrected by an upward adjustment, according to the presumed nature and extent of the error (Bogue and Bogue 1970:90). Correction of this bias has been a major preoccupation of most of the fertility as well as mortality studies conducted in Africa. Children who have died and children who have moved away are usually regarded as those who are more likely to be omitted. The impact of omitted births on the estimates derived from birth histories depends on how the omissions are distributed by period and cohort. For example, if women of all ages have a tendency to substantially omit very young children, the birth-history data would yield an underestimate of fertility for the most recent period. The bias would be greater, the shorter the period chosen. However, the more general observation is that the probability of an omission is positively related to the time elapsed since birth of the child (Som 1973:121-144). Omitted births are therefore more likely to predominate among births that occurred in earlier than recent periods, leading to underestimate of fertility rates for the earlier periods. On the other hand, much less attention has been given to the difficulty encountered in obtaining accurate information on dates of birth of children born alive. Brass was the only one who seriously examined the distortions of cohort-period fertility rates by misplacement of births as a result of misdating of events. Brass work demonstrates that errors in dating could substantially bias the estimation of change in fertility (Brass 1971). These errors are critically related to accurate measurement of change in fertility. Some births that should have been reported as occurring in the five years prior to the survey are shifted to the period 5-10 years before the survey and some belonging to the later period are shifted to 10-15 years before the survey. Brass concluded his assessment by stating that “ A more attractive idea is the construction of a simple function to describe timing errors, dependent on a few parameters which can be estimated from the data”. If such a technique could be “used successfully the only major disadvantage of maternity history enquiries as a means of tracing trends in fertility will be overcome. The obvious and compelling advantages can then be accorded their due weight” (Brass 1971:18). Potter constructed a simple model for describing how a woman might misplace events and micro-simulation techniques for assessing the model’s implications for measuring change in fertility. Potter observes that .” the simulations show that, contrary to conventional wisdom, birth-history data may easily lead to overestimating a decline in age-specific fertility rates or to reporting a decline when none exists” (Potter 1977:3632). He detected this bias in survey data from El Salvador and Bangladesh. He found these to be interesting discoveries and recommended, among other things, that: “In circumstances where two surveys have been made five years apart, change in fertility can be estimated by comparing results from both surveys in the most recent period covered in each. There is no need to utilize the information about earlier periods in either survey to estimate change in fertility in the ten-year period preceding the later survey. In this case the chance of bias due to misplacement is minimal.” Other Sources of Distortion As noted earlier on, age misreporting may also distort the measurement of change in fertility. The direction of distortion depends on the nature and pattern of age misstatements. Another problem is sample decay. That is, the fertility experience of the women interviewed in the sample may not have been representative, group for group, of the cohorts of whom they are the survivors. There is nothing that the analyst can do about this problem but the bias, in whatever direction, is purported to be negligible when life expectation at birth exceeds 50 years and analysis is restricted to the ten years preceding the survey (Potter 1972:341). The types of errors outlined above have provided guidelines in respect of choice of methods, types of materials used and interpretation of the results. Analytical Methods One of the most frequently used procedures for deriving age-specific fertility rates for the year preceding a census or survey is the P/F ratio method. The procedure which was originally developed by Brass and later on refined by other demographers is used to obtain estimates of current fertility by combining data on numbers of children ever born (P) and cumulative age-specific fertility (F) for the past one year. The procedure involves the use of a model age-specific curve to match the ages to which both the reported parities and cumulated fertility correspond. Furthermore, the technique is applicable under a regime of essentially constant fertility. In practice, the critical assumptions underlying the original P/F ratio method are rarely met. All the P/F ratios are affected by fertility change and are therefore poor indicators of reference period error. However, where birth history data are available, modified version of P/F ratio procedure can be used to assess the quality of data as well as to determine the fertility levels and trends. P/F ratios for different periods can be examined with the aim of determining trends and not simply levels. The procedure is also used as a diagnostic tool for assessing the quality of data from birth histories such as detection of omissions, timing errors and misplacement of events. Data on complete birth histories provide a means of avoiding the use of model fertility curve as well as being constrained by the assumption of constant fertility regime. Notwithstanding, modelling and Arriaga’s method, for example, have been employed in an attempt to reduce the impact of reporting errors as well to circumvent the assumption of constant fertility regime. Secondly, with detailed information on birth histories, there is no need any more to restrict the application of P/F procedure to one year preceding the survey. In fact, the use of longer period reduces the effect of sampling errors. Cohort-period fertility rates are derived from the birth history data. The basic fertility data are obtained by the cross-tabulation of age group of mother by period of occurrence or number of years prior to the survey. The calculation of period cumulative fertility rates (F value) involves only a summation of period-cohort rates for appropriate period and the computation of cohort cumulative fertility rates (P values) also simply involves summation of period-cohort rates for the appropriate cohort. The P/F ratios are obtained without resort to a model. The P/F ratio procedure is also modified, through intermediary of the Relational Gompertz model, for analysis of retrospective birth histories in populations where levels and patterns of fertility rates are changing rapidly (Brass 1981). The procedure estimates total fertility rate as well as age pattern of fertility by relating the observed age pattern of fertility to a standard age pattern of fertility. Gompertz function is fitted to average number of children ever born and cumulative fertility rates to derive successive P (i) and F (x) values and parameters α and β which are required to define a suitable model fertility schedule. Change in fertility is reflected by the P and F points. If the level of fertility has been rising, the P points will tend to lie on a steeper slope than the F points and if, on the other hand, fertility is falling, the slope of the P points curves downwards from the F points. Thus, the original and modified version of the P/F ratio and relational Gomperzt model are the procedures employed in this study. The data sets span a period of forty three years. Analysis of fertility trends is, however, restricted to data sets for the most recent period covered in each survey (1979/1980, 1988, 1993, 1998 and 2003 data sets). Analysis and Results Brass P/F Ratio Method The computed P/F ratios for the data sets spanning a period of more than forty years are presented in appendix A table 1. The virtually similar ratios for the age groups 20-24, 25-29 and 30-34 and decline of the ratios with advancement in age are an indication of fertility being constant during the period 1960-1980. The irregularity of the patterns depicted by some of the data sets may be attributable to omission errors and selective age misreporting of women. However, the grouping of the ages into broad age groups (i.e. five-year age groups) is deemed to have reduced the effect of the age misreporting to tolerable levels. The 1960 and 1979/80 data for older women (35-49 year-olds) are riddled by omission errors while under reporting of births seems to be a common practice among the 15-19 year-olds (figure 1). Under reporting of children ever born was very substantial among youngest age group in 1960 census. The P/F ratios for 15-19 age group are, in most cases, affected by omission and/or time scale errors. Declining trend in P/F ratios by age of women may also suggest either that fertility has been increasing or that the reported data on children ever born are distorted by progressively increasing omission of children as age of women increases. However, the estimated and, to a large extent, the reported total fertility rates for the period are not indicative of rising fertility as suggested by declining ratios. Evidence of stability of fertility during the period prior to 1980 is therefore more credible than increase in the level of fertility. It will be seen from appendix A table 1 and figure 1 that the rising trend in the P/F ratios by age of women appears to have started in the mid 1880s but the substantial increase began in the mid-990s as reflected in the 1990s data sets, particularly the 1998 data set. Evidence of significant fall of fertility is also depicted by the 2003 data set. The P/F ratios derived from the 2000 census suggest severe distortions of the census data; extensively fractured by omission errors. The 2000 census data are therefore excluded from the subsequent analysis. Birth Histories: Extension of P/F Ratio Method As pointed out above, availability of birth history data in the 1970s and 1980s led to modification of the original Brass P/F ratio procedure for the estimation of fertility levels and trends. The modified procedure is used to compute cohort-period fertility rates in an attempt to estimate fertility levels and trends for periods of two, three and five years before survey without the application of age-specific fertility models. But one encounters a number of difficulties in the application of the method. The plausibility of the estimates derived from the birth history data depends on the accuracy of the information obtained from individual respondents. If the data are defective, what are the consequences for fertility assessment? It is common knowledge that certain types of events are more likely to be omitted from birth histories than others (e.g. children who have died and children who have moved away). The Bogues observed that “failure to report all events is inherent in the data and must be corrected by an upward adjustment, according to the presumed nature and extent of errors” (Bogue 1970:9). This problem has been a major preoccupation of advocates and practitioners of retrospective data analysis. The effect of omitted events in birth history data depends on how the omissions are distributed by period and cohort. The popular notion is that the probability of omission is positively related to the time elapsed since the birth of the child (Som 1973). Thus, the omissions are more likely to lead to underestimate of the level of fertility in earlier periods. Tracing of fertility change may also be hampered by errors arising from misconception of the reference period and timing of births (misplacement of births; the tendency of cohorts to report births further or shorter in the past than they actually occurred. Patterns of misplacement of birth dates are shown in figure 2. The distortion is much more marked in the 1993 data with a huge number of births reported to have occurred in the fourth year before the survey. Shortage of births three and five years before the survey is also shown graphically in the figure. The difficulty is how to determine what proportion of the transferred births occurred in three or five years before the survey. The pattern depicted by the 1979/80 data is suggestive of preference for odd digits (i.e. 1 and 3); births appear to have been transferred from 0 to 1 and from two and four years to three years before the survey. Similar pattern of misplacement seems to have distorted the 1998 data except that there was a concerted effort to shift births from five year to sixth years prior to the survey. Computed birth ratio indicates that the number of births that occurred in the six years before the 1998 survey was over-reported by 16 per cent. Misplacement of births seems to have been more marked in earlier periods (i.e. ten years before the survey). For surveys conducted early in the year as in the case of 1988 survey (13th February to 5th June) and to some extent in the 1979/1980 survey (February 1979 to February- March 1980), majority of the children are four years old and their age is likely to be changed to five; leading to under estimate of fertility in the preceding five-year period (Arnold 1990). These types of birth misplacement patterns tend to distort the cohort-period specific fertility rates and, in consequence, the accurate measurement of change in fertility. Another problem of measurement arises from misreporting of age and/or date of birth of the respondent. If adjacent cohorts are subject to differential age reporting, change in fertility may be under reported or over reported, depending on the direction of net reporting errors. As noted earlier on, sample decay is also likely to affect the reliability of the fertility estimates (see page 4). Most of these issues have been taken into consideration in constructing strategies for measuring the fertility levels and trends. Firstly, it is presumed that classification of the respondents into broad age groups (i.e. five-year age group) would substantially reduce the impact of age misstatements on the fertility rates to tolerable levels. Secondly, as already pointed out, birth misplacement introduces bias into estimates of fertility change. Birth history data may easily lead to overestimation of decline in age-specific fertility rates or to report of a decline when it does not exist. Analysis of fertility for longer periods ( e.g. five yearly periods) rather than one year, is expected to reduce the effects of birth misplacement errors to acceptably low levels. Another strategy adopted in this study is to restrict analysis to comparing estimates for the most recent period covered in each of the surveys conducted five years apart (i.e. 0-4 years period in the 1988, 1993 and 1998 surveys). Thus, the information about the earlier periods in the surveys is not utilized to estimate change in fertility in the ten-year period preceding the survey. In this regard, the probability of distortion of measurements due to misplacement is minimal. Cohort-Period Rates by Age Cohort-period fertility rates derived from the 1998 data set are presented in appendix B table 1. The rates are indexed backward in time to 30-34 years before the survey. The values of F (period cumulative fertility) are computed by summing the cohort-period rates for periods prior to survey. The corresponding values of P (number of children ever born at survey) are cumulative fertilities for cohort in the same period. The computed cohort-period rates are presented according to the age of the cohort at the end of each time period in order to make comparison of the rates at the same age much easier. If fertility has remained constant in the time range of the reproductive reports, the P values would agree with the F values and the P/F ratios would be equal to one. On assumption that P is correct for the younger women (i.e. 20-24 to 30-34 years) and F is accurate except for a possible time scale error, the total cumulated F up to the end of the reproduction multiplied by P/F at the younger ages yields an adjusted fertility measures. The analysis is, however, restricted to the most recent period covered in each survey and the results are shown in table 1. The P/F ratios for the younger women in the broad age groups (i.e. 20-29 or 20-34 years) are employed as correction factors. The estimated total fertility rates are presented in table 2. The fertility rates shown in table 1 panel A, indicate a steady decline of fertility since the late 1980s. The decline was spectacular during the second half of the 1990s. For instance, the rates for the 20-24, 25-29 and 30-34 age groups dropped by 6, 13 and 10 per cent respectively during the second half of the 1980s as compared with 16, 15 and 20 per cent in the late 1990s. The magnitude of the decline among the 15-19 and 45-49 age groups should not be taken at its face value because the information for these age groups is comparatively much more distorted by errors. Period changes in fertility can also be seen in panel C. The decline was substantial among the women aged 30 years and above. For instance, cumulative fertility fell by between one child and 1.8 children among these women as compared with 0.7 children among the 20-25 year-olds in the period 1984 to 1998. Comparison of cumulative period and cohort-period fertility rates for successive periods (panel E) depicts similar patterns of fertility change as well as the magnitude of change among the various cohorts. Again, the figure for the 15-19 group should be interpreted with care. (Table 1) A complete birth history data make it possible to compare past and current fertility in order to obtain indicators of overall change in fertility. Comparison of the cumulative cohort fertility (P) for the oldest cohort with the cumulative period fertility in most recent period provides an indication of the extent of fertility change over the entire range of experience covered by the survey. The values for the age group 45-49 years are presented in table 2. The values of P and F for the 45-49 years age group indicate a decline in fertility; the completed fertility rates for the oldest cohort in the most recent period covered by the surveys are higher than the recent total fertility and the P/F ratios suggest that the decline was dramatic during second half of the 1990s as indicated by the various segments of the data noted above. Relational Gompertz Procedure As stated earlier (see page 5), the procedure estimates total fertility rate as well as age pattern of fertility by relating the observed age pattern of fertility to a standard age pattern of fertility. Gompertz function is fitted to average number of children ever born and cumulative fertility rates to derive successive P (i) and F (x) values and parameters α and β which are required to define a suitable model fertility schedule; α is interpreted as determining the age location of the fertility schedule or the age by which half of the total childbearing has occurred (UN 1983) and β is taken as determining the spread or degree of concentration of the fertility schedule. The estimated fertility levels and patterns are shown in figure 4 and table respectively. If the level of fertility has been rising, the P points will tend to lie on a line with a steeper slope than the F points. On the other hand, if fertility has been declining, the slope of the P points will be gentler than that depicted by the F points. The P points in figure 4.1 curve upward, suggesting that fertility has been rising. The rising series, however, is more likely to reflect systematic underreporting of current births rather than increase in the level of fertility in the 1950s. A virtually similar pattern is depicted by the 1971 Supplementary Enquiry (SE) data except that the reporting of current births appear to have been much more accurate among the younger women (aged 20-39 years) than the older women (figure 4.2). The curves do not suggest any change in fertility in late 1960s and early 1970s. In figure 4.3, except probably underreporting of children ever born among the 30-34 and 40-49 year-olds, the P and F points tend to converge on a straight line. Thus, there is no evidence in the 1979/1980 fertility data of a significant decline in fertility. The fitted Gompertz function is indicative of widespread underreporting of births and children ever born, particularly among the older women. In figure 4.4, the P and F points converge at the younger ages but diverge at the older ages (35 years and over). For the first time the P points lie on the right of the F points, indicating that by mid 1980s the incipient decline in fertility had started. In figure 4.5, despite the erratic pattern of the P points below age 35 years (probably due to age misstatement and/or birth misplacement), the points lie on a line gentler than that of the F points; signifying that the decline had began to gather momentum during the first half of the 1990s and it will be seen from figures 4.6 and 4.7 that the tempo gathered momentum right up the end of the last century. Underreporting of births and/or children ever born is also depicted by the fitted curves in figures 4.4 – 4.7. (Table 4) Reported and Estimated Fertility Levels The fertility levels derived with relational Gompertz procedure are presented in table 3. They tend to fall within the range obtained with other procedures. The estimates constructed with the original P/F method for 1984/1988 should be interpreted with great caution because fertility had began to fall during that period and the assumption of constant fertility regime underlying the estimation procedure is therefore violated. Nevertheless, if fertility had not undergone a significant transformation for between ten and fifteen years, the estimates for 1984/1988 and 1989/1993 need not fall completely out of the plausible range. The most plausible estimates (PE) are obtained on the basis of the assumptions underlying the various procedures, the possible impact of the various errors listed above and the degree of robustness of each procedure in the face of declining fertility. The estimates indicate that the level of fertility in Ghana fell from about seven children per woman in the 1960s and 1970s to 4.6 children per woman by the turn of the last century; a decline of 33 per cent during the forty-three year period (1960-2003) or an annual decline of 0.8 per cent. The average number of children born to a Ghanaian woman was reduced by 2.3 children; averaging a reduction of 0.05 children per year during the entire period. The pace of the decline, however, increased to 0.2 children per year during the late 1980s and the 1990s and slowed down considerably to 0.14 children per year by the end of the 20th century. It will be seen from table 1 panel E that the change in fertility is much more marked among the younger women (20-35 year olds than among the older cohorts, particularly during the second half of the 1990s. For instance, the successive ratios of both cumulative and cohort-periods fertility rates are much higher for the period 1994-1998 as compared with those for the period 1993-1984; suggesting acceleration of the tempo during the last five years of the last decade of the 20th century.
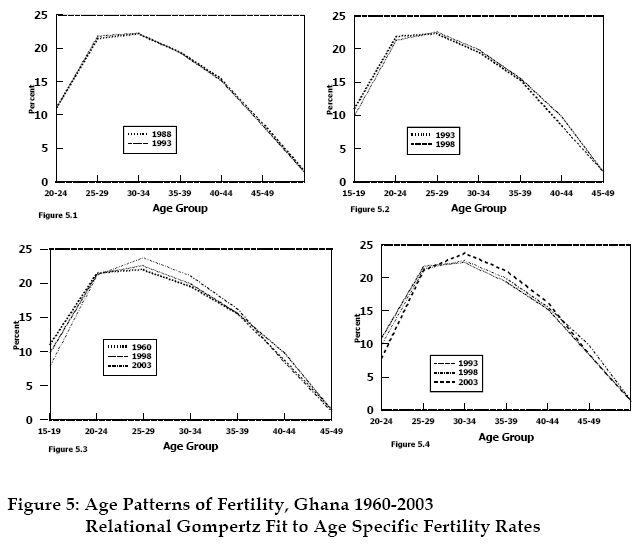
Age Structure of Fertility The structure of fertility also began to gradually transform from a broad peak type (peak in 20-24 age range) to a type with a more concentrated spread and peaking in 25-59 years age group (figures 5.1-5.4 and appendix C table 1). The changing pattern is also reflected in the relational Gompertz parameters (α and β); α increases from - 0.080 in the 1960s and 1970s to –0.114 in the 1980s to –0.165 in absolute value by the turn of the 20th century (table 4) while β rises from between 0.913 and 0.919 in the 1960s and 1970s to between 0.940 and 0.970 in the second half of the 1990s. It is important to bear in mind that as α becomes more negative, childbearing moves to later ages (e.g. increase in age at first birth) and the larger β becomes, the smaller the spread of fertility distribution becomes. An examination of table 1 in appendix C indicates that major transformation of the age structure of fertility began in tandem with the dramatic decline in fertility in the second half of the 1990s. Discussion The original P/F ratio method and modified versions, one through the intermediary of relational Gompertz model, for analysing birth history data, are employed in assessing data quality as well as determining fertility levels and trends. The measurements are fettered with difficulties arising from errors relating to omitted births, age misreporting and birth misplacement. These errors distort data in various ways and there is uncertainty about the extent to which they interact to further bias the information. Strategies are therefore adopted to reduce the impact of the errors on the derived estimates to tolerable levels. These include grouping of births and ages into five yearly categories. Among these is the restriction of the analysis to comparing estimates for the most recent period covered in each of the surveys, which were conducted five years apart (i.e. 0-4 years period in the 1988, 1993 and 1998 surveys). Thus, the probability of distortion of measurements due to misplacement is expected to be minimal. The application of the three procedures yielded estimates which suggest that the level of fertility in Ghana fell from about seven children per woman in the 1960s and 1970s to 4.6 children per woman by the turn of the last century; a decline of 33 per cent during the forty-three year period (1960-2000) or an annual decline of 0.8 per cent. The average number of children born to a Ghanaian woman was reduced by 2.3 children; a reduction of 0.05 children per year during the entire period. The pace of the decline, however, increased to 0.2 children per year during the late 1980s and the 1990s and slowed down considerably to 0.04 children per year by the beginning of the 21st century with the total fertility rate falling from 4.8 in the late 1990s to 4.6. The change was much more marked among the younger women (20-35-year olds) than among the older cohorts, particularly during the second half of the 1990s. Ghana is classified as a medium- or intermediate-fertility country. Intermediate fertility countries are countries that are experiencing fertility decline but the level of fertility is still above replacement level (i.e. 2.1 children per woman). The level of fertility in these countries is estimated to reach replacement level by 2050 (UN 2000 Revision). Replacement level-fertility is a theoretical construct. No population has a built-in replacement mechanism; the replacement fertility-level varies with level of mortality prevalent in the population. Because fertility declines have occurred in many different situations, it is not easy to ascertain which factors can indicate how long it will take a country which is mid-way through the transition to reach replacement level and by what amount of decline at the various time intervals. Experience shows that there tends to be a slowdown of the rate of decline during the movement through the transition. Argentina, Uruguay, Egypt and Tunisia, to name a few, have experienced slowdowns during 1950-2000 and they have not yet shown signs of reaching the replacement level. In the case of Tunisia, Stamm and Tsui observed that: Though fertility declined as a result of technological and economic change, the strength of the traditional and cultural value of the family has prevented the realization of a completed fertility transition ( Stamm and Tsui 1986:159-197). Recent estimates indicate that the transition will be completed by 2005, more than twenty five years since Tunisia began to experience significant drop in the level of fertility. The total fertility rate of four children per woman remained constant for a considerable length of time before resuming a downward trend. Similar observation has been made in respect of fertility decline in Egypt: “Relatively steep falls occurred in the 1960s and by the end of the 1970s the crude birth rate was around 37 per thousand population. Thereafter, fertility apparently began to stabilize again. The subsequent levelling off is harder to explain” (Pat Caldwell 1977: 594). Argentina and Uruguay have exhibited similar patterns of fertility. Fertility level dropped to about 3 children per woman in 1950-1955, but it has remained consistently above replacement level for over forty-five years. Some Aspects of the Implications of Reproductive Change Rate of growth and Population Age Structure Why is the rate of population growth relatively high despite a substantial decrease in the level of fertility? Fertility trends affect the rate of growth by determining: 1. The number of births women have and 2. The size of the different generations. In majority of the African countries where fertility is above replacement level, children outnumber their parents by substantial amounts and the children in turn have more children than required to replace their parents’ generations even when fertility level is declining. Consequently, as fertility falls, the number of births to relatively large generations of parents is higher for some time than the number of deaths in the population, most of which are that of grand parents and great grand-parents. This process tends to maintain a relatively high positive population growth rate even though fertility is falling. In most of the countries where fertility rate is reported to be falling, overall population growth rates are relatively high, implying that fertility rate is still high and in consequence the balancing of the demographic “deficit” will take sometime to be effected. This is exactly what is happening in Ghana at the moment. The age structure of Ghana in 2000 is typical of a country just entering the demographic transition from high to low fertility. There is a broad base at the bottom consisting of large number of children and a narrow top with a relatively small numbers of elderly. The Ghana Statistical Service medium projections indicate that the number of young people (15-24 year-olds) will grow much more rapidly, rising from 3.5 million in 2000 to 4.5 million in 2010 and nearly 5.6 million in 2020. The projected figures indicate that the youthfulness of the population will persist for a considerable length of time. Thus, the population still has the high potential inherent in the age structure with subsequent rapid expansion of the population into the middle of the 21st Century The female population aged 15-49 years increased from 1.6 in 1960 to 1.9, 2.8 and 4.5 million in 1970, 1984 and 2000 respectively and it is expected to grow to 5.7 million in 2010. The number of births per year increased from 345,000 in 1960-1965 to 657,000 per year in 2000-2005 and it is expected to increase to 713,000 in 2010-2015 (UN 2000). Thus, large number of births and the size of different generations will generate expansion of the population even though fertility has been declining. Population continues to grow after fertility reaches replacement level[1] because of a temporary imbalance in the age structure. When fertility declines from high to low levels, populations tend to be characterized (for about 15 to 20 years later) by unusually large proportions of men and women in their reproductive years, leading to large numbers of births even when fertility rates are low. It has been estimated that an immediate fertility decline to replacement level in developing countries would be accompanied by an ultimate population increase of two- thirds before growth ceased (Keyfitz 1971:83-89) For instance, Japan reached replacement level in 1957, but because of population momentum, the Japanese population is projected to keep growing until 2006. Hence, even if Ghana’s fertility reaches replacement level in 2050, the population will continue to grow for a considerable length of time during the course of the 21st century. Research and Policy Implications The ongoing reproductive change, particularly the movement through the fertility transition, has far reaching implications for social and economic development. Changing Youth Population As noted above, the size of the population of the youth (i.e. persons aged between 15-24 years) increased more than three-folds between 1960 and 2000. The rapid growth of the adolescent and youth population has increased the pressure to expand education and health services and employment opportunities. Policy makers must bear in mind that the period of rapid expansion of the adolescent population will be long. For instance, the medium projections indicate that the number of young people (15-24 year-olds) will grow much more rapidly, rising from 3.5 million in 2000 to 4.5 million in 2010 and nearly 5.6 million in 2020. In addition to absolute numbers, the proportion of young people in the total population raises policy concerns. The proportion increased from 18.7 per cent in 1960 to nearly 19 per cent in 2000 and it is estimated to climb up to 20 per cent in 2020. A situation in which 20 per cent or more of a population is aged between 15-24 years has been described as “ Young Bulge”. There is a speculation that this phenomenon may subject a society to potentially disruptive, political and social movements. In addition to increasing services and facilities to cope with large numbers of young people, the expansion of this segment of the population raises two important policy concerns: 1. The adolescents and young adults are about to enter or are already in their prime reproductive years, leading to large numbers of births, even when fertility is low. 2.Adolescent and young adults are prone, among other things, to high-risk sex behaviour leading to increase in prevalence of HIV/AIDS. A review of the studies conducted on adolescent sexual and reproductive health highlights the need to systematically investigate the risk and protective behaviours of Ghanaian adolescents in order to assemble research-based evidence for designing strategies for meeting the sexual and reproductive health needs of the youth. Among the key findings is the yawning gap between policies and their translation into programmes and activities (Kofi Awusubo-Asare et. al. 2004). Sexual and contraceptive behaviour of the youth are reported to be influenced in important ways by myriad factors operating at the individual, family, community and societal levels. There is therefore the need for a more in-depth research to enhance our knowledge about the relative importance of the plethora of factors that appear to influence adolescent risk-taking. Further research is also required to assess the roles being played by the traditional family structures, which are under considerable pressure arising from social and economic development, and the emerging family structures in influencing sexual and reproductive behaviours among the Ghanaian youth. Thus, there is a great need for additional research to generate viable data for designing effective strategies and interventions. Experimental studies are also critical to effective integrated service delivery. Policymakers and programme managers must pay increasing attention to the youth – special needs of adolescents and young adults and challenges of reaching young people with information and service. The substantial increase in the number of females of the childbearing age range over the years also puts pressure on expansion of sexual and reproductive health facilities and services. Aging Population It is also important to bear in mind that the population is aging gradually, and it will be a great mistake to dismiss aging as an issue that need not be considered until some time in the future. Policy options for this segment of the population will include enhancement of traditional support systems, greater employment opportunities for the elderly who are still capable to remain in the work force, institutions that support high levels of personal savings and government programmes such as pension schemes and health care systems. Research-based evidence is required for design of appropriate strategies and action programmes. For instance, we know next to nothing about the pattern of adult mortality. All estimates of the overall indicators of the level and trend of mortality are based on a combination of infant and childhood mortality estimates (derived from census/survey data) and models. Why can’t this country institute a sample vital registration system, a feasible and less expensive data collection instrument, to compile statistics on adult mortality? Policymakers and programme managers should note that fairly reliable information on adult mortality is crucial for developing supporting schemes for the elderly. Fertility and Family Planning Another emergent issue is the huge discrepancy between contraceptive use and the level of fertility. Significant drops in the level of fertility without marked increases in contraceptive prevalence can only be explained in terms of major changes in the proximate determinants - e.g. timing of marriage, commencement of exposure to the risk of childbearing and changes in the durations of postpartum abstinence, amenorrhoea and breastfeeding and foetal losses. The decomposition of the effect of the proximate determinants of fertility over the past decade (i.e. 1988-1998) indicates that postpartum non-susceptibility (i.e. durations of breastfeeding, postpartum abstinence and amenorrhoea) contributes between 70 and 80 per cent of the total number of births per woman averted by all proximate determinants[2] during the period 1988-1998. The contribution of marriage increased slightly from 12 to 14 per cent and that ofcontraception from 7 to 18 per cent. Put in another way, out of the 7.8 births per woman averted in 1998, 5.5 are attributable to postpartum non-susceptibility variables and only 1.4 births are due to contraceptive use. The contribution of contraception, however, rose from 0.57 births in 1988 t0 1.4 in 1993. Thus the effect of contraception appears to have stagnated during the period 1993-1998. The major determinants of the fertility decline are therefore the durations of amenorrhoea, breastfeeding andpostpartum abstinence. Abortion may play a very significant role in the fertility transition but lack of information makes extremely difficult to estimate the extent of its contribution. As already pointed out, to complete the fertility transition, contraceptive prevalence needs to be substantially stepped up. Experience indicates that replacement levels are usually not attained with contraceptive prevalence of less than 50 per cent. The findings of the 1998 DHS and 2003 DHS show that contraceptive prevalence levels were 22 per cent for any method and 13 per cent for any modern method during the mid 1990s and increased to 25 and 19 per cent respectively by the turn of the last century (GSS/Macro Inc. 1999 and 2004). The demographic realities have placed us in a situation that has given rise to new questions and requirements. For instance, is Ghana going to go through the experience of Tunisia? If so, how long is she going to creep over the 4-child plateau; bearing the power of traditional and religious props? What are the forests driving fertility through the transition? Can significant drops in the levels of fertility and infant and child mortality occur without equal access to health and education facilities and services, the key to rapid economic growth and efficient poverty reduction ?. A search for the answers calls for a number of empirical studies that will be required to provide the basis for designing context specific development strategies. Since the multi-dimensional nature of development comes with greater complexity in development strategies, such studies must be interdisciplinary, employing both quantitative and qualitative data collection instruments. These are examples of issues that need to be investigated by a research agenda. References
[1] Replacement-level fertility is defined as a total fertility of 2.1 children per woman, which includes one-tenth of a child extra to make up for the mortality of children and of women who do not reach the end of the reproductive years. [2] Effect of abortion is assumed to be zero Appendix A Table 1: Brass P/F Ratios (P/F), Reported Age-Specific Fertility Rates (ASFR), Average Parities (P) and Total Fertility Rates (TFRs), Ghana 1960-2000
Table 1 CONTD.
Appendix B Table 1: Cohort-Period Fertility Rates, Cumulative Rates by Cohort and Period, and P/F Ratios, Ghana DHS, 1998
Appendix C Table 1: Age pattern of Fertility, Ghana 1960-2003
Derived by Relational Gomperzt Function Copyright 2005 - Union for African Population Studies The following images related to this document are available:Photo images[ep05009f4.jpg] [ep05009f5.jpg] [ep05009t2.jpg] [ep05009t1.jpg] [ep05009f2.jpg] [ep05009f1.jpg] [ep05009t3.jpg] [ep05009t4.jpg] | ||||||||||||||||||||||||||||||||||||||||||||||||||||||||||||||||||||||||||||||||||||||||||||||||||||||||||||||||||||||||||||||||||||||||||||||||||||||||||||||||||||||||||||||||||||||||||||||||||||||||||||||||||||||||||||||||||||||||||||||||||||||||||||||||||||||||||||||||||||||||||||||||||||||||||||||||||||||||||||||||||||||||||||||||||||||||||||||||||||||||||||||||||||||||||||||||||||||||||||||||||||||||||||||||||||||||||||||||||||||||||||||||||||||||||||||||||||||||||||||||||||||||||||||||||||||||||||||||||||||||||||||||||||||||||||||||||||||||||||||||||||||||||||||||||||||||||||||||||||||||||||||||||||
| |||||||||
