 |
| About Bioline | All Journals | Testimonials | Membership | News |
|
||||||
|
||||||
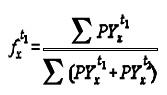
African Population Studies/Etude de la Population Africaine, Vol. 20, No. 2, 2005, pp. 165-177 Mortality among Married Men in Rural Kenya and Malawi Henry V. Doctor, Alexander A. Weinreb Department of Statistics, University of the Western Cape, Belville, South Africa Code Number: ep05016 Abstract Using prospective longitudinal data, this article describes recent changes in the levels of adult mortality among married men aged 20–59 in selected rural areas of Malawi and Kenya, and in the age pattern of their mortality. Sampled areas have, respectively, moderate and high HIV prevalence. The observed annual probability of dying for males interviewed in an initial wave of each study and then reported as deceased in follow-up interviews is 0.031 in Nyanza and 0.016 in Malawi. Compared to life table estimates for equivalent age groups generated from Kenya’s 1989 census and Malawi’s 1987 census, these results represent a 3-fold increase over 1980s census levels. These changes have reduced life expectancy at age 20 by about 14 years in Nyanza and 7 years in Malawi. Observed mortality is consistent with a younger age of HIV infection in Nyanza. Sample characteristics suggest that these levels underestimate the total effect of AIDS on mortality. Introduction This article describes recent changes in the levels of adult mortality among married men in selected rural areas of Malawi and Kenya, and in the age pattern of their mortality. Describing these types of changes is important for two main reasons. The first is related to an old demographic lament. On one hand, sub-Saharan African populations, especially in East Africa, continue to be predominantly rural (Oucho and Gould, 1993). This means that the force of mortality among rural residents is the most important component of total mortality in most areas of the continent. Yet on the other hand, the relative dearth of data on adult mortality is particularly acute in these rural areas, making it difficult to assess mortality, or more especially rapid changes in mortality. Second, and superimposed on this relative dearth of data, there is an emerging literature in demography which suggests that adult mortality patterns in high HIV/AIDS areas are changing in two key ways. Not only are they dramatically increasing in magnitude: on the order of 2–5 times in many areas (Gregson et. al, 1997; Feeney, 2001; Dorrington et. al, 2001; Sanders et. al, 2003; Hosegood et. al, 2004; Notkola et. al, 2004). But, perhaps more interesting, there appear to be significant changes in normal age-specificmortality patterns.Writing about Zimbabwe, for example, Feeney (2001: 778) writes that AIDS “radically distorts the normal age pattern of human mortality” by undermining the positive relationship between age and risk of death at prime- and middle-ages. The problem is that this literature draws much more heavily on data from urban areas or rural areas in southern Africa than from rural areas elsewhere on the continent. Our aim in this article is to explore whether parallel trends also appear to be evident in rural areas of East Africa with equivalent moderate to high HIV prevalence. Background The paper uses prospective mortality data—described in the “Data and Methods” section—collected in Nyanza Province, Kenya, between 1994 and 2000, and in all three regions of Malawi in 1998 and 2001. NyanzaProvince has had the highest overall mortality in Kenya for at least a few decades (Ewbank et. al, 1986)1. Province-specific model life tables derived from the 1989 Kenya census, for example, have shown that, as of the 1980s, the period whose mortality these schedules reflect, life expectancy at birth (e0) in Kenya varied from a high of 69.1 years in CentralProvince to a low of 47.0 years in NyanzaProvince (Kenya Central Bureau of Statistics, 1996). About half of this difference (47%) in e0 was due to variation in mortality beyond age 15, leading to estimated life expectancy at age 15 (e15) of 58.1 and 47.7 years for Central and Nyanza Provinces respectively. While these regional differences in life expectancy predate the impact of AIDS, AIDS appears to be exacerbating them. For while Kenya’s HIV prevalence among all adults is currently estimated at 13.9%, slightly lower than in many other countries in the east and southern Africa AIDS-belt, this national estimate disguises the fact that Kenya’s HIV/AIDS burden is borne more heavily in western areas of the country, specifically in Nyanza and Western Provinces, than in the other areas (from west to east, the other provinces are Rift Valley, Central, North Eastern, Eastern, and Coast – UNAIDS, 2000). Surveillance sites in Kisumu, for example, the fourth largest city in the country, and the main city in NyanzaProvince and in western Kenya as a whole, have estimated HIV prevalence among pregnant women for the years 1994, 1995, and 1997 (the latest years for which data are available), at 30.4, 27.3, and 34.9%. A seroprevalence survey of women aged 15–49 in Kisumu conducted as part of the UNAIDS “multicentre study on HIV in sub-Saharan Africa” in 1998 (Buvé et. al,2001a), foundsimilar levels of 30.1% positivity (including 23.0% among women aged 15–19). They also found an extremely high prevalence among Kisumu women of both Herpes Simplex Virus type-2 (HSV-2) and Trichomoniasis – 68.0 and 29.3% prevalence, respectively (Buvé et. al, 2001b; Weiss et. al,2001). Both of these, ofcourse, are highly correlated at the individual level with HIV status, but they also indicate the relative lack of health care. Life expectancy at birth in Malawi has traditionally been even lower than in Kenya’s NyanzaProvince. An analysis of the last three rounds of census data reveal that it increased from 41 in 1977 to 48 in 1987, but then, with the impact of AIDS, had fallen to about 39 in 1998 (Doctor, 2001). This reduction appears to be wholly the result of increasing adult mortality, since child (under-five) mortality declined from 234 deaths per 1,000 live births in 1992 to 189 deaths per 1,000 live births in 2000 (National Statistical Office [Malawi] and ORC Macro, 2001). Indeed, the 1988 census places male life expectancy at age 15 (e15) in Malawi at 46.7 (signaling equivalent levels of adult mortality to those observed in Nyanza). Regional variation in HIV is less pronounced in Malawi. Although sentinel surveillance of pregnant women indicates that HIV prevalence tends to be highest in Southern region and lowest in Northern region, these differences appear to be relatively small in comparison to the regional variation in Kenya. For example, 1998 rates for southern urban areas Blantyre, Mulanje and Mangochi are, respectively, 30.4, 25.2 and 19.4%, and for northern urban areas Mzuzu, Nkhata Bay and Rumphi are, respectively, 18.5, 25.0, and 12.5% (UNAIDS, 2000). Region-specific data from either the 1987 or 1998 census have not been released so it is not possible to link these indicators to actual measures of mortality. But estimates based on non-census data point to relatively high HIV prevalence: 13.9% among women aged 15–49 in a 1998–2001 population-based study in Karonga District in Northern Malawi (Crampin et. al, 2003)2. In summary, rural areas in NyanzaProvince and Malawi can be said to represent high-HIV prevalence areas of East Africa, making them suitable sites to explore whether changes in the levels and age patterns of mortality due to HIV/AIDS are occurring in rural areas outside Southern Africa. Data and Methods We use prospective mortality data from a sample of rural, married residents, traditionally considered a relatively “low-risk” group with respect to HIV infection. Data of this type have been used in several analyses of AIDS-related mortality in other areas of sub-Saharan Africa (Gregson et. al,1997; Todd et. al,1997; Tollman et. al, 1999; Urassa et. al, 2001). The data were generated in longitudinal social networks projects in NyanzaProvince and in the three main regions in Malawi. In both, the target sample was rural ever-married women and their husbands. The Kenyan data were collected in three rounds in South Nyanza District, the largest district in NyanzaProvince, and cover a five-year period3. The Malawian data thus far include the collection of two rounds of data over a three-year period (third and fourth rounds are scheduled for 2004 and 2006). Both the Kenyan and Malawian data are public use and can be obtained at www.ssc.upenn.edu/Social_Networks. In the Nyanza data, villages were randomly selected in four “sublocations,” one of the lowest rungs on the Kenyan administrative ladder. All married women and their husbands in those villages were interviewed. The first wave of data (Nyanza-1) was collected between November 1994 and January 1995, an intermediate round (Nyanza-2) was fielded exactly two years later, and a third wave (Nyanza-3) was conducted between January and March, 2000. On average over the four sites, 62 months separated Nyanza-1 and Nyanza-3. InMalawi, “traditional authorities” (TA) were selected (TAs are one of the lowest rungs on the Malawian administrative ladder), villages within these were randomly sampled, and then a sample of eligible women and their husbands was drawn. The first wave of data (Malawi-1) was collected in summer 1998, and the second round (Malawi-2) exactly three years later. The mortality data used in this analysis represent mortality-induced survey attrition over that Nyanza-1 to Nyanza-3 and Malawi-1 to Malawi-2 period. Only men’s data are considered in this paper. Data on female mortality are less reliable for two reasons, both of which stem from the norms of patrilocal post marital residence. First, other than in our southern Malawi sites, which are dominated by the matrilocal Yao and Lomwe, women tend to leave the area in cases of separation or divorce. Where separation or divorce results from a disclosure of HIV+ status or the emergence of full-blown AIDS, we are therefore likely to miss women’s deaths. Second, where marriages end because of the husband’s death, women often return to their natal homes, especially where insufficient bride wealth has been paid (where sufficient bride wealth was paid they can be “inherited” among the Luo [Luke, 2002]). Over the five-year period in the Nyanza data, 133 out of a total sample of 941 men are reported to have died (14.1%). Because the sample list included all de jure residents of the selected villages, and there are high levels of sex-selective labor migration out of Nyanza, data were collected from 818 of these individuals in either Nyanza-1 or Nyanza-2 (490 interviewed in both Nyanza-1 and Nyanza-2, 253 only in Nyanza-1, and 75 only in Nyanza-2), representing a cumulative 87% response rate. Among these 818 men, there were 109 deaths (13.3%). For the analysis used in this paper, however, the sample is limited to (a) the 674 men who reported their age as between 20 and 59 and (b) to the 98 deaths that occurred in the 60 month period between January 1995 and December 1999 (thereby eliminating the deaths of 3 respondents reported to have died while Nyanza-3 was in the field in early 2000). Similar restrictions are imposed on the Malawi data. Of the total sample of 1,521 husbands, 1,066 were interviewed in Malawi-1 (70% response rate). Of these, 1,023 were aged 20–59, and 50 of these died over the three years. These reported deaths appear to reflect real mortality. The best indicator of this is that out of the 45 deaths reported to have occurred between Nyanza-1 and Nyanza-2, only one was revealed to be a “resurrection” in the subsequent Nyanza-3 round, even though attempts were made to locate all respondents, including those reported as deceased in Nyanza-2. Similarly, the 12 male deaths reported in a partial follow-up of the original 1998 Malawi sample in 1999 were confirmed as deceased in 20014. And analyses of verbal autopsies collected in Malawi in 2001 were consistent with projected level of AIDS-related mortality at the aggregate level (Doctor and Weinreb, 2003). Nor do problems with age-reporting, to which mortality data are sensitive, appear to affect the life table analysis since there is no evidence of systematic bias beyond the individual level in the Nyanza data, and only minimal bias in the Malawi data. Specifically, the average ages of the 490 men interviewed in both Nyanza-1 and Nyanza-2 are 2.02 years apart (40.3 and 42.3 respectively). Similarly, the average ages of the 829 men interviewed in both rounds of the Malawi sample are 3.3 years apart (37.1 and 40.4 respectively). Standard life table calculations were used to produce mortality estimates (Preston et. al, 2001). The basic steps were as follows: First, a five-year age-specific mortality rate mx was calculated for those who were initially interviewed in Nyanza-1, and a three-year rate for those initially interviewed in Nyanza-2 or in Malawi-1. Second, these were (i) transformed into annual probabilities of dying qxwithin 10-year age groups, and (ii) combined into a single annual probability using a person-years (PYs) factor that weighted the relative contribution of the two sets of respondents. This was in order to take into account the fact that those initially interviewed in Nyanza-1 had up to five person-years of observation, and those initially interviewed in Nyanza-2 or Malawi-1 had only three years. Specifically, we combined the two Nyanza-specific annual probabilities of dying – the first specific to deaths between Nyanza-1 and Nyanza-3, and the second between Nyanza-2 and Nyanza-3 – into a single age-specific mortality estimate for annual probability of dying in the 1995–2000 period by using a person-years factor fxt that expressed the relative contribution of the Nyanza-1 or Nyanza-2 sample to the overall number of person-years in that age group. The factor for the relative contribution of the Nyanza-1 interviewees aged x, for example, is:
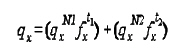
where PYx refers to the sum of all PYs lived in the inter-survey period by someone aged x, and superscript t1 and t2 refer to the time of initial interview, Nyanza-1 or Nyanza-2. For those people initially interviewed in Nyanza-1, for example, PYx refers to all PYs lived in the five year period. For those initially interviewed in Nyanza-2, it refers to all PYs lived in the three year period. Thus, the overall probability of death in the Nyanza data (as presented below in Table 1) is:
where superscripts N1 and N2 refer to Nyanza-1 and Nyanza-2 respectively, and as implied above, fxt2 = 1 - fxt1. Finally, in order to assess the statistical generalizability of the observed mortality rates, 95% confidence intervals (C.I.) were specified around the observed number of deaths allowing for the estimation of parallel mortality schedule representing a high and low bound, denoted as qxhi and qxlo respectively. Similarly, in order to facilitate a comparison over time for this same areas of Kenya and Malawi, parallel calculations were conducted on life table schedules from the 1989 Kenya census South Nyanza life table, and from the 1987 Malawi census, generating qxLT. Results The annual probability of dying in both the Nyanza and Malawi surveys (qx, qxhi and qxlo) and the South Nyanza and Malawi life tables (qxLT) is presented in Table 1. Two main patterns emerge. First, there are differences in the absolute level of mortality between Nyanza and Malawi. Both the observed survey and life table mortality are about twice as high in the former as in the latter. In Nyanza, observed mortality signals an annual probability of dying of 31 per 1,000 between the ages of 20 and 59 (ranging from 28 to 35 in discrete age groups), up from the 1980s district-level census range of 11 per 1,000. In Malawi, in contrast, the observed annual mortality rate is 16 per 1,000 in the same 40 year age group (11 to 25 in discrete age groups), up from 6 per 1,000 in the 1988 census. Table 1: Annual Probability of Death, by 10 Year Age Group for Nyanza and Malawi Sample, with Upper and Lower Bound Estimates, and Equivalent Probabilities Derived from the 1989 Kenya Census South Nyanza District Life Table and the 1987 Malawi Census
1 “High” and “Low”Sspecify 95%
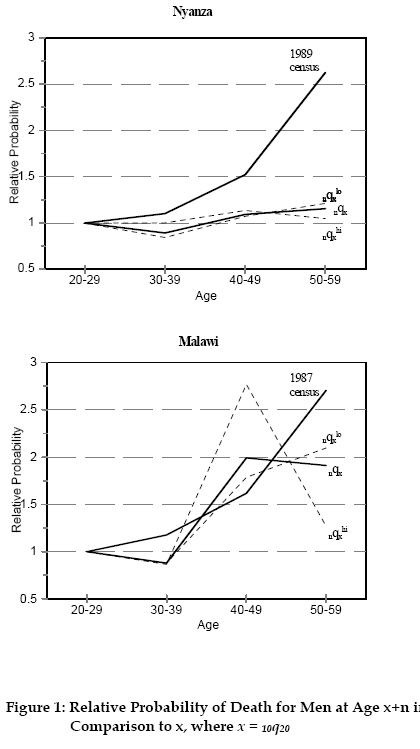
Confidence Intervals around theOobserved Mortality. Second, there appear to be distinct age patterns, as shown in Figure 1, which graphs the relative probability of death for men in age groups 30–39, 40–49, and 50–59 in comparison to the probability at ages 20–29. In typical mortality schedules, this relative probability rises at an accelerating pace from late childhood, as reflected in the 1989 and 1987 census lines, which represent the life table estimates derived from the Nyanza and Malawi censuses. Observed survey mortality in Malawi appears to roughly follow this same trajectory until the 50–59 age group. Thus, there are two main levels of mortality in the Malawi data. A lower one applies to the 20–39 age group, and a slightly higher one to the 40–59 age group. The Nyanza mortality, in contrast, appear to be almost completely horizontal. This radical departure from the normal age pattern of mortality in the Nyanza data is consistent with the high HIV prevalence among the Kisumu teens referenced above, since it implies that the mortality impact of AIDS in Nyanza appears to begin much earlier than in Malawi, where the biggest increase appears to be in the 40–49 age group. Table 2: Ratio of Observed to Life Table Annual Probability of Death, by 10- Year Age Group, for Nyanza and Malawi Sample, with Upper and Lower Bound Estimates
1 “High” and “Low” specify 95%
confidence around the observed mortality. Related to both these points, the difference between the observed and prior life table mortality is similar across the sites, shown in Table 2. Over the whole 40-year age group, mortality increased by a factor of 2.9 in the Nyanza data, and 3.0 inMalawi. With the exception of the 50–59 age group in the Malawi data, the low estimate is greater than one in all age groups of both the Nyanza and Malawi data, signaling statistically significant changes. There appear to be differences in age-specific patterns, however. In the high HIV Nyanza setting, the observed probability of death has increased by a factor of 4.4 among adult males aged 20–29, by a factor of 3.6 at ages 30–39, 3.2 at 40–49, and 1.9 at 50–59. This linear change in relative probabilities across age is what produced the flat Nyanza mortality curve discussed above. Malawi changes, in contrast, while on the same order of magnitude, are less stable across age groups: they increase by a factor of 3.6 at ages 20–29, 2.7 at ages 30–39, 4.5 at ages 40–49, and 2.6 at ages 50–59. Table 3: Prior and Observed Life Expectancy at Age 20 (e20) in South Nyanza and Malawi Life Tables
Finally, Table 3 presents new measures of life expectancy at age 20 (e20) in these populations. It is the product of life tables in which observed age-specific mortality levels reported in Table 1 were substituted for prior life table levels. It shows that e20 has fallen by 13.7 years in South Nyanza and 7.4 years in Malawi. The 95% C.I. specifies a range of 7.2 to 17.5 years in the former, and 4.7 to 11.9 years in the latter. Discussion Both the Nyanza and Malawi data unambiguously show that adult mortality has increased significantly in both of these populations. The scale of increase either matches or exceeds that identified in Zimbabwe, South Africa and Namibia (Gregson et. al, 1997; Feeney, 2001; Dorrington et. al, 2001; Notkola et. al, 2004), pushing observed mortality in these areas close to the international benchmark for a “humanitarian crisis” (Keely et. al, 2001). The effects on age patterns are more equivocal across the two research areas and appear to be related to the level of HIV/AIDS. In higher prevalence Nyanza, the age pattern parallels the Zimbabwe results noted by Feeney (2001): that is, it has distorted standard age patterns of mortality. This is also consistent with the high prevalence of HIV/AIDS at young ages in Nyanza noted in the 4-city study. In lower prevalence Malawi, in contrast, there is still an incline in the slope of the Malawian age-specific mortality function, suggesting that the mortality impact of AIDS (among men) has been primarily borne by older males. Questions can be raised about the generalizability of these data since the research sites were not chosen randomly, and the sampled population is rural and currently married. It is hard to say how the first of these affects the data since, as noted above, both the Nyanza and Malawi research sites represent the diversity of Nyanza and Malawi communities on what we imagine are important and pertinent dimensions: geographic location, access to roads and other development infrastructure, lakeshore fishing and non-fishing communities, proximity to a market town. Elsewhere, it has been shown that these samples are highly similar to those generated by the Kenya and Malawi Demographic and Health Surveys in the same areas (Watkins, 2002, personal communication). More specific to mortality, it has also been shown that there is little heterogeneity in mortality in terms of respondents’ socioeconomic and residential characteristics, and this heterogeneity is itself shrinking. In short, possible sample selection biases do not seem to matter if AIDS is affecting mortality across the three Malawian research areas more or less equally. Given the lack of statistically significant differences in observed mortality across the areas -- tabulations are available from the authors upon request -- this appears to be the case. Moreover, the individual characteristics of our sampled population lead us to believe that we have more likely underestimated than overestimated the mortality effects of AIDS in these populations. For if anything, a sample of rural currently-married men is, notwithstanding an emerging debate about the protective value of marriage (Bracher et. al, 2003), what would generally be considered a lower risk group on three dimensions. It is: (i) rural, (ii) married, and (iii) not currently part of the migrant labor force. Comparing mortality in a sample of this type, typically associated with lower HIV/AIDS infection rates, with observed rates in prior life tables likely underestimates the impact of AIDS on mortality since those life tables include higher risk urban and unmarried individuals. Moreover, if non-AIDS related mortality has decreased since the 1980s, then the comparison to those census-derived life tables may actually underestimate the proportion of mortality due to AIDS. Notes 1 District- and province-level estimates of life expectancy at birth presented by Brass and Jolly (p. 44) based on Kenya’s 1979 census inexplicably exclude estimates for Nyanza Province (Brass and Jolly, 1993). 2 In both Kenya and Malawi, there appear to be several reasons for the existence and, in the latter, relatively modest level of regional variation. Both Nyanza and Malawi’s Southern region are on major overland trade routes. The lack of employment prospects in rural areas has created a “culture of migration,” pushing large numbers of young men (and increasingly women) to cities, to large commercial farms, or abroad. These migration norms are particularly strong in Nyanza and in Malawi’s Northern region. In addition, traditional practices such as the Kenyan Luo’s lack of circumcision and relatively strong adherence to levirate marriage, and initiation rites among the Malawian Yao and Lomwe that are said to encourage premarital sex, have been blamed for relatively high HIV/AIDS in Nyanza and in Malawi’s Southern region (Zulu, 1996; Bracher et. al, 2003; Luke, 2002). Finally, regional differences in the availability of healthcare, especially in Kenya, may also be a factor. Nyanza, in particular, has the lowest number of doctors per capita in Kenya and is relatively impoverished with respect to a number of development characteristics (Weinreb, 2001a; 2001b). The relative lack of regional differences in child mortality and its covariates point to much lower levels of regional inequality in Malawi (National Statistical Office and ORC Macro, 2001). 3 The Kenya and Malawi data (and associated documentation) are from the Kenya and Malawi Diffusion and Ideation Change Projects, led by Susan Watkins, Eliya Zulu, Jere Behrman, Hans-Peter Kohler, and Alexander Weinreb. Also note that since 1995, South Nyanza district has been subdivided into Suba, Karachuonyo, and Homa-Bay District. 4 This single “resurrection” may also have been a function of a change in fieldwork methodology. During Nyanza-2, respondents frequently complained that they were not getting anything in return for their information, and interviewers reported signs of covert non-response, such as respondents being repeatedly “too busy” to be interviewed. In Nyanza-3, a small gifting strategy was introduced in order to alleviate these misgivings and, therefore, minimize sample selectivity problems. Signs of covert non-response were reduced accordingly. But this also raises the possibility that this resurrection may have been an attempt by a male relative of an actually deceased respondent to directly benefit from our gifting strategy. References
Copyright 2005 - Union for African Population Studies The following images related to this document are available:Photo images[ep05016f1.jpg] | ||||||||||||||||||||||||||||||||||||||||||||||||||||||||||||||||||||||||||||||||||||||||||||||||||||||||||||||||||||||||||||||||||||||||||||||
| |||||||||