|
| About Bioline | All Journals | Testimonials | Membership | News |
|
||||||
|
||||||
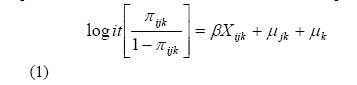
African Population Studies/Etude de la Population Africaine, Vol. 22, No. 1, 2007, pp. 3-20 SELF-ASSESSED HEALTH STATUS AND MORBIDITY EXPERIENCES OF TEENAGERS IN NAIROBI’S LOW INCOME SETTINGS Francis Obare Population Studies Center, University of Pennsylvania., 239 McNeil, 3718 Locust Walk, Philadelphia , PA 19104Tel: 1 215 898 6441Fax: 1 215 898 2124 E-mail: fonyango@pop.upenn.edu Code Number: ep07001 ABSTRACT This study uses data from a slum survey in Nairobi, Kenya, to examine the factors associated with self-assessed health status among 1,654 teenage boys and girls. Analysis involved logistic regression and multilevel models. The results show: 1) a significant but non-linear association between prior morbidity experiences and self-assessed health; 2) gender differences in self-assessed health status with female teenagers being more inclusive in their assessment of health status than male teenagers; 3) that the absence of the father was significantly associated with lower likelihood of reporting good health for male teenagers; for female teenagers, it was the absence of the mother; and, 4) that female teenagers who had experienced physical abuse were less likely to report good health compared to those who did not. These findings suggest a need for adolescent health interventions to not only target all aspects of health but also take the gender dimensions into account. Introduction Self-assessed health, also referred to as self-reported or self-rated health, and its relationship with subsequent morbidity and mortality is a well-researched area in the developed world. Beginning with the study by Mossey and Shapiro (1982), the consistent finding running across most of the studies is that self-assessed health is a good predictor of subsequent health outcomes including mortality. Self-reports of poor health have, for instance, been found to be associated with elevated risk of mortality and poor health outcomes (see for example Kaplan and Camacho, 1983; Pijls et al., 1993; McGee et al., 1999; Burström and Fredlund, 2001; Manor et al., 2001; Kennedy et al., 2004). A review of community studies of the relationship between self-assessed health and mortality by Idler and Benyamini (1997) and Benyamini and Idler (1999) confirmed the consistency of this finding. In one of the reviews by Idler and Benyamini (1997), the authors observed that it is very rare for one item to achieve such consistency in the social sciences. This area of research spans a period of over 20 years during which numerous localized studies in the developed world have examined different aspects of self-assessed health status including its determinants, differentials and its relationship with morbidity and mortality. However, within this very massive literature, very few studies exist that try to establish whether the relationship persists even in low-income settings, especially the developing world. The dearth of studies in the developing world is perplexing given that self-assessed health is considered a global measure of health. Moreover, as a global measure of health, the consistency in the findings still pervades despite the semantic variations that may exist in the questions eliciting self-assessment of health (Idler and Benyamini, 1997; Zimmer et al., 2000). While this is the case, the dearth of studies in the developing world could be attributed to a number of factors ranging from lack of appropriate data to concern with reliability of self-assessed health measures from settings where contact with the medical personnel may be limited owing to unavailability of adequate health services. Using data from a study conducted among slum communities in Nairobi, Kenya, this study examines the factors associated with self-assessed health status among teenagers aged 12-19 years in the city’s slum settlements with particular emphasis on morbidity experiences in the twelve months preceding the survey. The focus on teenagers is due to the fact that even in the developed world, much of the work has been on self-assessed health among the elderly. This is because self-ratings from older people are seen as more optimistic than from young people, hence possibly due to age, cohort or period effects, their reports are seen to encompass more holistic definitions of health (Idler and Benyamini, 1997). But it is worth noting that there have been recent attempts to examine whether the relationship holds for young people as well (e.g. by Manor et al., 2001; Burström and Fredlund, 2001; Rohrer and Young, 2000). For example, in a study of self-assessed health and mortality among members of different socio-economic groups aged 16 years and over in Sweden, a stronger association between fair health and increased risk of mortality was found among younger than among older age groups (Burström and Fredlund, 2001). Similarly, in a quasi-experimental study in central-west Ontario among adolescents aged 12 to 16 years who were followed from infancy, it was found that those who were of extremely low birth-weight rated their health-related quality of life significantly lower than those who were not (Saigal et al., 1996). The study is also of interest for a different reason. In particular, following from previous findings (Zimmer et al., 2000) and given the fact that self-assessed health is a subjective measure, there may be differences in the way people from different cultural settings subjectively interpret their health and health disorders. Caldwell (1993:131), for instance, alludes to the possibility of cultural differentials in health that may reflect the strength of alternative beliefs in disease causation. Furthermore, studies show that sub-Saharan Africa has lagged behind Asia and Latin America in terms of demographic and health improvements despite the fact that these regions’ experiences were at one time similar (Montgomery and Cohen, 1998). If these differences point to possible cultural differences as posited by Caldwell, then it is reasonable to expect similar differences in the way people, especially young people, report their health status vis-à-vis their morbidity experiences. Methods Data The data come from the Nairobi Cross-sectional Slums Survey (NCSS) conducted in 2000 by the African Population and Health Research Center (APHRC). The overall aim of the survey was to determine the magnitude of the general health problems facing slum residents, and to compare their demographic and health profiles to those of other areas of Kenya (APHRC, 2002). A weighted sample of representative households in all the slum clusters of Nairobi was drawn based on the census enumeration areas from the 1999 Kenya Population and Housing Census. A two-stage stratified sampling design was used: enumeration areas or clusters were sampled in the first stage, followed by households within these enumeration areas in the second stage. Out of 4,856 households identified for inclusion in the study, interviews were completed in 4,564 households (about 94%). A total of 3,356 women aged 15-49 years were identified in these households and interviews were completed with 3,256 (about 97%). In addition, another 2,195 teenage girls aged 12-24 years were identified for interviews and 1,934 (about 88%) were successfully interviewed. In the case of teenage boys, 1,843 were identified and interviews were successfully completed with 1,683 (about 91%). The sampling design therefore implies that individuals could be clustered within households which are in turn clustered within enumeration areas. Three survey instruments were used in the study. The first was the household schedule used to obtain a complete listing of members of the households from which all eligible respondents were identified. Information was also obtained on the household characteristics. The second instrument, the female questionnaire, was used to collect information from individual women aged 12-49 years. Information was collected through oral interviews on the following aspects: the respondents’ background characteristics (such as age, education level and marital status), mobility, reproduction and pregnancy experience, contraceptive use, antenatal and post-natal care, child immunization and health, fertility preferences, husband’s background characteristics (if married), the respondent’s work and livelihood activities, AIDS and other sexually transmitted infections, as well as general health matters. The adolescent questionnaire, the third instrument, was used to collect information from young men and women aged 12-24 years. For the latter, it served as an additional module to the female questionnaire. Information was collected on health, livelihood, and social issues relevant to adolescents in slum communities (APHRC, 2002). Whereas the APHRC study defined adolescents as those aged between 12 and 24 years, the present study uses the sample of male and female adolescents aged 12-19 years. This is based on the World Health Organization (2002) definition of adolescents as those aged between 10-19 years. A total of 1,666 respondents fell within this age range. Out of these, only about 0.3% (5 cases) reported that they did not know their health status and another 0.4% (7 cases) did not report their health status. These are excluded from the analysis. Of those included in the analysis, female respondents comprised 60%. Analysis Separate analyses are done for male and female respondents and involve the estimation of four models2. The first two (Models 1 and 2) are logistic regression models for male and female respondents respectively that do not take into account the hierarchical nature of the data and the unmeasured characteristics at the individual, household and cluster levels that may be correlated with self-assessed health. The next two (Models 3 and 4) are multilevel random-effects models (again for male and female respondents respectively) that account for the unobserved characteristics. The purpose is to determine whether models that take into account clustering and unobserved heterogeneity produce different results from those that do not. The general form of the multilevel model is a three-level logistic random-intercept model (Rabe-Hesketh and Skrondal, 2005) specified as follows:
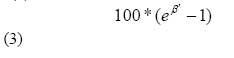
where ijk is the probability that individual i in household j in cluster k reported good health; Xijk is the vector of factors associated with self-assessed health; is the associated vector of fixed parameters; μjk ~N(0, σ(2)) is the random intercept varying over households (level 2); and μk ~N(0, σ(3)) is random intercept varying over clusters of communities (level 3). The model assumes that the error terms, μjk and μk, are normally distributed, are independent of the measured covariates, and that they vary randomly across households and communities respectively. The dependent variable, self-assessed health status, is dichotomized into 1 if the respondent reported good health and 0 if fair or poor health was reported. The dichotomization was necessary because of two reasons: one, there was no category for excellent health, and two, only about 1.3% of the respondents reported poor health. While this dichotomization may be a source of concern, a previous study (Manor et al., 2000) found that treating self-assessed health as a dichotomous or a categorical variable (both ordered and unordered) made no difference. The question on self-rated health asked, “How is your health in general?” with the possible responses being good, fair, poor and don’t know. The omission of “excellent” in this categorization may not seriously limit the measure as other studies have shown that in some settings, the distinction between excellent and good is blurred (e.g. Frankenberg and Jones, 2003). The main independent variable of interest is the number of illnesses experienced by the respondent in the past year prior to the survey. This is a quantitative variable, ranging from 0 to 7 for both male and female respondents, obtained by counting all the illnesses including sexually transmitted infections (STIs) and general illnesses that the respondent reported. We should expect those who indicated that they had experienced more illnesses to report fair or poor health. In other words, increasing number of illnesses in the past year should be associated with a decreasing likelihood of reporting good health. The questions on specific illnesses asked about sexually transmitted infections (AIDS, gonorrhoea, syphilis, genital warts, and “other”, each listed as a separate item requiring a yes, no or don’t know response) and general illnesses (namely, fever, malaria, typhoid, cholera, diarrhoea, cold/ flu/ throat infection, stomach-ache, cough, and “other”, again each listed separately with yes and no options). A quadratic term for the number of illnesses the respondent experienced in the past twelve months preceding the survey is also included as an independent variable to test for possible non-linearity in the association between self-assessed health and morbidity experience. While it was statistically significant in all the models, higher order polynomials for this variable turned out to be insignificant. The interpretation of the coefficient for the quadratic term is as follows: first the coefficient (b¢) is obtained for a few selected examples based on equation (2) below: β ' = β1 + 2β2 X ' (2) whereβ1 is the main coefficient for illness counts,β2 is the coefficient for the quadratic term for illness counts, and X' is the given count of illnesses in the past year prior to the survey. This is then transformed into the percent chance of reporting good health for a one-unit increase in the illness counts based on equation (3) below:
Among the control variables, age and education level are also measured as quantitative variables. Age ranges from 12 to 19 years while education is measured in terms of years of schooling with a range of 0 to 12 years for male and 0 to 8 years for female respondents. Other variables include presence of the mother in the household with three categories: ‘yes’, ‘no’, ‘dead or don’t know if mother is alive’; presence of the father in the household also with similar three categories; ethnicity is divided into five categories: ‘Kamba’, ‘Kikuyu’, ‘Luhya’, ‘Luo’ and ‘other’ comprising other smaller ethnic groups; religious affiliation (‘Catholic’, ‘Other Christians’, and ‘other’); an index of household wealth based on household possessions computed through principal component analysis; and indicators of deviant behaviour (whether the respondent took alcohol or drugs), receiving medical care when wanted, as well as being physically abused by anyone in the past year preceding the survey (all coded ‘yes’ or ‘no’). Age is important because available evidence shows that among the elderly, health deteriorates with age (Case and Deaton, 2003). However it is not clear whether the same can be said of teenagers. Increasing levels of education have been found to be associated with diminished likelihood of reporting the presence of morbidity conditions (Bobak et al., 1998; Ross and Mirowsky, 1999; Thomas and Frankenberg, 2002). With respect to parental presence, the presence of the father in the household has been found to have a strong effect on the sexual and reproductive health experiences of female adolescents in Nairobi’s slums (Ngom et al., 2003). Ethnicity may capture the different cultural backgrounds which may influence the way people of a given cultural set-up interpret their health since different ethnic groups have different cultural values (Caldwell, 1993; Panel on Research Agendas, 2001). Religious affiliation has been found to be associated with mortality (Hummer et al., 1999) but operating through health selectivity, social ties and behavioural factors while household wealth may lead to purchase of better health (Smith, 1999). Indulgence in deviant behaviour, being physically abused, and accessibility of medical care are not only pertinent to current adolescent health but may also determine future health status. Results Respondents’ Background Characteristics Table 1 gives the mean and percent distribution of respondents by selected background characteristics and by sex. On average, male teenagers had significantly more years of schooling (p<0.01) than female respondents. They were also significantly more likely to report the presence of the mother in the household (p<0.05), fair/poor health (p<0.01), deviant behaviour (p<0.01) and being physically abused by anyone (p<0.05) in the year preceding the survey than their female counterparts. However, the two groups did not significantly differ from each other in terms of the other characteristics such as average age, average number of illnesses experienced in the year preceding the survey, ethnicity, religious affiliation, and access to medical care when needed in the year preceding the survey. Table 1: Distribution of respondents by various characteristics and by sex, NCSS 2000
Notes: aIncludes categories grouped together because of the small number of cases; bDK- don’t know: means that the respondent did not know whether the mother or father was alive; cSignificance tests for differences between male and female respondents: *p<0.05; **p<0.01; ns- not statistically significant; dPercentages may not add up to exactly 100 in some cases due to round-off error. Logistic Regression Analysis Results from logistic regression models (Models 1 and 2) that do not take into account unobserved characteristics are shown in Table 2 for male and female respondents. There are some differences between male and female respondents with respect to factors associated with reporting good health. First, more years of schooling were significantly associated with higher likelihood of reporting good health for male (p<0.05) but not female respondents. Second, there were some significant differences in reporting good health by ethnicity, religious affiliation, household wealth, and access to medical care when needed for male but not for female teenagers. Third, absence of the father in the household was significantly associated with lower likelihood of reporting good health for male respondents (p<0.01) but with a higher likelihood of reporting the same for their female counterparts (p<0.05). Fourth, absence of the mother in the household and having experienced physical abuse in the past year prior to the survey were significantly associated with lower likelihood of reporting good health (p<0.05 in each case) for female but not for male respondents. Table 2: Coefficient estimates from logistic regression models that do not take into account unobserved characteristics that may be correlated with self-assessed health, NCSS 2000
Notes: S.E.- standard error; ref- reference category; aIncludes categories grouped together because of the small number of cases; bDK- don’t know: means that the respondent did not know whether the mother or father was alive;*p<0.05; **p<0.01. For both male and female respondents, however, the number of illnesses experienced in the twelve months preceding the survey was significantly associated with self-reported health status. But the significant coefficients for the quadratic term imply that the relationship is not linear. For a better interpretation of these relationships, coefficient estimates (β') for given percentiles of reported number of illnesses were computed based on equation (2) and transformed into percent chance of reporting good health based on equation (3). The results for Models 1 and 2 are shown in columns 2 and 4 of Table 4 for male and female teenagers respectively. A male teenager who experienced no illness in the year preceding the survey, for instance, had a 42% higher chance of reporting good health; this figure was 76% for a female teenager with no illness. Similarly, while a male teenager experiencing the maximum number of illnesses had a 47% lower chance of reporting good health, the female counterpart’s chance of reporting good health was 67% lower. Nonetheless, as already noted, these results ignore the hierarchical nature of the data and the potential effects of unobserved characteristics at each level of hierarchy that might also be correlated with self-assessed health status. Multilevel Analysis To examine if taking into account unobserved characteristics that might be correlated with self-assessed health status makes a difference, Table 3 presents the results from the multilevel logistic regression models (Models 3 and 4) for male and female respondents. There are some notable changes with respect to the results for male teenagers (Model 3). For instance, years of schooling and household wealth are not significantly associated with reporting good health as was the case in Model 1. Similarly, some differences by ethnicity (e.g. between Luhya and Kikuyu) and religious affiliation (i.e. between Other Christian and Catholic) cease to be significant. But absence of the father in the household and access to medical care when needed remain significantly associated with lower likelihood of reporting good health for male respondents. For female teenagers, however, except for small changes in the magnitude of the coefficients, the results (Model 4) remain similar to those in Model 2 in terms of the direction of association and statistical significance. Thus, taking into account unobserved characteristics that might be correlated with self-assessed health status makes some difference in the qualitative conclusions for male but not for female respondents. Table 3: Coefficient estimates from multilevel logistic regression models that take into account unobserved characteristics that may be correlated with self-assessed health, NCSS 2000
Notes: S.E.- standard error; ref- reference category; aIncludes categories grouped together because of the small number of cases; bDK- don’t know: means that the respondent did not know whether the mother or father was alive; *p<0.05; **p<0.01. The percent chance of reporting good health for given percentiles of reported number of illnesses based on Models 3 and 4 is shown in columns 3 and 5 of Table 4. There are two important observations to make from these results. First, at the lower and upper ends of the distribution of the number of illnesses reported, there are huge differences between models in the percent chance of reporting good health for male teenagers while the differences for female teenagers are modest. This implies that taking unobserved characteristics into account not only makes some huge difference in the qualitative but also in the quantitative conclusions for male but not for female teenagers. Second, there is some form of cross-over in the absolute magnitude of the percent chance of reporting good health between male and female respondents on the basis of Models 3 and 4. At the lower end of the distribution, the percent chance of reporting good health for male teenagers is larger in absolute magnitude than that of their female counterparts. The opposite is the case at the median and upper ends of the distribution. Thus, despite the fact that male teenagers were on average significantly less likely to report good health compared to their female counterparts (see Table 1), they were more likely than the female teenagers to report good health if fewer than the median number of illnesses were reported (Table 4). Similarly, in absolute terms, female teenagers were more likely than their male counterparts not to report good health if the median or more number of illnesses were reported. Table 4: Percent chance of reporting good health for teenagers experiencing a given number of illnesses in the year preceding the survey, NCSS 2000
Notes: Words in parenthesis indicate whether the chance of reporting good health is lower or higher for a respondent who reported the given number of illnesses; Percentile distribution of illness counts was similar for males and females. Discussion Studies of self-assessed health in the developing world in general and among teenagers in particular have received little attention in the literature. Possible explanations for this could be the lack of relevant data, concerns with the quality of data from settings where contact with the medical personnel may be limited, as well as the belief that teenage self-rating of health may not be as optimistic as those of adults or the elderly population. This study examined the factors associated with self-assessed health status among teenagers in Nairobi’s slum settings with emphasis on the number of illnesses experienced in the past year prior to the survey. Several findings emerge from it. First, there was a significant association between prior morbidity experience and self-assessed health, but the association is non-linear. In particular, both male and female teenagers who did not experience any illness during the past year were more likely to report good health while those who had experienced the most number of illnesses were less likely to rate their health as good. This suggests that even for teenagers in this low-income setting, self-assessed health status might have been based on their morbidity experiences in the last twelve months preceding the survey. It implies that interventions targeting adolescent health need not concentrate only on reproductive health as has been the case, but also on other aspects of health such as physical and mental health status. Second, there was a gender dimension to self-assessed health status which at face value seems to run contrary to what has been observed elsewhere for the elderly. On average, female teenagers were significantly less likely to report fair or poor health compared to their male counterparts. This might appear contrary to studies among elderly persons which show that women are more likely to report poor health than men though such reports do not predict subsequent mortality for them as they do for men (Benyamini et al., 2000; Sadana et al., 2002; Case and Deaton, 2003). But further analysis of the association between prior morbidity experiences and self-assessed health status revealed the intricate nature of these differences. Specifically, compared to male teenagers, female teenagers were less likely to report good health when fewer than the median number of illnesses were reported. At the same time, they were more likely in absolute terms than their male counterparts not to report good health if they experienced the median or more illnesses in the past year. Thus, while the conclusion based on the average gender differences might be misleading, the detailed findings conform to expectations. This suggests that similar to the findings for elderly women (Benyamini et al., 2002; Case and Deaton, 2003), female teenagers might be more inclusive in their assessment of health status than their male counterparts. The third finding from this study is the role of parental presence on the respondents’ self-assessed health status. The finding itself is not new given that a prior study (Ngom et al. 2003) had shown that the presence of the father in the household had a strong effect on the sexual and reproductive health experiences of female adolescents in these settings. What is new is the gender dimension to parental presence. In particular, the absence of the father was significantly associated with lower likelihood of reporting good health for male teenagers while for female teenagers, it was the absence of the mother. Also worth noting is that the absence of the father was still significantly associated with higher likelihood of reporting good health among female teenagers. This might seem contrary to the finding by Ngom et al. (2003) that the father’s presence in the household was associated with lower likelihood of being sexually active and of experiencing unwanted pregnancies among female adolescents in the study settings. However, it could also be that the father’s presence matters for reproductive health experience but not for self-assessed health status which encompasses various aspects of health including physical and mental health. This implies that besides adopting an all-inclusive approach to adolescent health (reproductive, physical, mental), intervention programs need also to take into account the differences between male and female adolescents in different household structures. Finally, female teenagers who had experienced physical abuse in the year prior to the survey were less likely to report good health compared to those who did not experience such abuse though this does not hold for male teenagers. Such physical abuse included being hit, slapped or kicked by anyone and does not include coerced sex. This suggests that adolescent health interventions for young girls in the region need to target reducing not only sexual violence but also all forms of violence. For male teenagers, those who received medical care whenever they needed it in the year preceding the survey were less likely to report good health than those who did not or never needed care. This could be an indication that such access made them more aware of their health status or it could itself be an indication of ill-health. Whatever the case, it reinforces the suggestion that adolescent health interventions in the region need to target all aspects of health. This study has a number of limitations, the major one being the cross-sectional nature of the data. This means that we can only determine the association, for instance, between morbidity experiences and self-assessed health status. But whether self-assessed health predicts morbidity experiences or morbidity experiences predict self-assessed health for this segment of the population is an issue which can best be examined through longitudinal studies. Nonetheless, the results suggest that such studies are likely to determine the strong relationship between self-assessed health and subsequent morbidity and mortality in these settings as has been observed for the developed world. Furthermore, if concern with the reliability of self-assessed health measures obtained from low-income settings is one of the issues driving the dearth of similar studies in the region, then these results suggest that such concerns might be unwarranted. The second limitation of the study is that the results apply to teenagers residing in a low-income urban setting and may or may not be applicable to middle- and high-income urban settings or to rural areas. Notes:
References
© Copyright 2007 - Union for African Population Studies | |||||||||||||||||||||||||||||||||||||||||||||||||||||||||||||||||||||||||||||||||||||||||||||||||||||||||||||||||||||||||||||||||||||||||||||||||||||||||||||||||||||||||||||||||||||||||||||||||||||||||||||||||||||||||||||||||||||||||||||||||||||||||||||||||||||||||||||||||||||||||||||||||||||||||||||||||||||||||||||||||||||||||||||||||||||||||||||||||||||||||||||||||||||||||||||||||||||||||||||||||||||||||||||||||||||||||||||||||||||||||||||||||||||||||||||||||||||||||||||||||||||||||||||||||||||||||||||||||||||||||||||||||||||||||||||||||||||||||||||||||||||||||||||||||||||||||||||||||||||||||||||||||||||||||||||||||||||||||||||||||||||||||||||||||||||||||||||||||||||||
| |||||||||