 |
| About Bioline | All Journals | Testimonials | Membership | News |
|
||||||
|
||||||
African Population Studies/Etude de la Population Africaine, Vol. 22, No. 2, 2007, pp. 205-231 Working Life Tables for South Africa, 1996-2001 Martin E. Palamuleni Population Training and Research Unit, North West University, Mafikeng Campus, Private Bag X2046, Mmabatho 2735, South Africa Email: palamulenim@uniwest.ac.za Code Number: ep07017 Abstract This paper presents the results of the construction of a working life tables for males and females in South Africa using the 1996 and 2001 population censuses. The main objective of the paper is to illustrate the use of life table analysis in the examination of the labour force using South African data. The study indicates that based on the 1996 census a South African male who survives to age 15 is expected to live 40.9 years, out of which 35.3 years are expected to be spent in active status and the remaining 5.3 years in inactive years. Similar values for South African females are 49.9 years, 37.9 years and 12 years, respectively. Using 2001 census the study indicates that a South African male who survives to age 15 was expected to live 43.9 years of which 36 years will be in active and 8 years will be inactive whereas a South African female was expected to live 50 years of which 34 years will be active and 16 years will be inactive. It was estimated that out of the total number of males who left the working population in 1996, 50 percent left because of death and another 50 percent left for other reasons other than death. The corresponding figures for females are 28 percent and 62 percent respectively. In 2001, 64 percent of the males left the labour force due to deaths whereas 36 percent left due to other causes. Similar figures for females are 45 percent and 55 percent respectively. These figures suggest an increased proportion of men and women are leaving the labour force due to deaths. This means that mortality takes a heavy toll of the seemingly short economically active life. Probably, this is a reflection of the devastating impact of HIV/AIDS on the working population. Key words: labour force, unemployment, life tables, working life tables, South Africa Introduction The life table is one of the most powerful tools in demography (Burch, 2003; Shyrock and Siegel, 1973). Although life tables are traditionally designed to measure mortality experience of a population, various scientists employ them in a variety of ways. For instance, life tables are used by health workers, demographers, actuaries, and many others in studies of longevity, fertility, migration, and population growth, as well as in making projections of population size and characteristics and in studies of widowhood, orphan hood, length of married life, length of working life, and length of disability free life. In its simplest form, the entire life table is generated from age-specific mortality rates. In recent times, there has been an interest in applying the life table approach to study various aspects of the demography of South Africa. Mba (2003) has used life tables to analyse the impact of external causes of death on expectation of life at birth, whereas Bah (2005) has employed it to study the multiple causes of deaths in the country. In this paper we use the life table concept in the study of the labour force dynamics in South Africa. In particular, the main objective of this paper is to calculate working life tables for males and females in South Africa in 1996 and 2001[1]. Among other functions, working life tables can be used to study labour force attrition and replacement (United Nations, 1971). These tables can help make assessment of future trends of labour force more accurately; as such they are useful in making assumptions for the economically active population especially in the extreme age groups which are the most unstable. Therefore, the information from working life tables is very useful for manpower planners and policy makers in planning for labour force replacement and designing appropriate policies for retirement age respectively. Employment situation in South Africa Unemployment in South Africa is surprisingly high and rising. Unemployment rate has increased from 31% in 1993 to 38% in 1998 and to 42% in 2002 on the broad definition[2]. Similar rates for the narrow definition are 13%, 26% and 31% respectively (Kingdon and Knight, 2002). Estimates based on 1996 and 2001 population censuses also show a similar trend. Other studies favour the use of the broad definition because it is conclusive (Kingdon and Knight, 2002). Consequently, this study uses the broad definition of unemployment. Applying the broad definition, unemployment rate has increased from 34% in 1996 to 49% in 2001. Several factors have been suggested as influencing high and rising unemployment in South Africa (Kingdon and Knight, 2002). These include the aftermath of the discriminatory policies of the apartheid regime to the negative consequences of globalization (Department of Social Development, 2001). However, one thing that comes out clearly is that to understand the nature and patterns of unemployment in South Africa one has to appreciate the social and economic history of the country. The high unemployment in South Africa could be understood from a historical perspective. For instance, as a result of the 1913 and 1936 Land Acts, African ownership was restricted to only 13% of South Africa's land area, thus considerably limiting the opportunities for African farming and creating the migrant labour system. Shortly after taking power in 1948, the National Party government passed the Group Areas Act, enforcing separate residential areas, and the Population Registration Act. In 1953 came the Bantu Education Act, providing "separate education, with a built-in inequality". This was followed by the 1956 Industrial Conciliation Act, which "included the principle of job reservation, that is special jobs reserved for whites." As Davies et al. (1984:31) have written, 47% of Africans lived in Bantustans in 1970 and the majority of the latter, "were unemployed proletarians, forced by apartheid to live there, rather than peasants reproducing themselves in rural production." Furthermore, apartheid limited "the black petty bourgeoisie" and structural changes in the economy had resulted in more unemployment, so that in the early 1980s this number had risen to around three million because of mass expulsions to the Bantustans and agricultural and industrial mechanisation (Davies et al.,1984:30). According to Brown (1987), the mechanisation of agriculture contributed to soaring unemployment, which in turn prompted the establishment of a national family planning programme in 1974. Unemployment remains a matter of serious concern in South Africa - for its effects on economic welfare, production, erosion of human capital, social exclusion, crime, and social instability. Data Sources and Methods The data for this analysis have been taken from the results of the 1996 and 2001 census data. Two sets of data have been exploited in this paper, namely mortality and economic activity data. First, for mortality data, we have relied on the 1996 and 2001 life tables South African life tables. The 1996 life tables were published by Statistics South Africa (2000) whereas the 2001 were supplied by Sulaiman Bah[3]. In general terms, the life tables utilised in this study are based on the responses to the question “deaths in the household in the last 12 months”. The following is how the question was phrased in the 2001 census:
Studies reveal that these data are distorted in many ways that they cannot be relied at face value (Statistics South Africa, 2000; Dorrington, Moultrie and Timaeus, 2004). Some of the problems encountered include wrongful wording, underreporting of deaths, age misstatements, (Dorrington, Moultrie and Timaeus, 2004) As such the final life tables calculated are based on appropriate adjustments[4]. Second, in both the 1996 and 2001 South African population censuses collected some information on economic activity for a person aged 15 years and over. The concepts and definitions employed in collecting such data on the economically active population were based on recommendations of the United Nations secretariat, with some modifications to suit local conditions. From the point of view of this study, the population aged 15 years and over was divided into two broad categories as follows: those who were economically active and those who were economically inactive. According to the 1996 census, the economically active population is generally understood to comprise all those persons who contribute to the supply of labour for the production of economic goods and services including not only those employed at the time of the census or survey, but also those unemployed but available for work. In South Africa, economically active person was defined as a person aged 15 years or more who is either employed or unemployed but who is looking for work. On the one hand, an employed person refers to “a person who works for pay, profit or family gain”; on the other hand, employment means working for pay, profit or family gain. The term covers formal work for a salary or wage in a business, or a business establishment which has a value added tax (VAT) number, as well as informal work such as making things for sale or selling things or rendering a service in an establishment which has no VAT number. The term (employment) also covers work on a farm or the land, whether for a wage or as part of the household’s farming activities. In so far as working life tables are concerned the economically active population defined above is taken as equivalent to the working population. Construction of the working life tables The data summarized in the preceding section were used to estimate working life tables for South Africa under certain conditions. The procedure followed in this paper is based on the classical method of calculating ordinary working life tables and involves the following three steps. First, life tables were obtained. Second, labour force participation rates (also known as Age specific activity rates) were calculated. These are denoted as nnx. This step involves the calculation of the proportion of the working population to the total population in various age groups from age 15 years onwards. Third, appropriate functions of the estimated life tables were combined with the labour force participation rates to derive working life tables. The approach described above suggests that the construction of the working life table is essentially based on the working population and labour force participation rates. These rates are obtained by dividing the working population by the total population in each age group. Table 1 below illustrates the calculation of labour force participation rates using data obtained from 2001 census. Unfortunately, not all entrants to the labour force enter at the same age. If the working population at each age group is based on the actual proportion working at that group, the man-years of work per generation may be rightly calculated, and for some purposes such as international comparative studies this may be enough. However, for purposes of estimating the expected years of working life and retirement at each age group this actual proportion cannot be used. The reason for this is that at age below that at which the last entrants enter, the total working life of the generation includes work of those yet to enter. This problem may be overcome by employing at the age groups when all entrants have not yet entered, not the actual proportion working, but the maximum value of this proportion attained in the other age groups. This hypothetical proportion may be interpreted as the proportion who have entered or are training for employment. These are denoted nW1x as in Table 1 below. The hypothetical proportions relate to the number of working person who have reached their xth birthday but have not yet reached their x+5th birthday. For the purpose of computing the working life table, it is essential to obtain proportions which can be related to the xth birth day. These proportions are calculated using the following relationship: nWx = ½ (nW1x + nW1x-n) Table 1 Actual and hypothetical percentage of the working population for South Africa, 2001
The nWx values, together with the lx, nLx and ex values of the ordinary life tables, form the basis of computing the various functions of a working life table. The calculated working life tables for South Africa by sex for 1996 and 2001 are given in Tables 2, 3, 4 and 5 below. The derivation and meaning of the functions of the various columns of a working life table are described in Appendix A. The procedure described above has been found appropriate for the construction of ordinary working life tables and a number of researchers have employed this approach (Kpedepo, 1969a, 1969b; Iro, 1976; Krishnan, 1977; Misiku, 1993). Other researchers have subsequently expanded the approach and come up with methodologies to generate generalised multiple-decrement tables (Schoen and Woodrow, 1988; Schoen, 1988). Unfortunately multiple-decrement tables require data that are not readily available especially in developing countries. As such only the basic work life table for South Africa has been calculated in this study. The working life tables constructed using the approach described in the preceding paragraphs are based on the following assumptions:
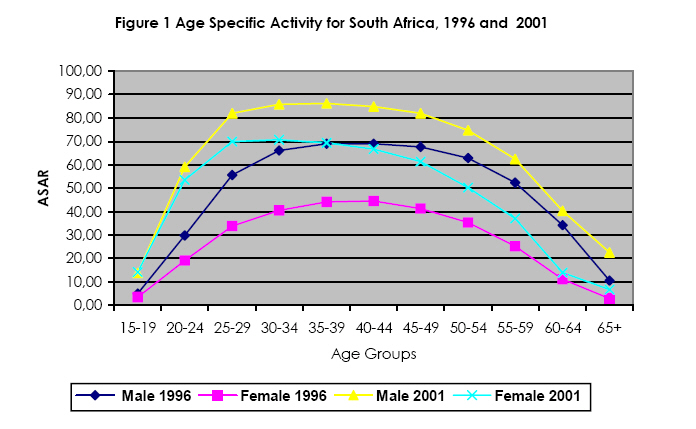
Results According to the 2001 census there were 8706447 male and 7701378 female workers in South Africa. The crude activity rates (CAR) for males and females are computed as 64 and 52 percent, respectively. The results highlight that CAR of male is 12 percent point higher than CAR for female. Similar rates for 1996 were 53 for male and 54 for female. Since crude activity rates are not meaningful, age specific activity rates were calculated and these are presented in Table 1 and Figure 1 below. The age pattern of both male and female activity rates is uni-modal. The age specific activity rates for males start from a low value in age group 15-19, then increase with rising age groups up to 35-39 declines gradually reaching a low value in age group 60-64. For females the age specific activity rates follow more or less the same pattern but reach a maximum in 30-34 age group. For all age groups, age specific activity rates for females are lower than those of males. The age pattern of activity rates described in the preceding paragraph contrast with studies in developed countries especially the United States of America which indicates a bi-modal pattern for females (Schoen and Woodrow, 1980). Furthermore, Shyrock and Siegel (1976:268) noted that “the construction of working life tables presents some special problems because of the more irregular age pattern of economic activity of women”. These observations appear to have influenced researchers either to calculate working life tables for the male population only (Schoen and Woodrow, 1980;) or to publish the working life tables for each sex separately (Kpedepo, 1969a, 1969b) The estimated working life tables for South Africa for 1996 and 2001 are presented in Tables 2 to 5 below. Table 2 shows the length of working life for males in South Africa in 1996. It is observed from the table that the expectation of economically active life at age 15 for males was 35.3 years and it gradually decreased to 3.8 years in the last age group. Similarly, the expectation of economically active life at age 15 for females was 37.9 years and it gradually decreased to 3.7 years in the last age group (see Table 3). It is also clear from Table 2 that a South African male who survives to age 15 is expected to live 40.7 years, out of which 35.3 years are expected to be spent in active status and the remaining 5.3 years considered as inactive years. Similar values for females are 49.9, 37.9 and 12 years respectively. Table 4 shows the length of working life for males in South Africa in 2001. It is observed from the table that the expectation of economically active life at age 15 for males was 34.5 years and it gradually decreased to 3.9 years in the last age group. It is also clear from the table that a South African male who survives to age 15 is expected to live 43.9 years, out of which 34.5 years are expected to be spent in active status and the remaining 9.4 years considered as inactive years. In case of females, the expectation of economically active life at age 15 was 32.6 years and it gradually decreased to 3.6 years in the last age group (see Table 5). A South African female who survives to age 15 is expected to live 49.7 years, out of which 32.6 years are expected to be spent in active status and the remaining 17.1 years considered as inactive years. It can also be noted that the length of working life is higher in all age groups for males than females. This is because generally males have higher labour force participation rates than females and that is why they have longer length of working life. One practical use of the working life table is the estimation of the annual losses from the actual working population based on the assumptions that the population is subjected to the age specific death rates and the age-specific activity rates used to construct the working life tables. For a country like South Africa where mortality is increasing as a result of HIV/AIDS, one would expect work life being cut short by the force of mortality. In order to estimate the loss due to mortality, we have calculated the gross years (ie mortality free) of active life. The multiplication of the rates of nmsx and nmwx in the various age groups by the actual number of men in the working population in the corresponding age groups will give the total losses, the losses due to death and the losses due to other causes other than death. Computations based on the actual working population enumerated in 1996 and 2001 population censuses have been made and these are presented in tables 6 and 7 below respectively. Table 6 Working Population and its estimated losses by age group, South Africa, 1996
Table 6 indicates that the total number of males estimated to have left the working population in 1966 was 153518 of which 96322 (or 63%) left on the account of death and 57196 (37%) left due to other causes. Similar figures for the female population indicate that 80115 females left the working population of which 30537 (38%) left on the account of death and 49577 (62%) left due to other causes. Table 7 Working Population and its estimated losses by age group, South Africa, 2001
The total number of males estimated to have left the working population in 2001 was 199220 of which 127900 (64%) left on the account of death and 69558 (36%) left due to other causes. Similar figures for the female population indicate that 187858 females left the working population of which 85314 (45%) left on the account of death and 102545 (55%) left due to other causes. Furthermore, Table 8 indicates that mortality is the major factor affecting the exit from the Labour force for males for both 1996 and 2001 census. In 1996 63 percent of the males left the labour force due to deaths. A similar percentage was 64 percent in 2001 suggesting that relatively more males are now leaving the labour force as a result of deaths than was the case before. On the other hand, females leave the labour-force due to other causes. The results indicate that 62 percent of the females who left the labour-force in 1996 were due to other causes. The percentage of the women leaving the labour force due to other causes has declined to 55% in 2001. Probably this is a reflection of increasing importance of deaths as a factor affecting exit from the working population. Table 8 Comparison of estimated losses from male and female working population in South Africa, 1996 and 2001
Length of Working Life by Sex and Population Group There are significant differentials in the length of working life by population group. Table 9 presents length of working life by sex and population group for South Africa[5]. The length of working life is highest among the white population followed by the Asian population then the coloured population and lowest among the African population. The same pattern is also observed in the length of inactive years. Overall, for all population groups with the exception of the African population, the length of working life for males is higher than that of females. The African population indicate that the length of working life for females is slightly higher than that of males. The Asian population reveal the largest difference between the length of working life for males and females. Table 9 Estimates of Length of Working Life by Sex and Population Group, South Africa, 2001
Comparisons with other countries A comparative picture of the situation in South Africa with those in some countries would help us know the relative standing of the economic powerhouse on the continent. The data on work life expectancy for selected countries are shown in Table 10. However, it should be noted that data was collected in different years using not only different definitions of economically active population but also reference periods. As such caution must be taken when dealing with such information. Notwithstanding the aforementioned challenges, comparison of the working life expectancy for South Africa and selected African countries is still enlightening. First, most of the estimates presented in Table 10 are for earlier periods. Second, as expected, given higher labour force participation rates, the length of working life for males is higher than that of female. The largest differences are observed in countries with a large proportion of Muslims (Sudan and Somalia). Third, comparing estimates for Malawi 1998, Zimbabwe 1996 and South Africa 1996, which more or less refer to the same time period, one notices that working life expectancy at age 15 for male is highest in Zimbabwe, then Malawi and lowest in South Africa. Female working life expectancy follows the same pattern expect that the value for Malawi is more or less the same as that of South Africa. The high ewx for Malawi and Zimbabwe could be a consequence of high labour force participation rates probably arising from high number of people involved in agricultural activities. Life expectancy for the inactive years is highest in South Africa and Zimbabwe and lowest in Malawi and overall einx for females are higher than that of males. Table 10 Expectation of working life for selected countries by sex
Conclusion The study has calculated working life tables for South Africa using 1996 and 2001 census data. The study indicate that based on the 1996 census a South African male who survives to age 15 was expected to live 40.9 years, out of which 35.3 years are expected to be spent in active status and the remaining 5.3 years considered as inactive years. Similar values for South African females are 49.9 years, 37.9 years and 12 years, respectively. Furthermore, using 2001 census the study indicates that a South African male who survives to age 15 was expected to live 43.9 years of which 36 years will be in active and 8 years will be inactive whereas a South African female was expected to live 50 years of which 34 years will be active and 16 years will be inactive. Furthermore, the study has shown that most men who leave the labour force do so as a result of mortality whereas most women leave the labour force as a result of other factors rather than mortality. For both male and females there is an increase in the proportion leaving the labour force attributable to deaths. This is probably an indication of the impact of HIV/AIDS. Future research can replicate this work using data from demographic surveys especially the labour force surveys whose information of employment can be deemed more reliable than the ones collected in population censuses. In this regard it is also expected that data collected in the labour force surveys may allow the calculation of multiple-decrement which in certain quarters are deemed more accurate than the simple working life tables presented in this study. Lastly, an additional issue that can be considered is the analysis of the policy implications of the findings. The observation that an increasing proportion are leaving the labour force due to death, probably arising from HIV/AIDS, re-enforces the need for work-based HIV/AIDS programmes and activities. In this regard, organisations that have not yet conducted needs assessment and drafted HIV/AIDS strategic framework for their organisations will be encouraged to do so now. The finding that most females leave the labour force as a result of factors other than mortality should stimulate interest to identify these factors. If it is established that females leave the labour force because of marriage, childbearing and child rearing, then efforts should be made to make the working environment conducive to women who want to further their careers at the same time maintain their traditional roles as wives and mothers. One means of achieving this is to ensure that crèche facilitates are available in all institutions. Reference
Appendix 1: Derivation and meaning of the functions of the various columns of a working life table.___________________________________________________________________ Column (1): This shows the conventional five-year age groups from 10 to 60 years and over. Column (2), lx: This refers to the number of survivors to age x out of the original birth cohort. Column (3), ex: This refers to the average number of years individuals aged x are expected to live if they experience the given age specific death rates upon which the life table is based. Column (4), nWx: Age specific activity rates at the beginning of the age interval. Column (5), lwx: Survivors at exact age x out of 100000 born alive and active and was obtained as a product of columns (2) and (4) divided by 100. In other words, the figures are obtained by multiplying Wx by corresponding lx. Thus lwx = nWx lx Column (6), nLwx: This is the stationary economically active population in the age interval. On assumption that the withdrawal from the working population is uniformly distributed, nLwx = 0.5(lwx+lwx+5) Column (7), Twx: This represents the economically active person years that would be lived after age x by members of a hypothetical cohort. It was obtained by cumulating column (6) from the bottom. Column (8), ewx : It refers to the average number of economically active years expected to be lived per person in the hypothetical cohort at birth and among survivors at each age. It was computed by dividing column (7) by column (5). Thus ewx = Twx/ lwx Column (9), einx: This column refers to the average number of economically inactive years expected to be lived per person by a hypothetical cohort at birth among survivors at each age x and is computed by simply subtracting column (8) from column (3). einx = ex - ewx Column (10), nSwx: This refers to the net change of those entering or leaving the labour force and is obtained by utilising column (5) using the following relationship lwx - lwx+5. For the extreme age groups “15-19” and “65+”, survivors in age group “15-19” and those in last age group were taken as S(xw) values, respectively. Column (11), nEx: This refers to the rate of entry or exit from the labourforce and is obtained by dividing column (10) by column (6) and multiplying the results by 1000. That is, nEx = nSwx/ nLwx. Column (12), ndwx: This indicates the number of people dying in the age interval x to x+n. This is based on assumption that the death rate in the working population is the same as in the total population. The death rate in the later population is equal to ndx/nLx and this is multiplied by the working population, nLwx. Thus ndwx = ndx/nLx nLwx Column (13), nRwx: This indicates the number of people leaving the labourforce in the age interval x to x+n. This is calculated as column (10) minus column (12). That is, nSwx – ndwx. Column (14), nrwx: It is the age-specific rate of retirement per 1000 active individuals and is computed by I(x) = column (14) divided by column (7) multiplied by 1000. [1]Working life tables are also known as “tables of working life”. In this study the two terms are used interchangeably. [2]The narrow definition counts as unemployed only those jobless persons who actively searched for work in the previous four weeks while the broad definition also includes those that say they want work, even if they did not actively search. [3]Dr Sulaiman Bah is a Statistician/Demographer currently working with MEDUSA. He was previously working for Statistics South Africa in the Vital Statistics Section. He has written extensively on mortality issues including life tables in South Africa. [4] Those interested in these errors and how adjustments was done should refer to relevant reports, Statistics South Africa (2002) and Dorrington, Moultrie and Timaeus (2004). [5] Working Life Tables for each sex and population group are available from the author on request. © Copyright 2007 - Union for African Population Studies The following images related to this document are available:Photo images[ep07017f1.jpg] | ||||||||||||||||||||||||||||||||||||||||||||||||||||||||||||||||||||||||||||||||||||||||||||||||||||||||||||||||||||||||||||||||||||||||||||||||||||||||||||||||||||||||||||||||||||||||||||||||||||||||||||||||||||||||||||||||||||||||||||||||||||||||||||||||||||||||||||||||||||||||||||||||||||||||||||||||||||||||||||||||||||||||||||||||||||||||||||||||||||||||||||||||||||||||||||||||||||||||||||||||||||||||||||||||||||||||||||||||||||||||||||||||||||||||||||||||||||||||||||||||||||||||||||||||||||||||||||||||||||||||||||||||||||||||||||||||||||||||||||||||||||||||||||||||||||||||||||||||||||||||||||||||||||||||||||||||||||
| |||||||||