 |
| About Bioline | All Journals | Testimonials | Membership | News |
|
||||||
|
||||||
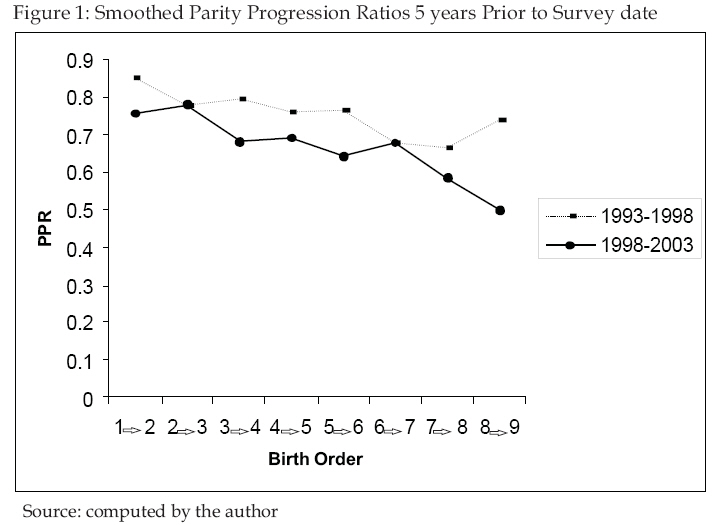
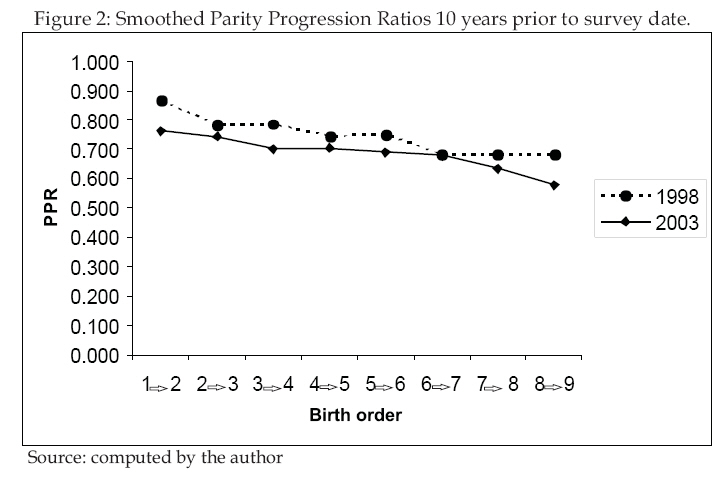
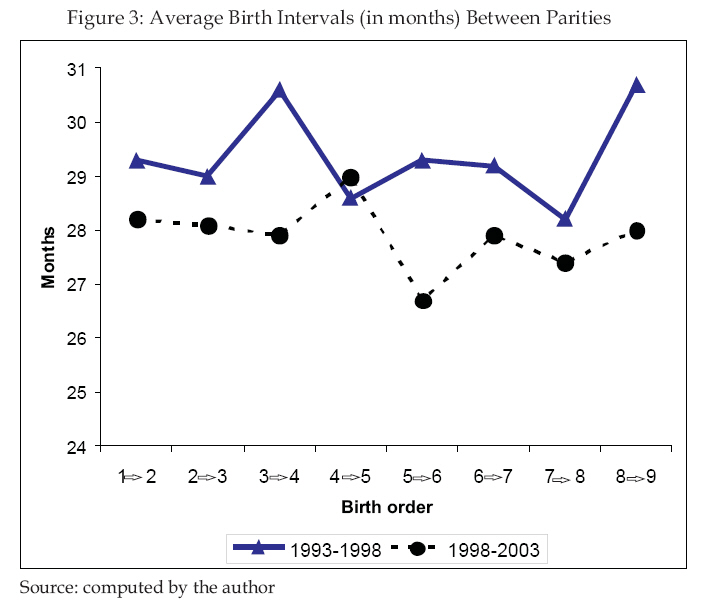
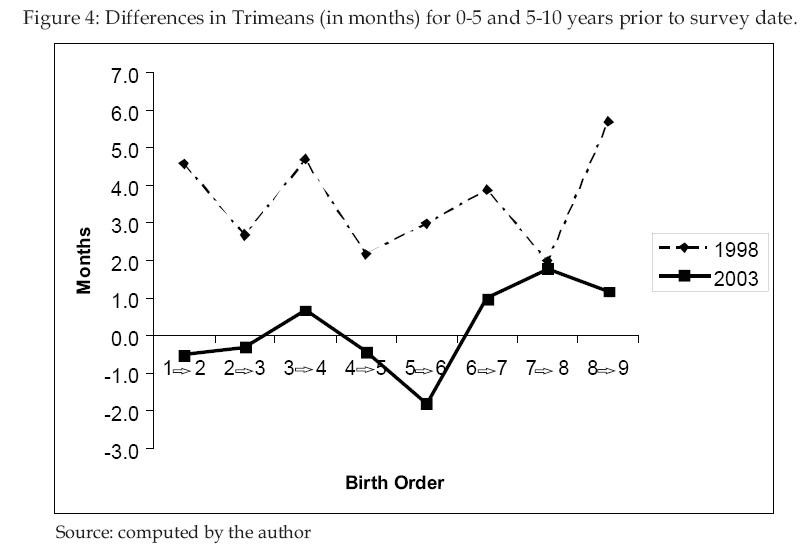
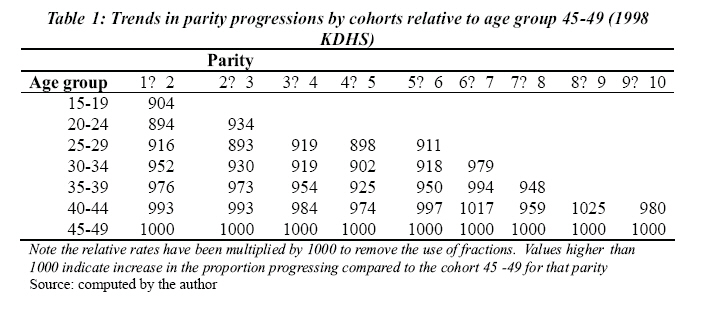
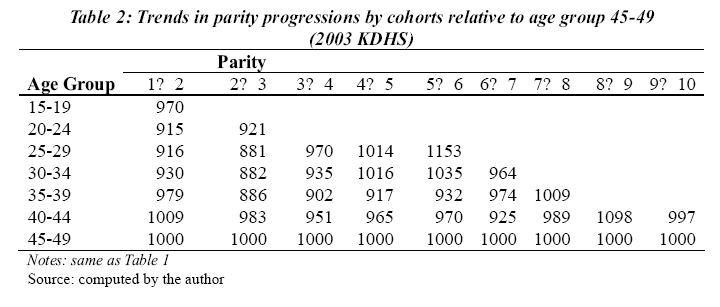
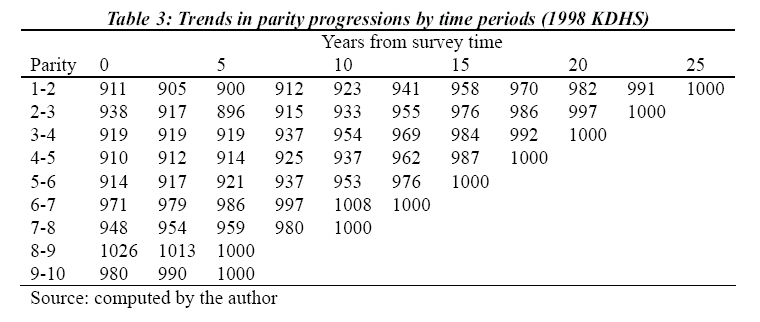
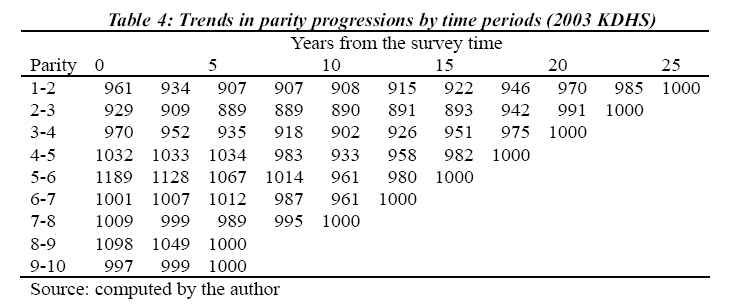
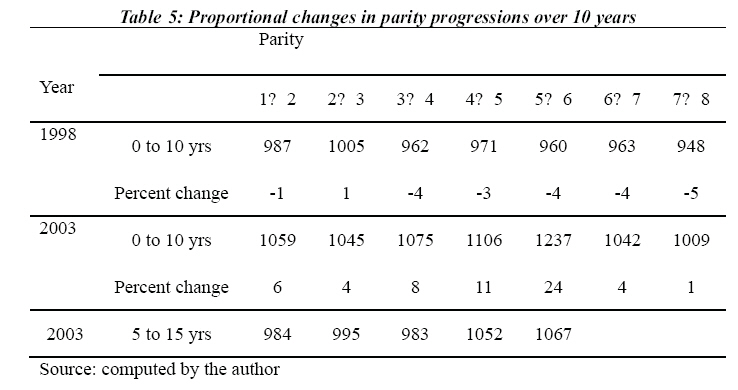
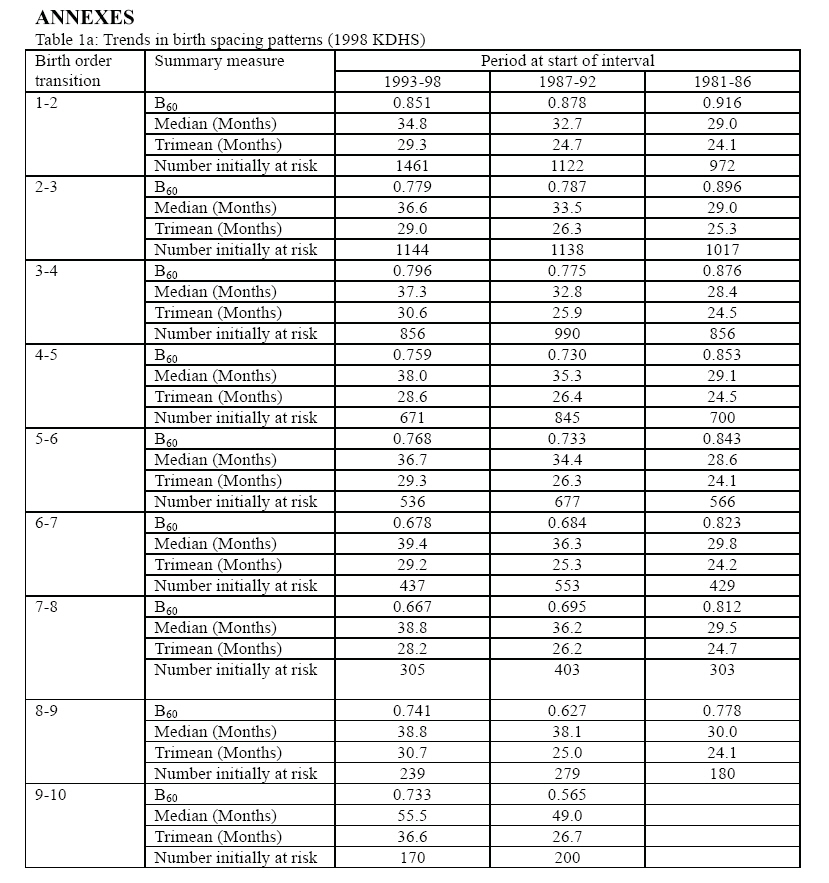
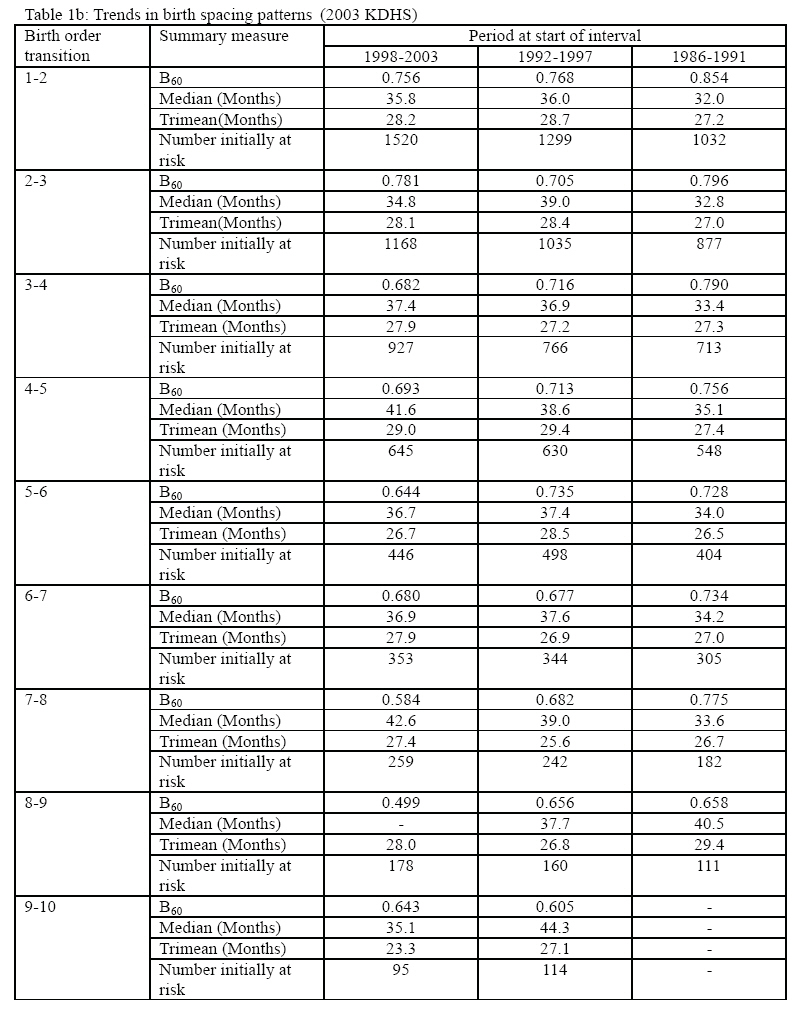
African Population Studies, Vol. 23, No. 2, 2008, pp. 141-154 Analysis of Family Building Patterns in Kenya when Fertility has Stalled Alfred Agwanda Otieno Population Studies and research Institute, University of Nairobi Code Number: ep08008 Abstract The absence of any further fertility decline in Kenya in recent past has alarmed the demographic community. While such phenomenon is not new, it is also possible that the observed fertility as measured by TFR may be due to flaws in the in distortion of TFR from changes in the timing of childbearing. On the other handWhile, there may have been a real reversal in fertility decline that could arise from change in fertility preferences. However, tracing fertility trends by traditional measures (such as TFR) in early stages of demographic transition is speculative and uncertain even if data is of good quality. This study uses birth history data from the 1998 and 2003 KDHS to examine trends in family building patterns. The main conclusion is that fertility rates increased among women in their middle age (25-34) for those in parities 4 and 5 but declined for both younger and older women. From a methodological perspectives, the use of parity progression ratios uncovers patterns that may be difficult with the use of age- specific fertility rates. Parity Parity-specific analysis is consistent with the sequential nature of childbearing and approximates the family-building behaviour of real cohorts. Résumé L'arrêt du déclin de la fécondité ces dernières années au Kenya alarme la communauté des démographes. Bien que ce phénomène ne soit pas nouveau, il est aussi possible que les tendances de fécondité telle que mesurée par l'indice conjoncturel de fécondité (ICF) soit affectées par des distorsions dans le calendrier des grossesses. Bien qu'il soit possible que le renversement de tendance soit dû à un changement réel des préférences en matière de fécondité, repérer les tendances de la fécondité par des indices classiques (tel que l'ICF) dans les premiers stades de la transition démographique est un exercice spéculatif et incertain, même si les données sont de bonne qualité. La présente étude utilise les histoires génésiques recueillies par les EDS du Kenya en 1998 et 2003 pour examiner les tendances de formation de la famille. La principale conclusion est que les taux de fécondité ont augmenté parmi les femmes d'âge moyen (25-34 ans) qui avaient déjà 4 ou 5 enfants mais a diminué pour les femmes plus jeunes et plus âgées. D'un point de vue méthodologique, l'utilisation des probabilités d'agrandissement de la famille dévoile des comportements qu'il est difficile d'identifier avec les taux de fécondité par âge. L'analyse des probabilités d'agrandissement est cohérente avec la nature séquentielle des grossesses et approche au mieux le processus de formation des familles dans chaque génération. Introduction The fertility dynamics in Kenya has always been a puzzle. The rapid rise in fertility levels in the early periods of 1970s reached total fertility rate (TFR) of 8.1 in 1978/79 one of the highest in the world was followed by rapid decline in the 1980s reaching a TFR of 4.7 in 1998. The rate of fertility change was about 0.34 births per annum between 1989 and 1993, and 0.14 births per annum between 1993 and 1998 an indication that the rate of fertility decline had been slowing up (Blacker, 2002). Blacker (2002) suggested that total fertility rate in Kenya would level out at about 3 births per woman, but only in the relatively short-term future. The results of Kenya Demographic and Health Survey (KDHS) of 2003 showed that fertility decline in Kenya had stalled to a TFR of 4.8. The Kenyan scenario alarmed the demographic community because it occurred when the fertility level was still high (Kizito et. al., 2006) compared to other developing countries like Egypt, Bangladesh, and Indonesia (Ross et. al., 2004). The aim of this study is to examine the nature of the stall in fertility in Kenya using family building patterns approach. Such exploration helps to pin point possible causes of the stall as Westoff and Cross (2006) concluded that despite the identification of the demographic dynamics of the stall in the fertility transition in Kenya, a full explanation is lacking. Literature Review The study of stalls in fertility decline has recently generated deep interest (Bongaarts 2006; Garenne, 2007; Moultrie et. al., 2008). While many of the studies have focused on possible causes of the stall (Bongaarts, 2006; Westoff and Cross 2006) other have focused on characterization of the stall (Garenne, 2007; Moultrie et. al., 2008). Studies on the stalls in fertility decline also have focused on whether such occurrences could be artifacts of data (Thomas and Muvandi, 1994; Sibanda, 1999; Westoff and Cross, 2006) or distortion in total fertility rates due to changes in timing of childbearing (Bongaarts and Feeney 1998; Bongaarts 1999). However, there are possibilities of real reversal in fertility decline that could arise from changes in fertility preferences or constrained access to contraception the major proximate determinant of fertility (Garenne, 2007). The use of family building approach is important because tracing fertility trends by traditional measures (such as TFR) in early stages of demographic transition is speculative and uncertain even if data is of good quality (Brass et. al., 2004). The use of TFR is also likely to be distorted by changes in timing of childbearing (Pandey et. al., 1997; Brass et. al., 2004; Udjo, 1998; Bongaarts 1999, Sibanda, 1999). In addition, previous studies using family building strategies indicated that birth spacing as opposed to birth stopping was the main driving force in the rapid fertility decline in Kenya (Sibanda, 1999; Otieno, 2000). Data and Methods This analysis uses birth history data from the 1998 and 2003 to examine trends in family building patterns. A simple and robust way to examine these trends is to use parity progression ratios (PPR) (Brass, 1993; Brass and Juarez, 1993; Brass et. al., 1995). However, PPR is useful for women who have completed childbearing. The DHS samples have data for women aged 15-49 majority of whom have not completed their childbearing. The birth history thus represents the trajectory of reproduction for women with incomplete history. When parity progression ratios are computed, they will be incomplete. Furthermore, effects of censoring, truncation and selection have to be accounted for. A simple measure following Rodriguez and Hobcraft (1980) is to use incomplete parity progression ratios (Brass, 1983; Brass and Juarez, 1983). This is the proportion of women of parity p-1 who move to the next parity p within n months (Bn) by standard life table methods. Empirical studies (Rodriguez and Hobcraft 1980; Brass and Juarez 1993; Brass et. al., 1995) show that a convenient summary measure is when n is 60 months (B60). Although B60 describes the intensity of childbearing (quantum), it approximates to the parity progression ratios. The speed of reproduction (tempo) can be described by the average duration between the (p-1)th and pth birth often measured by the median. A more refined measure is however the conditional mean called the trimean since the median is influenced by both those who go to the next parity and those who don't (open intervals).These measures combined have been described as robust (Rodriguez and Hobcraft, 1980). Results Trends in Family Building Patterns The results of the preliminary analysis are presented in Tables 1a and 1b in the annex. Figures 1 and 2 summarize the trends in PPR restricted to 5 and 10 years prior to survey date respectively. The PPRs were consistently lower for the 2003 data except at the transitions from parity 2 to 3 and parity 6 to 7 respectively. The smoothened 10 year data is much clearer. PRRs derived from the 1998 birth history data were consistently lower than those derived from the 2003 data. It depicts some indications in the changes in childbearing despite the small margin at higher birth orders. Figure 3 presents another a l t e rna t ive way of vi ewing the childbearing process in terms of the pace of reproduction. The average birth intervals are consistently longer at the earlier periods (1993-1998) compared to the estimated averages from the 2003 data. The implication here is that despite the higher parity progression ratios in the period 1993-1998, those who ever proceeded to the next birth took longer time on average. The large differences in the birth intervals can be checked whether it may be an artifact of data. There were large differences in the average birth intervals between the intervals measured from the 5 years prior to survey date and 5-10 years prior to survey date for the 1998 data (Figure 4). The large differences for the 1998 data may be indi cat ive of displacements in reported dates of births at the 5 year period prior to survey date. For the 2003 data, this was minimal giving an average difference of 0.2 years compared to 3.6 years for the 1998. Possible reasons may be that the interviewers may have shifted birth dates to avoid asking the health questions that pertained to children born in the last five years compared to the 2003 where it was restricted to 3 years prior to survey. Analysis of Period and Cohort Changes Although incomplete parity progression ratios are suitable for analysis of childbearing behaviour, a problem arises since B60s are not directly comparable across cohorts because of truncation of experience (Brass et. al., 1995, Hill and Marindo 1997). Values for the younger cohorts are biased because the women who have attained any birth order are overweighted by the faster breeders Brass et. al., (1995). Brass 1995), Brass and Juarez (1983), suggest comparisons of groups with similar truncations. B60 from birth order 2 to 3 for women aged 20-24 at the time of survey compared B60 for women aged 25- 29 at survey discarding all information for 5 years before survey. B60 calculated for women of a particular age cohort in 2003 could than be compared with B60 calculated 5 years before 1998 survey for women in the age cohort 5 years older. Cohort Trends Tables 1 and 2 present the trends in B60s relative to the oldest cohort (age group 45- 49) to determine the relative changes in family building patterns. From the 1998 birth history data (Table 1) there is a clear and consistent pattern of declines in the progressions among the younger cohorts compared to the oldest cohort except for age cohort 40-44 at higher order births (6-7 and 8-9). The trends show similar patterns as computed by Brass et al (1997) and Brass et. al., 2004 from the 1993 KDHS. There are quite regular in the sense that younger cohorts were less likely to proceed to the next birth parity cohort indicating reduced family building. Data derived from the 2003 however does not show a clear decline compared to that of 1998 (Table 2). At low parities (1-3) there is a consistent monotonic decline in the proportion going to the next birth. However, some slight increase can be noticed at age 15-19 for parity 1-2 and for age 20-24 for parity 2-3 (these being changes that occurred immediately prior to the survey date). The most significant change is that of movement from parity 4 to 5 and 5 to 6 among the age cohorts 25-29 and 30-34 respectively. The results show that among these age groups who had attained parity 4 or 5 were more likely to have another birth compared to the oldest cohort at the same parity group. There was an increase in the tendency to have the next birth in the more recent period (data along the diagonals). Period Trends An approximate representation can be obtained by re-organizing the measures by the diagonals of the age cohort tables. Progression from birth order 1 to 2 for cohort 20-24 years at the survey is roughly located five years after the corresponding transition for the age group 25-29 and ten years after 30-34 age groups respectively. Moves of about two and half years can be allowed by averaging the B60s in successive age groups (Brass et. al., 2004). The progression ratios can then be compared with that for the earliest period for which information can be computed (The figures are multiplied by 1000 to remove fractions). Values lower than 1000 indicate decline while values greater than 1000 indicate an increase. Tables 3 and 4 compare the trends by time periods (rearranged by time location). The origin represented by zero has been taken at the most recent age cohort for which the measures can be calculated. Table 3 indicates a clear monotonic decline for most of the parities (especially the middle) except for some slight aberrations at birth order 2 to 3. Table 4 shows similar representation from the 2003 data set with a clear pattern of recent upsurge especially among the parity cohorts 4 and 5 and the transition from parity 5 to 6. The time location can be restricted to some 10 or 15 years prior to survey as to have comparisons for the most recent times. Table 5 shows the changes in the B60s of different orders over 10 years from survey for both 1998 KDHS and 2003 KDHS respectively. For the 2003, similar changes comparing 5 to 15 years have also been made simply to compare the two data sets. A trend that emerges is that while in the 10 years prior to 1998 there were declines in parity progressions ratios but in the 2003 there were slight increases across particularly from parity 4 to 5 and 5 to 6. When the results are restricted to comparable periods with that of 1998 (5 to 15 years in lower row) there is lack of correspondence especially at parity 4 and 5. Discussion The main objective of this paper was to examine the patterns of family building patterns when it was apparent that fertility had stalled in Kenya. Two main conclusions can be derived from the analysis. First, the parity progression ratios from the 2003 data pertaining to the period 1997-2003 were much lower than those from the 1998 data pertaining to the period 1991-1998 while on the other hand the birth intervals derived from the former were much shorter. This implies that without controlling for other factors the propensity to have additional birth declined for nearly all the birth orders but among those who ever had additional birth in the recent period did so at much faster pace. However, these preliminary analyses do not take into account age factor. The analysis of cohort and period trends showed that there was an increase in the tendency to have additional births for women of parity 4 and 5 and 5 to 6 in the recent times (between 1998 and 2003) and for women in the age group 25-34 years. At higher order births (6 and above) and among the older women (age group 35-49 years) the parity progression ratios slightly declined. Similarly, parity progression ratios declined at the lower parities (1 to 3). This implies that there was a decline in the propensity for younger and low parity women to have additional births and decline in birth rate among the older women but which was compensated by the increased birth rate among women in the middle age and those in middle parities. The compensatory effects may have led to overall stall in the fertility decline. From methodological perspectives, the use of parity progression ratios uncovers patterns that may be difficult with the use of age specific fertility rates. Parity specific analysis is consistent with the sequential nature of childbearing and approximates the family-building behaviour of real cohorts. Thus by introducing the period and cohort perspectives into the analysis provides better insight into the type of changes that may have occurred. Conclusions The observed results have policy implications in the sense that the changes in the childbearing patterns were not uniform. For example, were the changes due to changes in the desired family size among these cohorts of women or was it due to lack of appropriate contraception? Westoff and Cross(2006) allude to the fact that one of the major causes of the stall was the increase in the desired family size, however the paradox lies as to why it may have occurred at only certain specific parities and/or age groups. Secondly, the stall occurred amid problems in the provision of contraceptives where unmet need for contraception remained at the s ame l eve l of ( 2 4 pe r c ent ) and contraceptive prevalence for modern methods among all women remained at 24 percent (CBS, 2004). It may also be the case that the most affected group were those in the peak childbearing age group. For example, Karanja et. al., (2006) reported that the largest drop in pill contraceptive use in the last 10 years prior to survey was recorded among married women aged between 25 and 29 years. The pill use among these women dropped from 17% in 1993 to 8% in 2003 (more than 50% drop) compared to the modest overall drop for all ages from 9.5% to 7.5% for the same period. However, Westoff and Cross (2006) noted that the shortages in contraceptive supplies could not explain the increase in the proportion of women who wanted no more children. Finally, there are a number of limitations of the study. In the first place, the entry into childbearing (proportion moving from parity zero to one) since the timing of entry into childbearing may alter the observed fertility rates. Secondly, other tempo effects such as the average ages at given parities was not examined in addition to determining whether the patterns are similar across different sub populations. These issues may be thus form focus for other studies on the nature of fertility stall in Kenya. 1 The trimean is computed by first normalizing the proportions who progress to the next parity within 60 months to 1. Using the normalized values, new quartiles (q1,q2,q3) are computed. The trimean equals (q1+2q2+q3)/4. ANNEXES References
© Copyright 2008 - Union for African Population Studies The following images related to this document are available:Photo images[ep08008f2.jpg] [ep08008f3.jpg] [ep08008t2.jpg] [ep08008a1b.jpg] [ep08008f4.jpg] [ep08008f1.jpg] [ep08008t1.jpg] [ep08008t5.jpg] [ep08008t3.jpg] [ep08008t4.jpg] [ep08008a1a.jpg] |
| |||||||||
