 |
| About Bioline | All Journals | Testimonials | Membership | News |
|
||||||
|
||||||
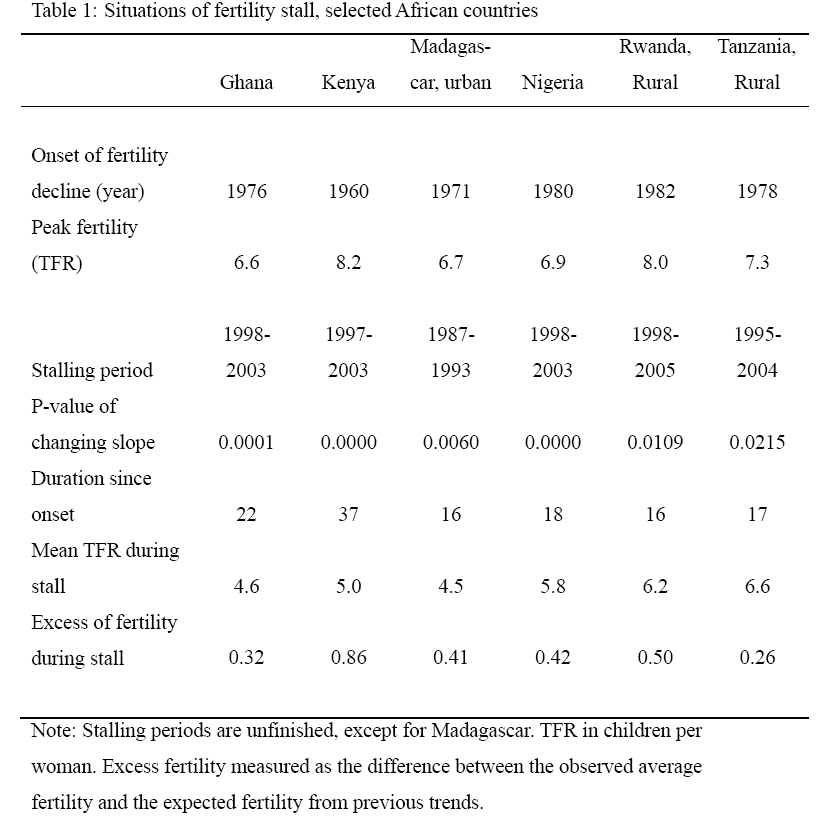
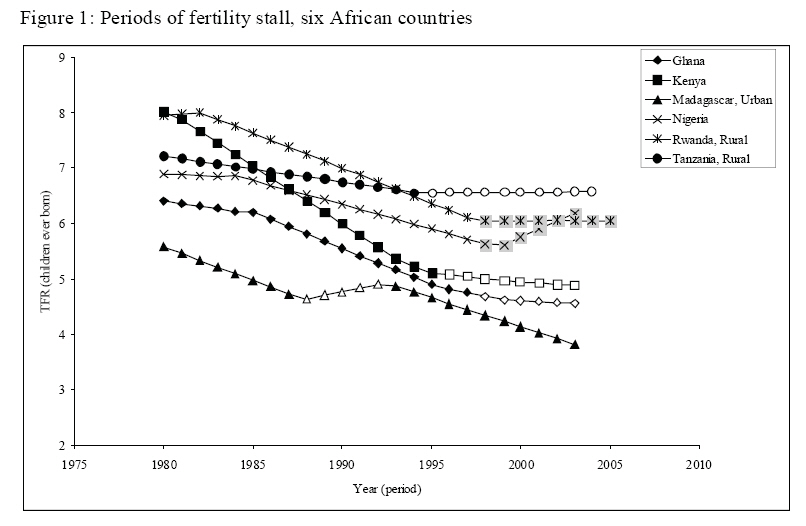
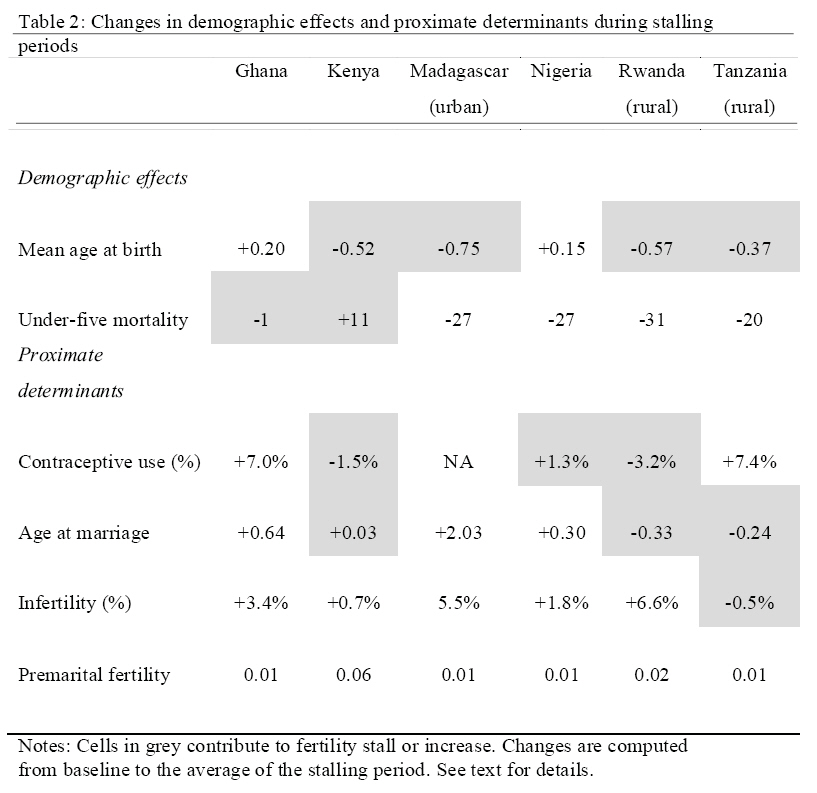
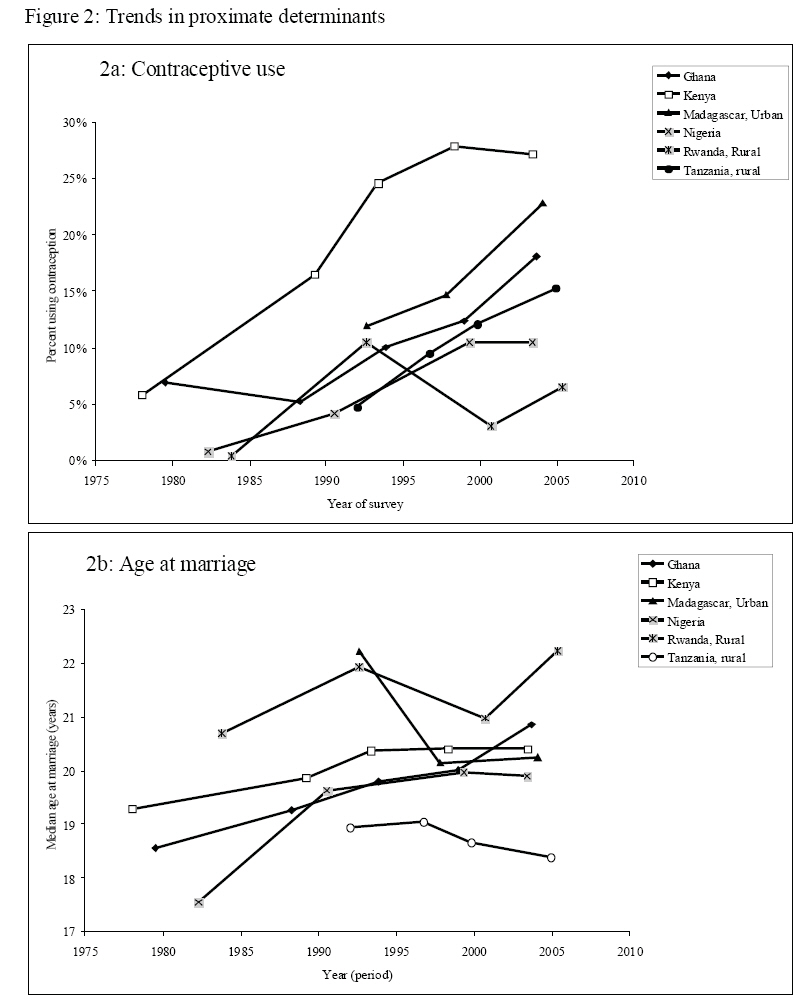
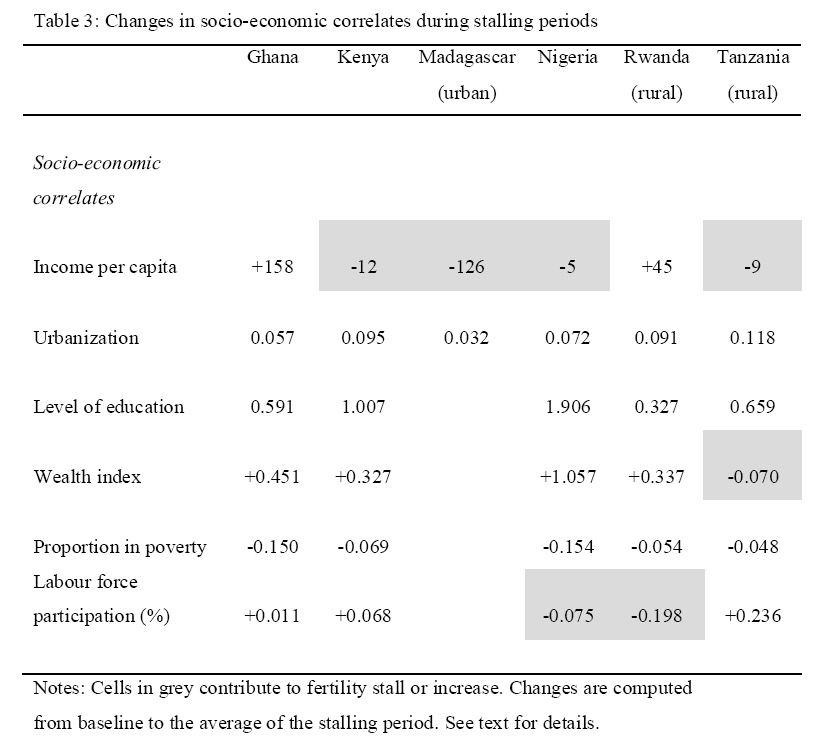
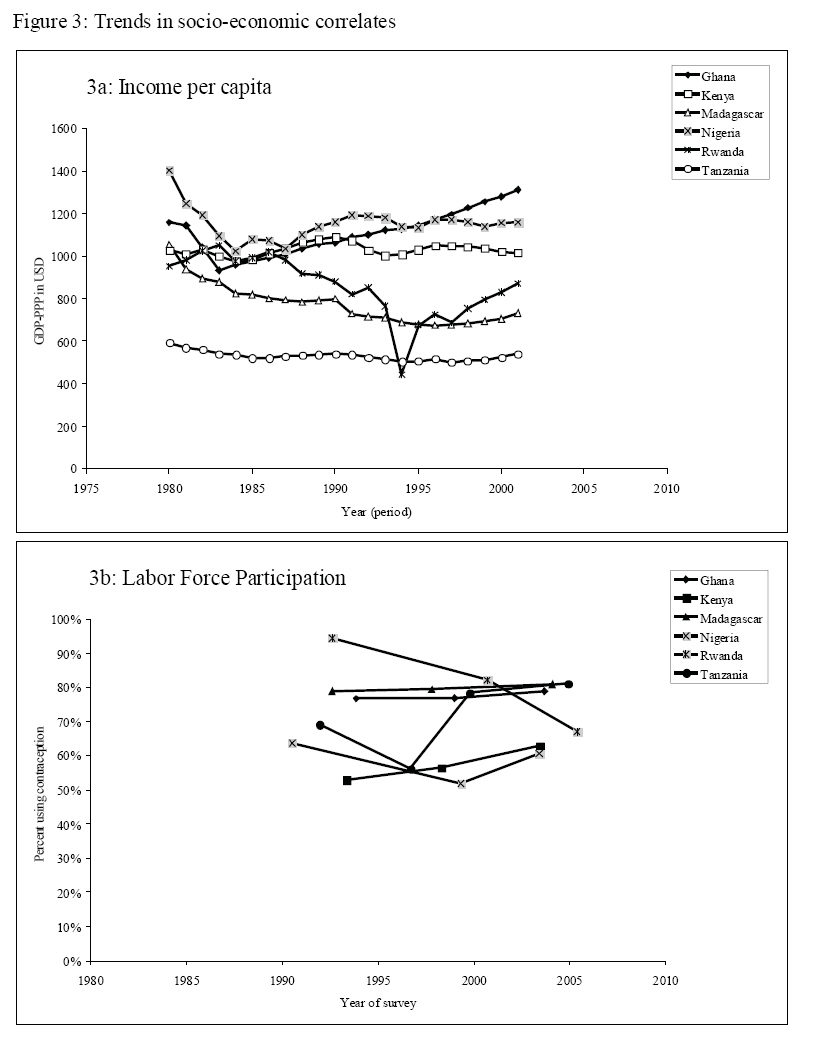
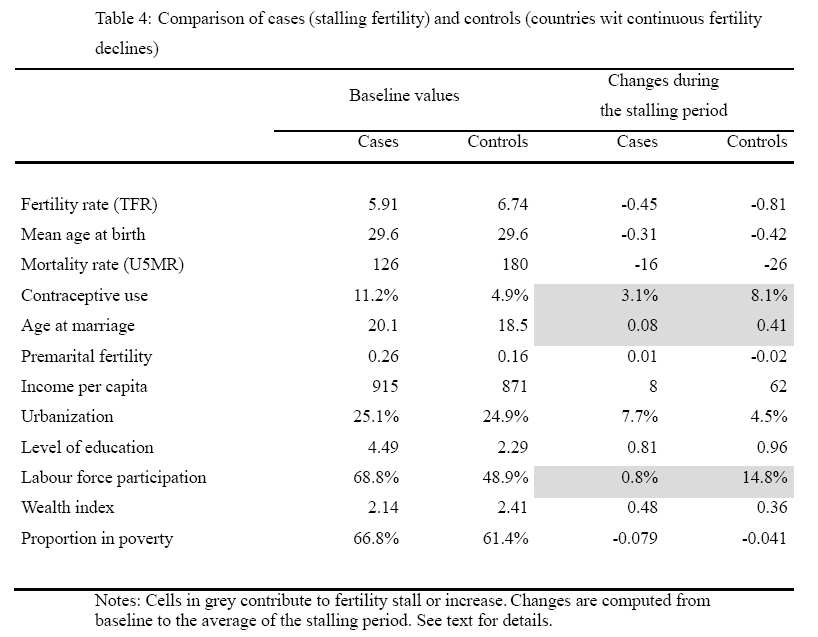
African Population Studies, Vol. 23, No. 2, 2008, pp. 173-188 Situations of fertility stall in sub-Saharan Africa Michel Garenne, Institut Pasteur, Epidémiologie des Maladies Emergentes, Code Number: ep08010 Abstract A comparative study of fertility trends since 1950 in 30 countries from sub-Saharan Africa revealed several cases of “fertility stall”, that is a change from downward fertility trends to flat- or even slightly rising- trends for some time, usually a few years: Ghana (1998-2003), Kenya (1995-2003), Madagascar in urban areas (1987-1993), Nigeria (1999-2003), Rwanda in rural areas (1999-2005), Tanzania in rural areas (1995-2004). In a first part, the paper presents the statistical evidence of changes in fertility trends. In a second part, the analysis focuses on possible causes of these changes. Fertility stalls were often associated with changes in two proximate determinants (contraceptive use and age at marriage) and in two socio-economic correlates (income and labour force participation). The paper concludes to a variety of situations leading to different causality in the various countries, including one case (Ghana) for which no reasonable explanation could be found from the available data. Key words: Fertility transition; Fertility stall; Contraception; Labour force participation; Sub-Saharan Africa. Résumé L'analyse des tendances de la fécondité dans 30 pays d'Afrique sub-saharienne révèle plusieurs cas de stagnation de la transition, c'est-à-dire un changement d'une pente négative à une pente nulle voire légèrement positive. Ces situations sont récentes et de courtes durées : Ghana (1998-2003), Kenya (1995-2003), Madagascar en urbain (1987- 1993), Nigeria (1999-2003), Rwanda en rural (1999-2005), Tanzanie en rural (1995-2004). La première partie montre la réalité statistique de ces changements de tendance. La seconde partie analyse les causes possibles de ces changements. Les cas de stagnation de la transition sont souvent associés aux changements de tendances de deux déterminants de la fécondité : la contraception et l'âge au mariage, ainsi qu'à celles de deux corrélats socio-économiques : le revenu et l'emploi féminin. Mais chaque situation semble particulière et le résultat de causes différentes. Le cas du Ghana reste problématique et inexpliqué. Mot clefs: Transition de la fécondité; Stagnation de la transition; Contraception; Emploi féminin; Afrique sub-saharienne. Introduction The concept of “fertility transition”, defined as the path from natural fertility (high levels) to replacement fertility (low levels), hides a wide variety of local situations: the levels of fertility at onset may differ markedly between countries; fertility may be rising prior to the transition; the time from peak fertility to replacement fertility may vary from a few decades to a century or more; fertility may level-off around replacement level for a while, then undergo further decline, or fertility decline might continue below replacement level without stopping. Furthermore, an unexpected rise might occur at some time, such as the well documented baby boom in Europe and the United States after the World War II, or fertility decline might stop (fertility stall) for some years during the course of the transition. Literature Review and Theoretical Framework Such situations of “fertility stall” have been described in a variety of countries around the world, in Asia (Bangladesh, South-Korea), in the Middle East(Turkey, Egypt, Iran), in Latin America (Colombia, Costa-Rica, Dominican Republic, Argentina), and in Africa (Ghana, Kenya, Rwanda, Tanzania), although a few of these cases are probably spurious [Aghajanian, 1991; Bongaarts, 2006; Eltigani, 2003; Gendell, 1985; Westoff& Cross, 2006; Shapiro & Gebreselassie, 2007]. They typically occur somewhere in mid-transition, and are sometimes associated with stalling contraceptive use, although not always, and often without any obvious link with common socioeconomic factors. Reasons for stalling fertility are still open to debate. Three main reasons could explain the stalls at national level. Firstly, a change in demographic factors, such as the tempo of fertility (earlier births or a stop in the increase of mean age at birth), or shorter birth intervals (due to mortality change, or to better health status). Secondly, a change in proximate determinants of fertility, such as: less contraceptive use, less abortion, earlier marriages or more premarital fertility, less infertility, less separation between spouses, more sexual intercourse. Thirdly, a change in the socio-economic context, such as: a halt in urbanization, a decline in income per capita, less education or a stall in trends in level of education, increasing poverty, or a decrease in labour force participation. The list of potential factors is long, and goes beyond those mentioned above, even though some of these are expected to have only a minor impact. The aim of this paper is to document a series of case studies of stalling fertility in sub-Saharan Africa. This work is a by-product of a systematic analysis of fertility trends in 30 African countries using DHS data [Garenne & Joseph, 2002; Garenne, 2004; Garenne, 2008]. The framework of analysis is a straightforward framework of proximate determinants [Davis & Blake, 1956; Bongaarts & Potter, 1983], which has been widely used in the demographic literature, and bears much similarity with the earlier analysis by Bongaarts [2006]. In this study, the focus is on sub-Saharan Africa, and on the determinants of fertility change identified in the main analysis of fertility trends, in particular on contraceptive use, age at marriage, premarital fertility and urbanization. This work originated from an observation of fertility stall in Agincourt, a rural area of South Africa under demographic surveillance, where the fertility decline which had started around 1975 stopped for a few years between 1995 and 1999, to resume again afterwards [Garenne et al. 2007]. Data were robust, and confirmed by an independent analysis of the 1996 and 2001 censuses for the same area. However, the Agincourt study was focused on other issues (e.g. health and migration) and provided little information on potential factors. In Agincourt, the time at which fertility decline resumed was clearly associated with migration of young women who found job opportunities elsewhere, in farms and in the tourist industry in particular, as a consequence of the economic boom in the area, following years of difficult times [Collinson et al. 2007]. Recent data from Hlabisa, another DSS in rural Kwazulu Natal, also suggest a situation of fertility stall from year 2000 to 2005 [forthcoming]. Data & Methods Fertility trends The method for reconstructing fertility trends has been presented elsewhere [Garenne, 2008]. In brief, period age specific fertility rates are cumulated up to age 40, and analyzed by calendar year. Fertility trends are computed, and slopes are tested by assuming the equivalence of period and cohort (for instance, a TFR of 5 based on 500 births is considered equivalent to a cohort of 100 women, with the same distribution by parity and the same completed family size). All calculations were done for urban and rural areas separately. Periods of fertility stalls were defined as periods during which the slope changed from negative (fertility decline) to nil or positive, the change in slope being significant at the P< 0.05 level. This definition differs somewhat from definitions used by other authors [Bongaarts, 2006; Eltigani, 2003; Westoff& Cross, 2006; Shapiro & Gebreselassie, 2007], although the concept is basically the same. Additional criteria such as “at least two DHS surveys”, or “decline of at least 20% from starting level”, or “earlier rapid decline of 0.15 child per year” used by other authors were not considered. Many of the cases already documented in Africa (Ghana, Kenya, Tanzania, Rwanda) were highly significant in this analysis, but more cases of stalling fertility were identified this way. In particular, cases where fertility stalled in rural areas but not in urban or conversely in urban but not in rural areas were also considered. In this paper, all cumulated fertility rates by age 40 were converted into classic TFR at age 50, simply by dividing by 0.9 (90% of fertility occurs prior to age 40). In addition to levels and trends, the “excess fertility” during the stalling period was measured by the difference between the average TFR during the stalling period and the expected TFR predicted by the trends occurring 10 years earlier. Demographic effects The tempo of fertility was measured by the mean age at birth, computed from the period age specific fertility rates in DHS surveys. The mean age at birth during the stalling period was compared with that during the period covering the five years before the stall. The under-five mortality rates were computed from DHS surveys, the comparison was also made between the stalling period and the five preceding years. Proximate determinants Contraceptive use was measured by the proportion of eligible women (who ever had intercourse, either ever-married or not) who were currently using a modern method at time of survey. Change in contraceptive use was measured by comparing the average prevalence during the stalling period (e.g. the average of the two DHS surveys framing the stalling period) with the preceding DHS survey (e.g. five years before the stalling period). Age at marriage was measured by the median age at marriage at time of survey, computed from the proportions evermarried by single year of age, and interpolated to obtain 50% ever-married. Change in age at marriage was computed the same way as for contraceptive use (average during the stalling period compared with the preceding survey). Infertility was measured by the proportion of women with no live birth at time of survey. All these indicators were computed by 5-year age group (15-19 to 45- 49) and standardized by age, using the same standard, and proportionately to average age specific fertility rates. However, standardization changed little the average result. Computations could be done for most of the countries investigated, with the exception of Madagascar, because the stalling period occurred before the first DHS survey (1992). In this case, changes in proximate determinants could not be evaluated. Socio-economic context Data on income per capita were derived from the OECD data base [Maddison, 2006]. They are expressed in GDP-PPP in constant USD, and are available for all years between 1950 and 2001. When the stalling period straddled this range, income data were truncated in 2001. Level of education was calculated from DHS data, by computing the mean number of years schooling at time of survey, and also standardized by age. Labour force participation was calculated from DHS data, by computing the proportion of women currently working at time of survey, also standardized by age. Wealth was estimated from DHS data by a custom-made Wealth Index, described elsewhere [Garenne & Hohmann, 2005]. In brief, this wealth index counts the number of modern goods owned by the household, and provides an absolute value of wealth, as opposed to other indices which provide only relative values and quintiles. Poverty was estimated by the proportion of households with less than three modern Case and control study In order to better identify the ultimate determinants of stalling fertility, the 'case' countries (with stalling fertility) were compared with five African countries where the fertility decline was steady, and continued during the 1998-2003 period. These 'control' countries were: Burkina- Faso, Cameroon, Ethiopia, Malawi, and Senegal. Results Fertility stalls The systematic analysis of fertility trends in sub-Saharan Africa revealed six cases of stalling fertility, all being highly statistically significant (Table 1, Figure 1). In Ghana, fertility decline started around 1976, and stopped after 1998, the last survey being conducted in 2003. In Kenya, fertility decline started earlier, around 1960, and stopped at about the same time (1997), the last survey also conducted in 2003. In Nigeria, the onset of fertility decline was located around 1980, and the fertility stall occurred at the same time, and was also truncated by the 2003 survey. The next two cases (Rwanda and Tanzania) offer a different picture of fertility stall concentrated in rural areas, and not significant in urban areas. In Rwanda, it started in 1998, and in Tanzania in 1995, and both were still ongoing at the time of the las t survey (2005 and 2004 respectively). The last case is more atypical: in Madagascar, the fertility stall was significant only in urban areas, occurred much earlier (1987-1993), and was transient, since fertility decline resumed within seven years. The stalls occurred at different points during the course of the transition: about half way in Ghana, Kenya, and Madagascar, in the first third in Rwanda, in the first fourth in Nigeria, and in a less advanced situation in Tanzania (1/7th). Time since onset of the transition ranged from 16 years to 37 years, with an average of 21 years. Level of fertility during the stalling period differed also, and ranged from 4.5 to 6.5 children per woman. The excess fertility, comparing the average level with the predicted value from previous trends, was small, and ranged from 0.26 to 0.86 children per woman. An average value of 0.5 children per woman is difficult to account for, since many factors could have such an impact on the TFR. Trends in demographic effects In four of the six cases, the mean age at birth was somewhat lower during the stalling period than in the preceding period, so contributing to the stall (Table 2). In two countries (Ghana and Kenya), small or positive changes in under-five mortality could also have contributed to shortening birth intervals, whereas in the other cases, better child health would have contributed to the opposite. Trends in proximate determinants In Ghana and Tanzania, the fertility stall occurred despite increasing contraceptive use, and it should be noted that these are the two countries in which the excess fertility was the smallest (Table 2, Figure 2). In three other countries (Kenya, Nigeria and Rwanda) the fertility stall was associated with either a decline or no improvement in contraceptive use. Age at first marriage was increasing in Ghana and Madagascar, thus having a negative effect on the stall, whereas it was decreasing or steady in the other cases, thus contributing to the stall. There was no possible effect of infertility, since in all countries considered the proportion of childless women tended to increase, with the exception of Tanzania where changes were very small. Premarital fertility remained small in these countries, and changes were unlikely to have any effect. Altogether, no pattern seems to emerge from proximate determinants, and the situations of the six countries appear as diverse. Kenya, which had the most pronounced stall, cumulated four of the factors investigated. In Rwanda, contraceptive use and the timing of birth could be invoked as potential factors. Tanzania the tempo of marriage and birth and possibly declining infertility could be invoked. In Nigeria, there was virtually no increase in contraceptive use, and age at marriage might have fluctuated. And the last case, Ghana, remains puzzling, since none of the investigated determinants could account for the changes in fertility trends. Trends in socio-economic correlates Two of the countries investigated had rising income per capita over the stalling period (Ghana and Rwanda), whereas the other four had steady or declining trends (Table 3, Figure 3). In theory, a decline in income could contribute to the stall, but it should be remembered that in Africa the relationship between GDP and fertility trend is extremely weak. It is even reversed over the 1950-2000 period, since fertility increased when GDP increased (1950- 1975), and fertility decreased when GDP decreased (1975-2000). From DHS data, trends in GDP did not translate readily into measures of wealth or poverty, and four of the six countries continued to cumulate wealth over the stalling period, while Tanzania was loosing somewhat in wealth, and no data being available in Madagascar before 1992. According to the United Nations data, urbanization continued during the stalling period, for all six countries. Likewise, level of education continued to rise on the average. Last, female labour force participation tended to decline or remained steady in five countries, and continued to increase only in Kenya. Here again, the diversity of situation makes any generalization impossible. In summary, some of the cases appear understandable. In Kenya, a difficult economic situation associated with somewhat lower contraceptive use, and combined with rising child mortality, little change in age at marriage and somewhat earlier birth, could account for the stall. In Rwanda, difficult times associated with a drop in contraceptive use, a minor decrease in age at marriage and declining labour force participation, also makes an understandable scenario. In Tanzania, somewhat earlier marriage and births could explain the small changes observed, despite an increase in contraceptive use during the stalling period, obviously for women other than the newly married women. In Nigeria, difficult times, associated with fluctuating labour force participation and marriage, and no improvement in contraceptive use could also account for the stall. In Madagascar, births seem to have occurred at an earlier age during the stalling period, despite higher age at marriage, and no evidence of a major rise in premarital fertility. This remains a puzzling case deserving more investigation. Last, Ghana remains not understandable from available data, and al so deserves fur ther investigation. Cases and controls Cases of fertility stall were compared with controls, that are countries experiencing a continuous fertility decline before and during the 1998-2003 period. Results indicate that cases were somewhat more advanced in the demographic transition than controls, both for fertility and mortality decline, and had somewhat higher contraceptive use and higher age at marriage, with about the same age at childbearing (Table 4). Both groups were about as poor and as little urbanized, but cases had higher levels of education and higher levels of female labour force participation. During the stalling period, or during the 1998-2003 period for controls, cases had a smaller increase in contraceptive use, and a smaller increase in age at marriage than controls. Changes in income, wealth, and level of education were about the same, although the proportion of poor households declined faster among the cases. The only striking difference in socio-economic correlates was the strong increase in female labour force participation among the controls, in contrast with virtually no change among the cases. Discussion Cases of stalling fertility have occurred in numerous countries with various socio-economic backgrounds and at various levels of development. They tend to be transient, and to last only a few years, until fertility decline resumes its course. In the African cases investigated in this study, only one fertility stall was terminated (Madagascar, urban), which lasted only seven years and was the most atypical. The others were still ongoing at time of the survey, and have been lasting for five to nine years, so that their future course remains unknown. The analysis revealed a variety ofdemographic situations, some being well advanced, others still in the early stage of the transition, some at higher levels of fertility than others, some being associated with increasing mortality, others not, some associated with changing tempo of fertility, others not. The African cases seem also to differ somewhat from other cases of stalling fertility documented in Asia, in the Middle East and in Latin America, at least in their demographic and income characteristics. Changes in proximate determinants could explain many of the stalls, in particular declining or steady contraceptive use, and declining or steady age at marriage, which also appeared as the important factors in the comparison with countries experiencing continuous fertility decline. These two determinants of fertility trends have been well documented by various authors for explaining fertility decline as well, and were confirmed in our earlier study in Africa. It remains possible that under-five mortality changes added to these effects in two of the countries, and changes in infertility in one country. However, the case of Ghana remains not understandable with the available information on proximate determinants. This could be due to spurious effects in the data, even when significant trends were identified, since the differences between observed and expected fertility levels were very small, or because other factors were at stake, not counted in this analysis, such as spouse separation or abortion. The relationship with socioeconomic factors is even morecomplex, and this has been a common observation as well in the European transitions [van de Walle & Knodel, 1980]. In four cases, an economic recession measured by changes in GDP per capita could be seen in the recent past, which however did not translate into other measures of wealth. Female labour force participation seems to have played an additional role in two of the cases, and was the sole factor emerging from the comparison of cases and controls. The case of Ghana remains as puzzling with respect to socio-economic factors, as it was with proximate determinants, leading again towards an explanation of a data artefact. The role of female labour force participation requires further study. The measure used in this analysis was very crude, and could be refined by separating the modern sector, the informal sector and agriculture. More analysis of consistency in work definitions also needs to be conducted. The relationship of changing labour force participation with migration and spouse separation could also be further studied. All the case studies investigated here deserve more research, one by one, with more investigation on data consistency, and more contextual information. Several authors have emphasized the role of fertility intentions, measured by the “desired family size” or “desire to have more children” in the stalls around the world [Bongaarts, 2006; Westoff & Cross, 2006]. These could be also studied in relation with changing marriage and labour force participation. Discussing the complexrelationships with access to contraceptive methods and with the contraceptive mix is beyond the scope of this paper, and also deserves more analysis. Changing for less effective methods, such as condom, for preventing HIV/AIDS, has been invoked as a possible factor of stalling fertility in South Africa, a point which deserves more investigation. Conclusion Even if fertility stalling appears as a minor issue compared with the major fertility trends, it deserves further attention from researchers. One needs to be able to better document these cases, and to better quantify the net effect of the various factors. In this respect, more research could be done on couple stability and periods of separation between spouses, which were shown to be factors of fertility in 19th century Europe [van de Walle, 1975; Potter& Kobrin, 1982] References
© Copyright 2008 - Union for African Population Studies The following images related to this document are available:Photo images[ep08010t4.jpg] [ep08010f3.jpg] [ep08010t2.jpg] [ep08010f2.jpg] [ep08010t1.jpg] [ep08010f1.jpg] [ep08010t3.jpg] |
| |||||||||
