 |
| About Bioline | All Journals | Testimonials | Membership | News |
|
||||||
|
||||||
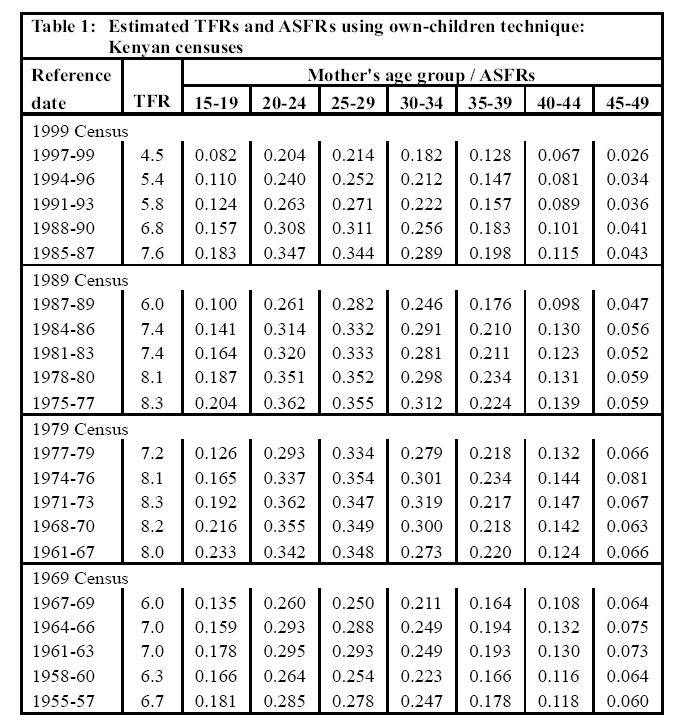
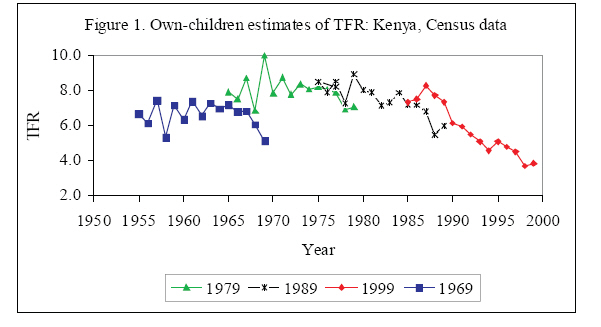
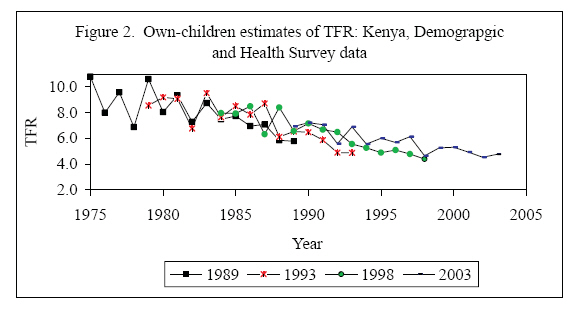
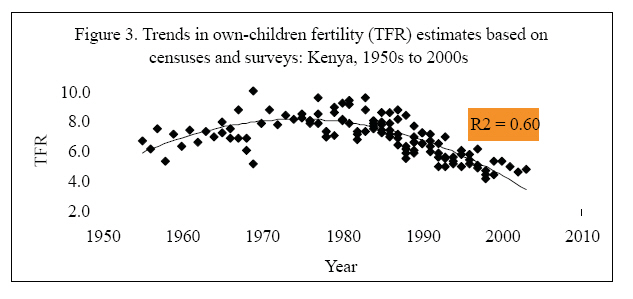
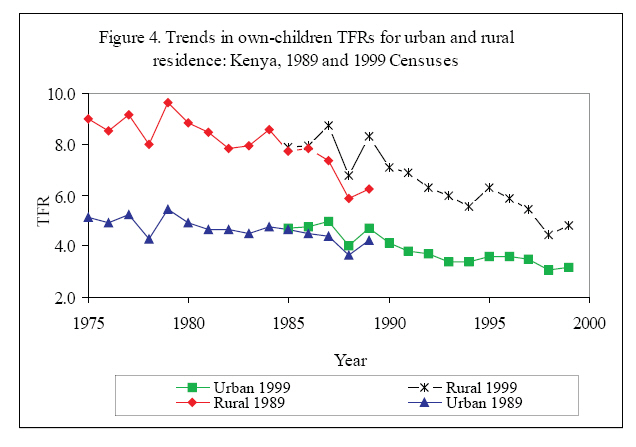
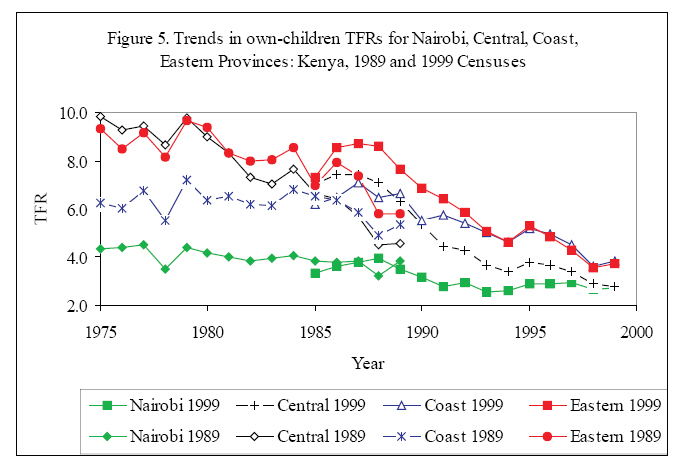
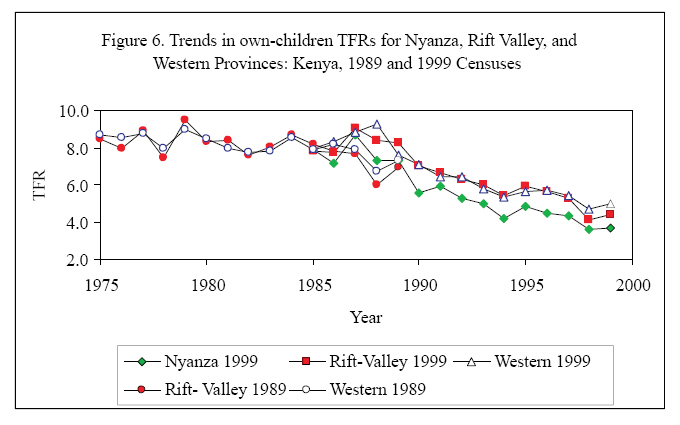
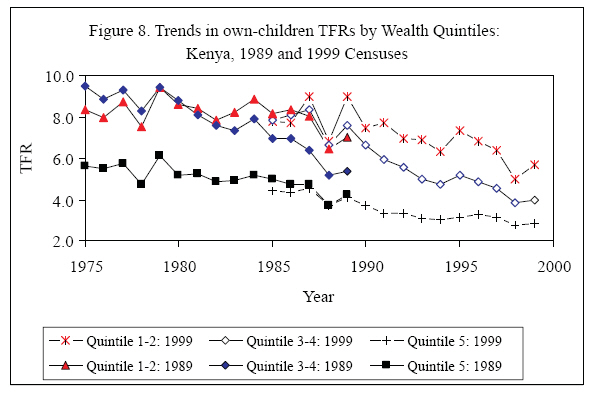
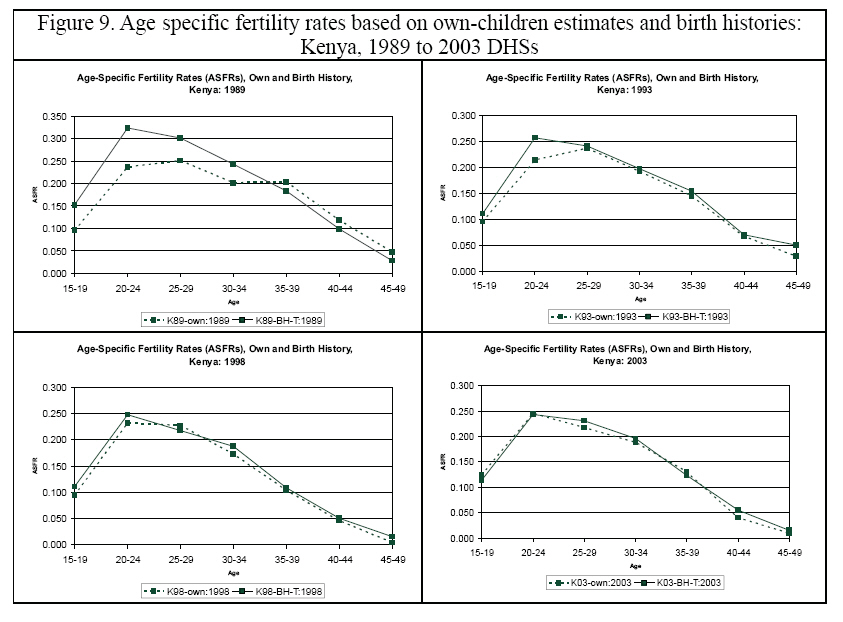
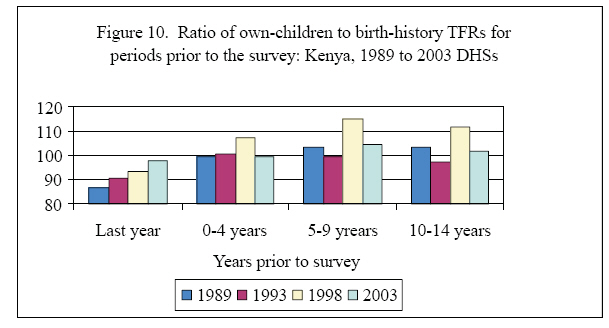
African Population Studies, Vol. 23, No. 2, 2008, pp. 189-205 Fertility Levels, Trends and Differentials in Kenya: How Does the Ownchildren Method Add to Our Knowledge of the Transition? Collins O. Opiyo, Michael J. Levin Population Studies Center, University of Pennsylvania, Philadelphia, PA, USA Code Number: ep08011 Abstract The own-children method of fertility estimation tracks temporal changes in fertility patterns. We revisit the Kenyan fertility transition by applying the method to 1979, 1989 and 1999 censuses, and 1989, 1993, 1998 and 2003 Demographic and Health Surveys data. The method's ability to provide yearly fertility rates for periods preceding each data source adds enormous knowledge to fertility patterns. For Kenya, these trends go back through the 1960s. First, the method sheds additional light on the onset of the transition. Second, the trends highlight major differences in the onset and pace of fertility decline among regions and key sub-groups. Third, the rates for overlapping periods provide both internal and external validity checks that heighten confidence in the overall results. Last, it provides a rare opportunity to evaluate birth history fertility rates. Taken together, these estimates provide more detail than ever before regarding fertility patterns in Kenya. Key words: fertility, own-children method, demographic transition Introduction Kenya is among the developing countries with fertility stalled in midtransition (Bongaarts, 2005). Evidence shows that fertility dropped dramatically from nearly 8 children per woman in the mid-to-late 1980s to about 5 children per woman in the late 1990s, and leveled-off thereafter (Blacker et al., 2005; Opiyo, 1993, 2004; ROK, 1990, 1996, 2002). Heightened interest in the Kenyan fertility dynamics began when its transition 'delayed' despite being among the first countries in Sub- Saharan African to adopt an explicit population policy (Odile, 1987; Odile and McNicoll, 1987). Needless to say, the onset of the fertility decline was marked with considerable excitement, with researchers d e s c r i b i n g i t a s u n e x p e c t e d , unprecedented, and one of the most precipitous ever recorded for an African country (Robinson, 1992; Cross, Obungu, and Kizito, 1991; Kizito et al. 1991). This study revisits the Kenyan fertility transition using the own-children method of fertility analysis with a view to adding new knowledge on other dimensions of the decline. Kenya collected and processed censuses in 1969, 1979, 1989, and 1999, and Demographic Health Surveys (DHS) in 1989, 1993, 1998, and 2003. This study exploits the wealth of censuses and surveys data available from these sources to generate fertility levels and trends for the period from the mid-1950s to early 2000s. Literature Review and Theoretical Framework The own-children method of fertility estimation The own-children method of fertility estimation is a reverse-survival or back-projection technique for estimating age-specific and total fertility rates for up to 15 years prior to a census or household survey. It uses population age structure with assumptions about mortality to obtain birth rates for defined periods in the past. The technique is well known, and was used extensively in the 1970s and 1980s, but has fallen off in usage in recent years. For a detailed discussion of the technique see Cho (1978), Cho, Retherford, and Choe (1986), and, Feeney (1975). Data and Methods Applying the own-children technique to Kenyan data We apply the own-children method to analyze fertility patterns in Kenya based on the 1969, 1979, 1989, and 1999 censuses, and 1989, 1993, 1998, and 2003 DHS data. Census data provide larger data sets for analysis, and so facilitate differential analysis by geographic area, urban/rural residence, education, wealth, and other key variables. As noted in the literature described above, the procedure involves matching enumerated children aged 0 to 14 years by single years of age (the own-children) to their mothers (also by single years of age) within each household. The resulting matches are compiled as the mother-child matrix. The un-matched children, referred to as the non-own-children, tabulated by the child's age, are re-distributed to each age (group) of women according to the distribution of their own-children on the assumption that the unmatched children have mothers of approximately the same ages as the matched children A reverse survival technique is then applied year by year, using predetermined age-specific mortality rates, to estimate the number of births for mothers for each of the 15 years preceding the survey or census. A similar procedure is used to obtain the numbers of women by single years of age at corresponding periods (Cho, Retherford and Choe, 1986). Estimates are not usually computed further back than 15 years because births would then be based on children aged 15 years or older at enumeration, a large proportion of whom may no longer reside in the same households as their mother and hence difficult to match. Also, the same persons could by both children and mothers, causing some methodological problems. Matching can be achieved through use of mother's personal or line number (MPN), if available, or relationship to head of household (RHH). The former method is often considered superior. Nonetheless, in practice, they result in negligible differences in fertility estimates, unless there is systematic bias in the distribution of non-own-children by mother's age (Levin and Retherford, 1982). Further refinements can often be made via simple algorithms to ensure consistency in age difference between the child and the supposed mother (Opiyo, 1993; Opiyo and Levin, 2007). Matching and production of levels and trends are facilitated by using the East- West Center's Own-children Fertility Estimates software (FERTRATE). We can also compare the results with those from other African countries, since the method standardizes events. The matching process is discussed in detail in Opiyo and Levin (2007), and comparisons with other countries also appear there. Here, we first compare census and survey based estimates. Then we use DHS data to compare own-children and birth history rates in order to highlight some of the advantages of the former technique over the latter. The results are presented in the next sections. Results Own-children method fertility estimates: Trends in fertility Table 1 and Figure 1 show the estimated total fertility rates (TFRs) over time based on census data, using the own children method. As noted, the numerators and denominators come from a single source, in each case here, the respective census. So, each block in the table shows the fertility rates for each census in turn, going backwards through time. Since the period is 15 years, some categories overlap when successive censuses are used. Table 2 and Figure 2 show the TFRs based on the Demographic and Health Survey data. The overlap is greater since the DHS are taken in 5 year cycles while the censuses are on 10 year cycles. Both data sets show that the TFR in Kenya increased from a little more than 6.0 in the 1950s and 1960s to about 8.0 during the late 1970s, and then declined to about 6.5 in the late 1980s, and further to about 5.0 at the turn of the century. Thus, the pace of decline increased from the early 1990s. One great advantage of the ownchildren method is its ability to provide long term trends. When data are available from more than one source overlapping trends can be derived that also allow for external validity checks. Figure 3 shows a scatter plot putting together all the singleyear TFR estimates from the four surveys and the four censuses data. We fitted a third-degree polynomial on these point estimates. The trend line shows an arc upward until about 1980, and then a continuing downward arc after that. Since this is more of less a straight quadratic, the trend line continues downward to the end (the most recent years), with the last 4 points all above the line. A different curve might show an upward trend at the end, but the own child method, as noted elsewhere here, tends to show a pop up in the most recent years before a census or survey because of upward age estimates of very young children. Own-children fertility estimates: Sub-group differentials in fertility trends The own-children technique also provides a useful means of studying differential fertility over time. In this paper, we are interested not so much in the magnitude of the differences since that is documented in more than a dozen studies. Rather, we are interested in showing the differentials in the trends over time, and how they relate to the theories of fertility transition. We present differentials by urban/rural residence, province of residence, educational attainment, and wealth status. Differentials by place of residence Figure 4 presents estimated TRFs by place of residence for the period 1975 to 1999. As expected, both censuses show substantially lower fertility in urban than rural areas. Additionally, while fertility decline has continued in both urban and rural, the difference in TRF between rural and urban decreased over time from about 4 in the mid-1970s to about 2 at the end of the 20th century, indicating that the transition in rural areas proceeded more rapidly than in urban areas. The figure, however, does not show a discernible difference in the onset of fertility decline between urban and rural areas, although it is common knowledge that that urban fertility declined first. Differentials by Province of residence Figures 5 and 6 present ownchildren estimates of fertility differentials by Province, based on the 1989 and 1999 censuses. Here we are looking to elucidate the view that the onset of fertility transition in Kenya varied by regions. Evidence from these figures supports this view, showing that the transition started earlier, in fact, in the late 1970s, in Central Kenya (Central and Eastern provinces) and around mid- 1980s in the western (Nyanza, Rift Valley, and Western provinces) and coastal Kenya. The pace, however, varied considerably, with the transition proceeding faster among the latter provinces. Accordingly, the wide disparities in levels at the onset of the transition substantially narrowed over time, thereby putting the TFRs on a path of convergence after the mid-1990s. Further evidence shows that fertility has been substantially lower in Nairobi, which is entirely urban. Coast Province also exhibited lower fertility before mid-1980s, but Central and Eastern provinces have since caught up. Fertility was, however, much higher (and fairly similar) in western Kenya (Nyanza, Rift- Valley, and Western provinces), but the decline proceeded faster compared to central Kenya. Differentials by educational attainment The influence of education on fertility is among the most studied socioeconomic differentials (Cochrane, 1979; Caldwell and Caldwell, 1987; UN, 1987). Education exerts its influence on fertility by encouraging innovative behavior such as contraceptive use, or through introduction of socio-economic alternatives to child bearing and rearing. Kenya has continued to exhibit substantial differentials in fertility by educational attainment. Figure 7 affirms the inverse relationship between fertility and educational attainment, showing lowest fertility among the most educated and highes t fer t i l i ty among the uneducated. But of more interest to us are the trends in the differentials over time. To this end Figure 7 highlights three points. First, all subgroups showed appreciable fertility decline beginning around 1980. Second, while no clear difference appears in the onset of decline, it proceeded faster among the sub-group with partial secondary education (Form 1-3). Last, the sub-group differentials have continued to narrow over time. Differentials by well-being That demographic and well-being indicators are intertwined is not a new phenomenon among researchers and policy makers. However, recently researchers are showing more interest in the linkages, particularly owing to the presumed association between welfare deterioration and the unfavorable demographic outcomes observed in most Sub-Saharan African countries. Thus, we al so sought to examine fer t i l i ty differentials by status of well-being. Wellbeing, in this case, is measured by a composite wealth index based on census data that we created to proxy household poverty via principal components analysis (PCA). The indices, as is often the case in this type of analysis, were subsequently grouped into quintiles. Details of this process are provided in Opiyo and Levin (2007). Further, to facilitate analysis we collapsed the quintiles into 1 and 2, 3 and 4, and 5 to help discern the trends in the differentials. The results, displayed in Figure 8, shows that fertility decline started among all sub-groups between the early and mid-1980s. However, the decline proceeded faster among the middle-wealth category where fertility was highest in the pre-transition period. As expected, fertility remained lowest among the wealthiest category. Age pattern of fertility: Own-children versus birth history estimates Much of our earlier discussion centered on TFR as a measure of fertility level. However, the own-children method provides estimates for age-specific rates as well. A detailed analysis of age-specific fertility trends for Kenya is available in Opiyo and Levin (2007). In this section, however, we focus on how the age patterns of fertility from the own-children method compare with similar estimates from birth history data, similar to other work, using more than 50 DHS data sets for Sub- Saharan Africa (Levin, 2007). It is an interesting comparison, given that the own-children is child based while the birth history technique is women oriented. We have re-produced some of the results for Kenya in Figure 9. The estimates for 1989 show significant differences between the two methods. The own-children birth rates were substantially lower among women aged under 35 and higher for older women, compared to birth history estimates. The rates from the more recent DHSs, those in 1993, 1998, and 2003, show remarkably similar results for the two methods over the entire reproductive life span, save for women aged below 30 in the 1993 DHS for whom the own-children rates were somewhat lower. In addition, the birth history rates consistently show early fertility, peaking at 20-24. The ownchildren estimates demonstrate a similar pattern with 1998 and 2003 DHS. However, we see a broad-peaked fertility at age 20-29 with 1989 DHS and a late peak at age 25-29 with 1993 DHS. Thus, the pattern depicted by the own- chi ldr en me thod i s inconsistent, and could be the result of assigning more children to older women at the expense of younger ones, as noted later in this paper. This is a regular feature of the own-children method, so these results are similar to other findings. In Figure 10 we show the ratios of the own-children (numerator) to birth history (denominator) TFRs for the year before the survey, and the 0-4, 5-9, and 10- 14 years before the survey. A “score” of 100 would indicate that the TFRs were the same using both methods. Evidently, the ownchildren rates are lower for the year before the survey for all four surveys. However, the rates are more or less the same for the periods 0-4, 5-9, and 10-14 years, save for the 1998 survey where the own-children rates are slightly higher, most likely because of over-matching to older mothers in the own child method. Discussion This study revisits the Kenyan fertility transition based on insights from the own-children technique. In particular, it reviews features of the fertility transition that could not be teased out with conventional methods. Kenya is an obvious choice for this study because of the heightened interest that the delay in the onset of the transition generated among researchers and policy makers. Further, Kenya has a wealth of regularly collected census and demographic survey data, which augurs well for the applying the own-children method and then analyzing the results. Rather than focus on a full explanation of the observed patterns, we seek to dwell on the aspects that would e n c our a g e t h e us e a nd fur t h e r development of the own-children method. The study corroborates findings from previous studies using conventional methods that fertility in Kenya increased from a little more than 6.0 in the 1950s and 1960s to about 8.0 during the late 1970s, before declining to about 6.5 in the late 1980s, and further to about 5.0 by the end of the 20th century. Although the decline, first observed from the preliminary results of the 1989 KDHS, was celebrated as the most precipitous ever recorded (Brass and Jolly, 1993; Cross et al., 1991; Kizito et al., 1991), our findings indicate that the pace of decline accelerated from the early 1990s. Generally, good agreement exists between census and survey estimates where they overlap. The superior matching in surveys seems offset by the strength of number in censuses. The single year estimates are characterized by fluctuations, mainly reflecting misreporting of children's ages, especially in censuses. Theoretically, misreporting of women's ages should introduce less error in the own-children fertility estimates, especially if grouped data are used (Cho, Retherford and Choe, 1986). In practice, however, some biases do occur, particularly if the pattern of age misreporting in children is systematically and positively correlated with that of their respective mothers, which might result in spurious trends (Retherford and Mirza, 1982). The census estimates decrease much more rapidly close to the census date, giving a rather false impression of a faster decline during that period. This phenomenon is most noticeable for the 1999 Census where the TFR estimated for the five years immediately before the census is implausibly low. Kenyan censuses have perennially underenumerated young children (ROK, 1996; ROK, 2002), although under-reporting is a less serious source of error than age misreporting (Cho, Retherford and Choe 1986). The own-children method does not show significant changes in the fertility schedule among Kenyan women. The birth history technique is more consistent in this regard, showing that the onset of childbearing is still fairly early. Hence, the Kenyan fertility transition is driven by the“ stopping behavior” rather than “delayed onset of reproduction”. This study also shows that the transition is universal among differential sub-groups. However, it also highlights differences with regard to the onset and pace of transition. First, a clear difference in the onset of the transition is discernible among the regions. It was earlier in central Kenya compared to western Kenya and the coast. No clear cut differences in onset are observed by place of residence, education, and wealth. Secondly, the pace of decline was faster in western Kenya, among rural residents and women with some secondary education, and among households in the middle wealth category, compared to their complements. Lastly, the sub-group differentials narrowed remarkably over time. These patterns are consistent with fertility theories. Fertility transitions all over the world are often initiated by the more “modern” sub-groups, and then spread, through “leads and lags”, to the less modern sub-groups where it proceeds faster (Bongaarts and Watkins, 1986; Notestein, 1953; Coale, 1973). Thus, once initiated, transitions tend to proceed faster in areas where fertility was once high. We can then argue that urban, educated, and wealthy women already had low fertility and, therefore, had not much incentive to limit their fertility even more at this early stage of the transition. However, once the ideational changes in family formation took root among the populace, Coale's (1973) the three prerequisites for fertility decline, being able, willing and ready, were largely satisfied, leading to more effective practice of family size limitation. Finally, recent studies suggest a stall in the Kenyan fertility decline at about 5 children per woman (ROK, 2002b, ROK, 2004; Bongaarts, 2005; Blacker et al., 2005). Although our analysis tends to confirm the stall, the own-children method fails to present us with conclusive evidence on this phenomenon because of its inherent inefficiency to give reliable trends for the most recent periods (see also McDevitt and Johnson, 2005). Therefore, a more conclusive picture regarding this phenomenon will probably emerge from the 2008 KDHS and 2009 Population Census data. Conclusions This study finds several trends regarding the Kenyan fertility transition: First, Kenyan total fertility increased from a little more than 6.0 in the 1950s and 1960s to about 8.0 during the late 1970s, before declining to about 6.5 in the late 1980s and to about 5.0 in the late 1990s. Secondly, the fertility transition appears to have been well underway in Kenya by early 1980s, rather than the mid- and late-1980s suggested elsewhere. The fertility transition in Kenya is largely driven by“ stopping behavior”, through family size limitation facilitated by contraceptive use, rather than by delayed onset of reproduction. And, although the decline first observed in 1989 was regarded as the most precipitous ever recorded, our findings show that the decline was more rapid beginning in the early 1990s. Finally, while the transition started earlier in central Kenya compared to other regions, no clear-cut differences were observed by socio-economic characteristics. However, the pace appeared faster in western Kenya, and among rural dwellers, women of average education, and households of middle wealth category, as opposed to their complements. This resulted in the narrowing of differentials over time, consistent with theories of fertility decline. In sum, the own-children method of fertility estimation is a very useful tool for studying fertility patterns. Even in contrary circumstances, the method can provide reliable and more revealing results than the conventional methods. The method is extremely useful in determining long-term, detailed trends when a variety of fairly accurate data sets collected at regular interval are available. For policy makers, the trends are important because the detailed, year-by-year results allow for greater precision in specific retrospective trends, particularly in smaller geographic areas, and in selected populations, for prospective use. These data permit better planning for additional schools and classrooms, health clinics for mothers and children, needed recreational facilities, and other social priorities. References
© Copyright 2008 - Union for African Population Studies The following images related to this document are available:Photo images[ep08011f5.jpg] [ep08011f2.jpg] [ep08011f7.jpg] [ep08011f6.jpg] [ep08011f10.jpg] [ep08011f1.jpg] [ep08011f3.jpg] [ep08011f8.jpg] [ep08011f4.jpg] [ep08011t1.jpg] [ep08011t2.jpg] [ep08011f9.jpg] |
| |||||||||