 |
| About Bioline | All Journals | Testimonials | Membership | News |
|
||||||
|
||||||
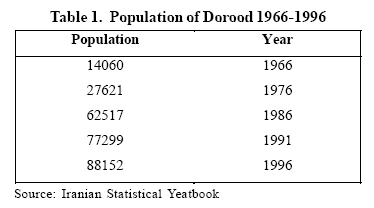
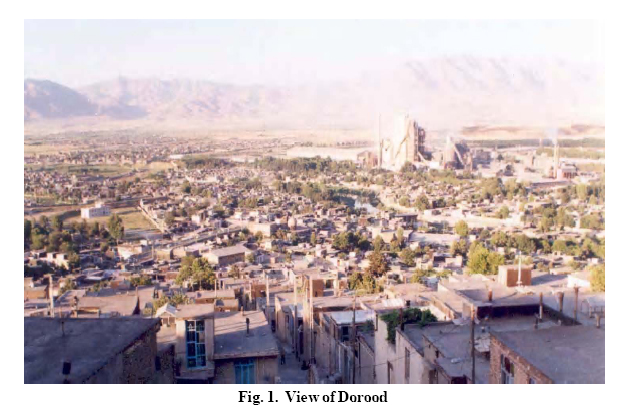
International Journal of Environmental Research, Vol. 1, No. 3, 2007, pp. 218-230 Sustainable Urban Growth Management Using What-If? Asgary, A.1*, Klosterman, R.2 and Razani, A.3 1Atkinson Faculty of Liberal and Professional Studies, York University, Toronto, Canada *Corresponding author: Email-asgary@yorku.ca Received 20 Dec. 2006; Revised 20 March 2007; Accepted 15 May 2007 Code Number: er07028 ABSTRACT This paper examines the application of a GIS based planning support system, What If?TM, to evaluate alternative growth policies for sustainable urban growth in a rapidly growing city of Iran. The paper describes the study area, Dorood city, and the What If? Model. It then explains the procedures that were used to obtain the required data and to run the model to Dorood city. The paper concludes by considering the results and implications, which the study has for urban growth management of the city to preserve farmland and accommodate growth in the city. Key Words: Sustainable Urban Growth, What-If? Planning Support Systems, Dorood City,Iran INTRODUCTION Population growth in urban areas increases the pressure for urban sprawl and this expansion usually happens in agricultural lands encircled the cities. It has increased the planners environmental and sustainability responsibilities to guide developments in a manner to reduce the pressure on agricultural lands. On the other hand allocation of scarce land resources to urban uses should follow certain roles to be able to satisfy different competing uses while creating a balanced and equitable use of these resources to achieve social goals of sustainability paradigm. In practice, land use planning is the fundamental part of physical planning and the success and failure of all future plans and policies depends on that. In such conditions, the conventional incremental planning tools are not sufficient for analyzing and responding the current complex situations. In other words, with increasing urban sprawl and the need for sustainable urban growth, it is clear that policy on its own is not enough and urban growth management using sustainability principles should be applied. The implementation of sustainable urban growth is viewed as the answer to reducing, or at least controlling, sprawled development. In addition to slowing the loss of farmland, open space and irreplaceable natural resources, sustainable urban growth policies direct development towards existing communities already served by roads, sewer systems and other infrastructure. Preventing low-density urban growth on the urban–rural fringe are thought to support sustainable urban growth through various ways. It results to more efficient use of land and less pressure to convert habitat and farmland to urban uses. It reduces car use and commuting distances through associated reductions in greenhouse gas emissions and air pollution) by bringing origins and destinations closer together and by making public transit more economically viable. This policy also reduces the consumption of water and energy, which is typically higher in low-density districts due to higher heating and cooling costs for singlefamily homes and excess water use on lawns, gardens and cars. More importantly, it provides greater efficiencies in the provision and use of infrastructure systems, which are costly and consume energy and raw materials through their manufacture and emplacement. Road infrastructure also reduces soil permeability and contributes to flooding (Alexander and Tomalty, 2002). Five critical elements of an sustainable urban growth management strategy can be considered as 1) Collaboration, co-ordination and leadership among and between governments 2) The introduction of new tools and resources and the innovative application ofexisting tools to effectively guide growth; 3) The use of public investment and incentives to leverage market forces; 4) Thinking, planning and making investment decisions based on immediate needs and 50-year timeframes; and 5) The creation of a broad base of understanding and support for managing growth. Legislative requirements and popular concern with issues of unsustainable urban growth, the loss of open space, and environmental degradation are creating a demand for models that can consider the potential impacts of alternate growth management policies. And popular demand for direct involvement in the policy-making process is creating a need for easyto-use and - understand models that will allow nonprofessionals to address issues of local concern. This paper will describe the use of What if? TM , to consider alternative policies for preserving open space in a rapidly urbanizing city in the Lorestan province of Iran. What-If is among the newly developed and progressive PSSs that is based on current knowledge of land use planning. While, its approach is promising, the software is in the first stages of development and so far only limited application of the software has been reported (Klosterman, 2000). This paper presents the first application of What-If GIS based PSS in Iran and probably developing countries. This application of What-If was conducted for Dorood city, a medium city with rapid population growth in western part of Iran. The aim of the study has been to use What-If for finding the future direction of city growth so as to minimize its impacts on agricultural lands surrounded the city according to sustainable urban growth principles. The rest of this paper is organized as follow. Section two briefly illustrates the What-If? model and software components. Section three provides some background information about Dorood city and its growth issues. In section four the data used in the study will be discussed. Section five shows the application of What-If for the study area and its basic findings on land suitability analysis. Section six shows the results of land demand analysis . What-If is a GIS based planning support system which uses GIS data and analytical and map generation tools to produce different land use scenarios based on theoretically accepted planning methods. Although GIS by itself provides an adequate base for urban planning and management, but conventional GIS softwares hardly handle planning tasks. In other words, GIS mapping concepts are insufficient for building PSSs (Hopkins, 1999), but GIS have become a useful component and an integral part of PSSs, which tend to incorporate modelling procedures (Harris 1999; Kammeier, 1999), expert systems (Edamura and Tsuchida, 1999; Shi and Yeh 1999), databases, decision trees, computer aided design or CAD (Alley, 1993; Schuur, 1994; Ranzinger and Gleixner, 1997), hypertext (George, 1997), mapping (Singh, 1999), user interfaces for public participation (Shiffer, 1992), virtual reality, and World Wide Web (Doyle, et al., 1998; Heikkila, 1998). Development of PSSs includes integration of GIS with other technologies (hypertext, groupware, audio/visuals, multimedia, models, simulations, expert systems, etc.). To enable prediction of urban phenomena and processes, GIS software must allow for modelling procedures to run within its environment. This is, incidentally, one of the most frequently cited deficiencies of GIS (Harris and Batty, 1993). Predictive modelling is usually performed outside GIS and loosely coupled to the system via programming procedures. Embedding of urban models within GIS has been attempted in advanced researchprojects (Batty and Xie, 1994), but has not become part of commercial GIS software. Esnard and MacDougall (1997) maintained that there is a common ground for integrating planning theory and GIS in data creation, analysis, and presentation. What-if has been developed using the above ground by realizing the relationship between planning theory and methods and geospatial technologies. What-if developers have tried to build and implement tools that are suitable to planning practice. Landis’ (1994, 1995) California Urban Futures Model, Landis, et al., (1998)California Urban and BiodiversityAnalysis, and Klosterman’s (1999) “What if?” are probably the three most comprehensive attempts to date in simulating land use scenarios resulting from given demographic and economic trends, environmental constraints, and urban development policies. The progress in modelling land use change in particular is impressive (Matheny, et al., 1999), but yet to gain usability and acceptance in planning agencies at various levels of government. As its name suggests, What if? does not attempt to predict future conditions exactly. Instead, it is an explicitly policy-oriented planning tool that can be used to determine what would happen ifpolicychoices are made and assumptions concerning the future prove to be correct. Policy choices that can be considered in the model include the staged expansion of public infrastructure, the implementation of land use plans or zoning ordinances, and the establishment of open space protection programs. Assumptions for the future that can be considered in the model include future population and employment trends and anticipated development densities (Klosterman, 1999; Klosterman, 2001). What if? projects future land use patterns by balancing the supply of, and demand for, land suitable for different uses at different locations, subject to user-specified policies for allocating the projected demand to suitable locations. Alternative visions for an area’s future can be explored by defining alternative suitability, growth, and allocation scenarios. The assumptions underlying scenarios can be easily modified to incorporate the full range ofalternative visions for an area’s future. Basically, What if? begins with homogeneous land units or uniform analysis zones (UAZs), applies alternative policy choices to these units, allocates projected land use demands to them, and then derives regional conditions (e.g., population and employment growth trends) by aggregating the values for these land units. UAZs are GISgenerated polygons which are homogeneous in all respects considered in the model. Therefore, all points within a UAZ have the same slope, are located in the same municipality, have the same zoning designation, are within the same distance of an existing or proposed highway, and so on. UAZs are created using different GIS functions to generate adequate layers and combine all of the relevant layers of information on natural and man-made features to define the UAZs that are used in a study area. The map layers can contain information on natural conditions (slopes, soils, and scenic, …), existing and proposed infrastructure (the proximity to intersections or major roads and the availability of sewer and water service and land use controls (zoning districts and planned land uses). The UAZs contain information which was provided in each of the constituent layers, i.e., each UAZ contains information on the slope, the availability of sewer and water service, planned land use, and so on for all points lying inside of it. As will be described in detail below, What If? projects future land use patterns by balancing the supply of, and demand for, land suitable for different uses at different locations. Alternative development scenarios for a city’s future can be discovered by defining alternative suitability, growth, and allocation assumptions. The results generated by considering these alternative scenarios provide concrete and understandable expressions of the likely results of a scenario’s underlying policy choices and assumptions. For instance, What-If might show that there is insufficient land simultaneously to accommodate high growth, low residential densities, and strict agricultural protection policies, forcing the community to choose between highly desirable, but inconsistent, policy goals. What If? is the most appropriate tool for areas that are experiencing, or anticipating, rapid urbanization and the associated problems of traffic congestion, inadequate public infrastructure, and the loss of agricultural and open land. Areas that are currently undeveloped and will remain so in the future have few impacts and policy options to consider. What If? has been developed using Microsoft’s Visual Basic and the Environmental Sciences Research Institute’s (ESRI) MapObjects GIS component software. However, it is unique in providing a portable system which can be adapted to any city’s GIS data and policy issues. The objectives of What-If are 1) planning support systems to support traditional planning activities such as land use planning and urban modeling and emerging modes of collaborative planning, 2) creates alternative visions for the future in dependence of local land development policies. What if design is similar to the first California Urban Futures (CUF) model (Landis, 1994; Landis, 1995) and similar models such as the San Diego Association of Governments Sophisticated Allocation Process (SOAP) model (San Diego Association of Governments, 1994). What-If modeling approach is based on a bottom up model. It has three different modules: land suitability analysis, for defining and weighting of factors for each land use type as well as allowed land use conversions, project future land use demand interactive definition of alternatives and scenarios, and allocate most suitable locations by combining results of land suitable analysis and projection of future land use. What-If has a vector-based GIS framework. To run What-If one needs data on urban land use (residential, commercial, industrial), digital elevation model (DEM), socioeconomic data (tabular data for every land use category), residential (intensive households parameters), commercial/industrial( e.g. employment vacancy rates), transportation infrastructure. What-If makes 25 years prediction in a 5-10 years time step, for maximum of 5 periods. Dorood as a city has a history of 80 years. It is located beside two rivers (in Persian Dorood means two rivers). The growth of the city happened just after the railway passed through the area in 1937. Establishment of a cement factory and a defense manufacturing facility later contributed to the growth of city. During the early periods the city has expanded towards the western side of its original site. However, recent developments have occurred mostly on the north-east side of the city. Dorood is the center of Dorood county and has about 80 kilometers distance from KhoramAbad, the center of province, Lorestan. Average temperature is 14 °C in Dorood area. The average annual rainfall is estimated about 562 millimeter and average humidity is 48 per cent. Dorood is located within the high earthquake hazard in the area and the country. The wind direction is from the south west to the north east. The city is constrained by mountains and rivers. The population of the city in 1966 has been 14060 which has significantly increased during the past decades. In 1996, the population of the city reached to 88152 and estimated to be more than 100000 in 2001 (Table 1). The family size ranges between 5.3 to 5.6. Population growth rate has been %2.6 per year during the past two decades. Natural population growth as well as migration from rural areas are the main contributors to the city’s population growth. In 2001 the total area of the city was about 1325.7 hectares with population estimated around 100462. Gross population density was 76 and net density was about 483 person per hectare. Physical development of the city as well as its culture have been very much influenced by the railway, the cement factory and the defense manufacturing facility. In 1996, there has been 15006 employment in the city from which 3.2 percent in agriculture, 44.8 per cent in industries and 52 per cent in service sectors which shows Dorood as an industrial city serving the regions as well as its own population (Table 2). Fig 1 View of Darood Table 2. Employment in Dorood 1986-1996
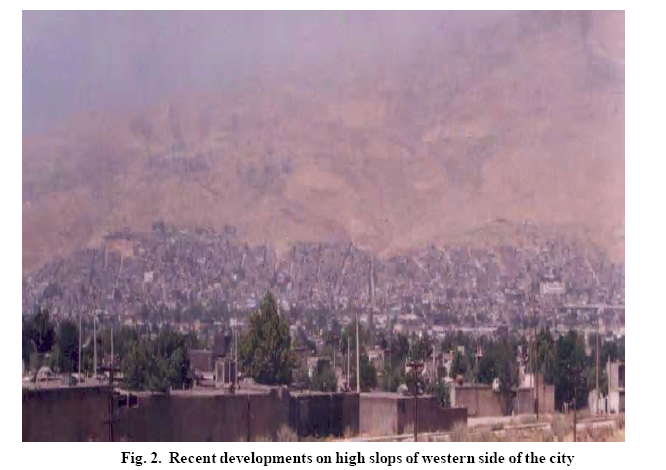
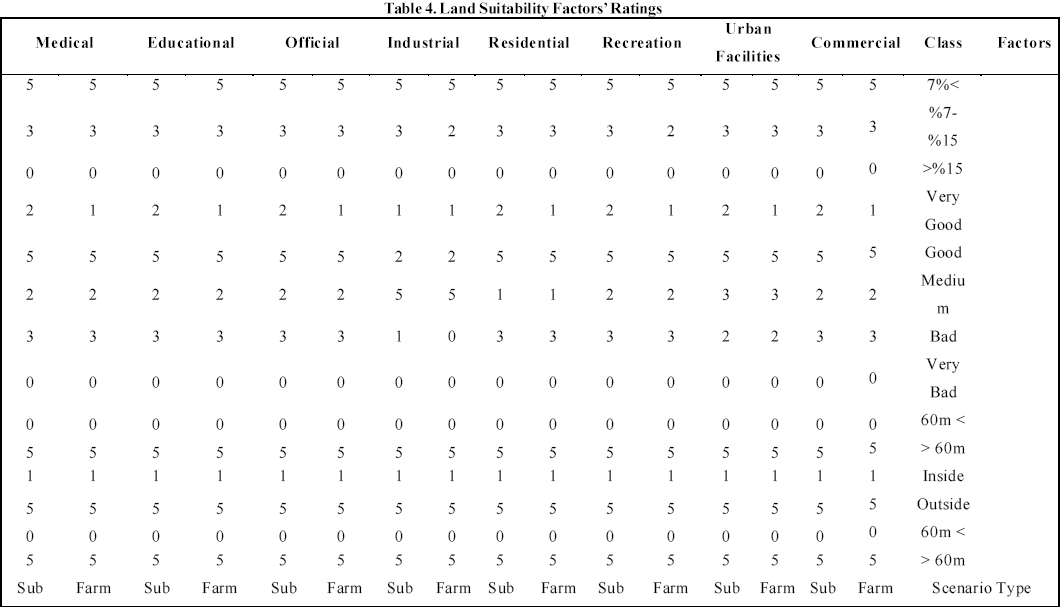
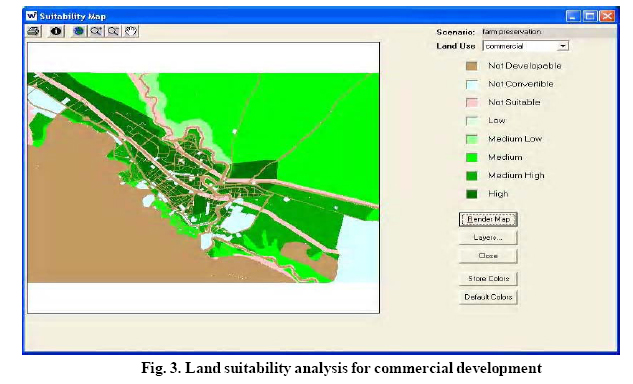
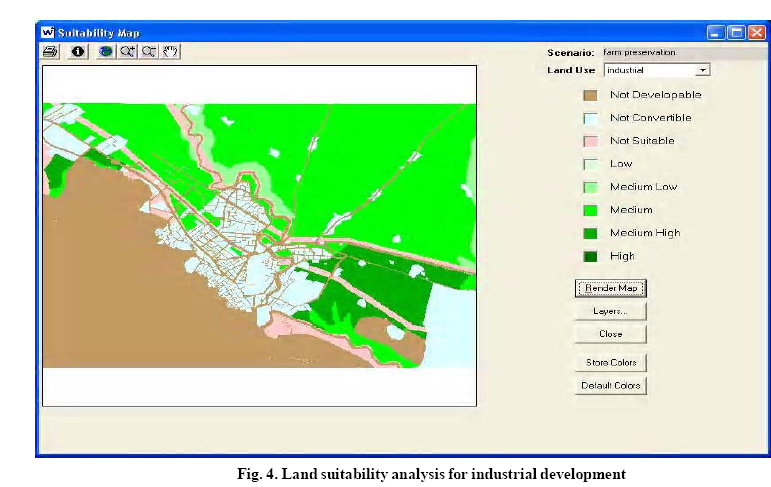
Population growth has increased pressure on agricultural land around the city which needs adequate response from planning side. Recent population growth of the city has increased pressures on its limited agricultural lands. Constrained by mountains, rivers and industrial pollution from different sides, agricultural lands are the main available lands for urban development. Planners and policy makers are concerned with further development of city towards the agricultural lands. 4. GIS Layers and DataWhat-If requires four main types of data for a given study area. 1) current land uses. 2) maps of land suitability factors (slopes, soils, floodplains, and so on) in the study area. 3) projections for the area’s future residential population and employment are required to project future land use demands. 4) land use control policies (such as land use plans, zoning ordinances, or infrastructure expansion plans). The procedures used to obtain each of these kinds of data for Dorood city are described briefly below. Land Use MapLand use map: any projection for the future must be based on the present and the past. As a result, the first piece of information required to project the city’s future land use patterns was a GIS layer showing the city’s existing land use patterns. Land use layer for this study was indirectly produced based on a 1/25000 land use of the area prepared for city master plan and a recent thematic map of the city and its surrounding providedby theIranian Survey Organization(ISO). However, field investigation was carried out to update the maps. In this layer, land use of the area classified into 15 groups. Land suitability MapsLike most medium and small cities, Dorood does not have a detailed parcel-level GIS system, significantly limiting the availability of digital spatial information. Fortunately, recent national survey of Iran had been finished for the province and the city. It provided an adequate source of digitized data for the study area at 1/25000 scale. This allowed the following suitability factors to be considered for Dorood: slopes, agricultural soils, 25 years flood plains, power lines, and rivers. Slope Map: This layer was produced using 1/ 50000 and 1/25000 topographic data available for the study area. A TIN model was created and “Derive Slope” command in Arcview Spatial AnalystTM extension was used to create the slope map. In this study four classes of slopes were utilized: 1) less than 7 per cent, 2) 7 per cent to 15 per cent, 3) 15 per cent to 30 per cent, 4) more than 30 per cent. Soil Type Map: This layer was produced based on a paper map for soil types already created by Emko Planning Consultants for the study area. Based on this map attempts were made to identify areas that had slight, moderate, or severe limitation for agricultural use. Soils were classified into five types based on their suitability for agriculture: 1) very good soils, 2) good soils, 3) medium soils, 4) unsuitable soils, 5) rocky and sandy soils. River Buffer Map: This layer was produced using Arcview 3.2 buffer analysis on two rivers crossing the city. We considered 60 meters buffer distance from each river, according to the physical conditions, experts’ opinion and river regulations for the area. Therefore, the area was divided into those within 60 meters of the rivers and those outside 60 meters distance from the rivers. Power lines buffer Map: ISO data were used to create power lines buffer. This layer was another 60 meters buffer zone on power lines layer. Existence of rail stations, cement factory and defense manufacturing facilities has created major need for electricity and thus power lines. 25-Year Flooding Potential Map: This layer was produced using topographic map of the area and the maximum water levels of the rivers during a 25-year flooding. According to the previous studies done in the region each 25 years there is a flood potential which increases the water level by 4 meters. Considering the slope of the rivers basin in the eastern side (3 per cent) and in the western side (4 per cent), it was calculated that water level at its maximum will cover up to 333 meters in the eastern side and 250 meters in the western side of the rivers. Land use control and Display MapsLand Use Control Map: This layer was produced based on regional policy, which divided the land into three categories as: lands suitable for agriculture, lands suitable for urban development and undevelopable lands. Existing and Future Water Supply Map: The current water supply network, the service area and areas outside the service area used for water supply layer in this study. The service area is the area that water network will cover it within the next few decades. It is usually determined by the regional water company responsible for water supply. Census Tracts Map: According to the Iranian statistical Center (ISC), city is divided into two census tracts. It is also used by city’s municipality as administration districts and service delivery. Concentric Growth Map: This layer was produced using the existing city center and buffer analysis around the city center. We considered 1500 meters for each circle. Radial Growth Map: This layer was created based on the existing and future roads of the city. We used a 100 meters buffer along the major roads. UAZ Map: Arcview overlay command was used to combine the existing land use map and the suitability map layers into a singleArcview shape file. The shape file contained a large number of irregularly shapepolygonscalled “uniform analysis zones” (UAZs). The UAZs were uniform internally with respect to all of the factors considered in the model, i.e., all points inside a UAZ have the same current land use, the same slope, the same soil type. These small polygons, which ranged in size from one-half hectare to several hectares in size, comprised the spatial units for which the suitability analysis was conducted and future land use patterns were projected. During the UAZs production many small polygons were generated. Arcview scripts and ArcInfo commands were utilized to eliminate these small polygons. Display Maps: Display layers are not used in the analytical parts of the What-if?, but they arehelpfulfor visualizationof the area. We created 5 display layers: rivers, power lines, major roads, all roads, city boundary. 5. Application of What IfDetermining land use suitability is the first stage in the What if? application. To do this stage, several four steps must be taken: (1) identifying suitability the factors, (2) specifying the suitability factor weights, (3) specifying the suitability factor ratings, and (4) specifying the permissible land use conversions. In this study 5 factors were used for suitability analysis for all 8 land use types: slope, soil, 25 years flood plain, river buffer, and power line buffers. Although it is very ideal to add some more factors in the suitability analysis, but the data and their accuracy is very important. For most cases at least at this time necessary data for including further number of factors are not available. For factor weights this study used the weights given in Table 3 based on previous studies. For determining factor ratings a mini Delphi expert approach was employed. Table 4 shows the factor ratings used. The fourth suitability step in What-if model is the specification of land uses that may be converted from their current use to another use as a result of the projection process. In this study no land uses were identified for conversion. Therefore only undeveloped lands were available. After providing all necessary information for suitability factors in the above four steps, what-if performed land suitability analysis for each land use categories in the study area and presented the results in a GIS layer for each land use. The maps show each location’s suitability for each land use on a scale from “not considered” and “unsuitable” to “high.” What-If? also provides land suitability reports. Fig 3 and 4 show the land suitability analysis for the study area for commercial and industrial development. Table 3.Land Suitability Factors’Weights
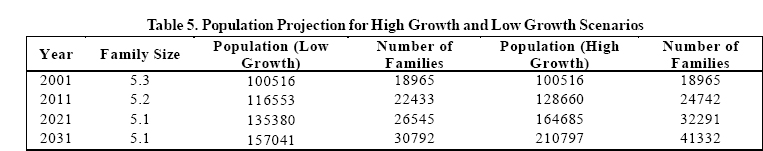
The second phase of What-If? Application is to calculates the demand for land by converting the five main categories of land use demand; residential, industrial, commercial, preservation, and locally-oriented uses, into the equivalent future land use demand. In this study demand for land for different land uses were predicted for both “low growth”, and “high growth” scenarios as defined in What-If?. For low growth the minimum growth of 1.5 per cent population growth and for the high growth, 2.5 per cent growth were assumed. Under these assumptions, the city’sresidentialpopulation would grow from 100516 in 2001 to over 157041 in 2031 in low growth scenario and to 210797 in high growth scenario (Table 5). To predict demand for residential lands first number of households for each of the time periods was estimated. To estimate demand for residential land assumptions were made on: types of new houses, residential density, average number of persons per house (5.2), vacant homes. The demand for non-residential (e.g., industrial, retail, and office uses) in What-If is derived from user-specified values for the projected employment in each year and the assumed employment densities for each nonresidential use. To estimate employment growth in industrial sector in the city for low and high growth, 3.5 and 5.5 per cent were applied respectively. For commercial and office sectors growth rates of 2.5 and 3.5 were used for low and high growth scenarios (Table 6-8). Therefore, employment would grow from 15006 in 1996 to 31718 at low growth scenario and to 56658 at high growth scenario in 2031. What-if allows the planners or decision makers to specify the amount of land that should be set aside for local land uses (e.g., local retail and neighborhood parks) in each projection year based on the per capita measure. Table 6. Employment in the city 1986 and 1996
Table 7. Employment Projection for Dorood in LowGrowth Scenario
Table 8 . Employment Projection for Dorood in HighGrowth Scenario
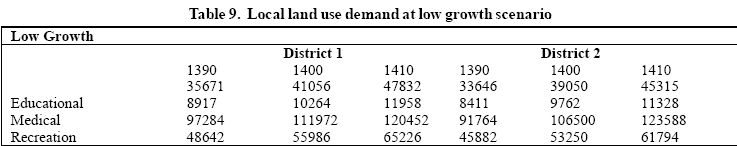
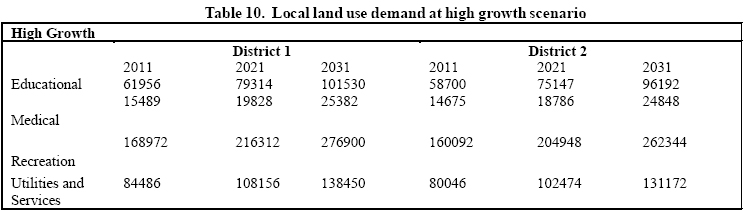
Local parksand recreational activities, cultural and religious centers, educational, medical, and urban facilities are among the most important local uses. Iranian standards for small cities per capita local land uses (Table 9,10) were used in this part. The third phase of What if? Application is projecting the future land use patternsbyallocating the projected land use demands, to different locations on the basis of their relative suitability, as defined by the assumptions in a user-selected suitability scenario. What If? generates a series of maps showing the projected land use patterns in each projection year. It also generates reports showing the projected land use in each projection year and the assumptions that underlie a scenario. Two public policies for preserving farmland in Dorood were considered. The first assumed that policies would be enacted which prohibited development in areas with good agricultural soils, close to power lines, within the 25-year flood plain, or near rivers. This “Preservation” policy was incorporated intothe suitabilityportionof the model by assuming that prohibited residential and nonresidential development is prohibited inalllocations that either: (1) had soils with slight limitations for agricultural uses; (2) were located in the 25-year flood plain; (3) were located within 60 meters of power lines; or (4) were located within 60 meters of a river and (5) were located near the rivers. Development of the city was also forbidden in areas with high slopes. The alternative “Development” policy did not consider the environmental impacts of development and prohibited development only in areas with high slopes. The second “Growth Controls” policy assumed the city enacted a growth policy which limited development to areas that have public water and sewer service. In the land allocation section of this study four scenarios were considered.
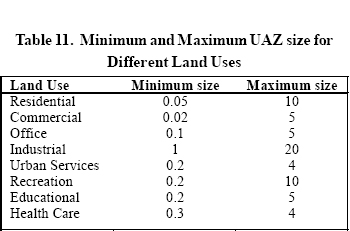
What-if requires researcher to determine the allocation order for land uses. In his study residential, commercial, office, and industrial land uses were given first to four priority respectively. During the allocation process infrastructure and land use controls (e.g. infrastructure plans, road networks) can be added to the analysis. If no land use control is considered, what-if will continue theallocation process only based on land suitability, demands and allocation order. Also, user should determine the minimum acceptable UAZ size for each land use. The minimum UAZ size prevents the allocation of small UAZs to land uses, which needs a larger minimum lot sizes. For example industrial activities need larger parcels of land compared to residential land uses. Table 11 shows the minimum and maximum UAZ size for different land uses applied in land allocation process in this study: The third phase of What if? Application is projecting the future land use patternsbyallocating the projected land use demands, to different locations on the basis of their relative suitability, as defined by the assumptions in a user-selected suitability scenario. What If? generates a series of maps showing the projected land use patterns in each projection year. It also generates reports showing the projected land use in each projection year and the assumptions that underlie a scenario. Two public policies for preserving farmland in Dorood were considered. The first assumed that policies would be enacted which prohibited development in areas with good agricultural soils, close to power lines, within the 25-year flood plain, or near rivers. This “Preservation” policy was incorporated into the suitability portion of the model by assuming that prohibited residential and non-residential development is prohibited in all locations that either: (1) had soils with slight limitations for agricultural uses; (2) were located in the 25-year flood plain; (3) were located within 60 meters of power lines; or (4) were located within 60 meters of a river and (5) were located near the rivers. Development of the city was also forbidden in areas with high slopes. The alternative “Development” policy did not consider the environmental impacts of development and prohibited development only in areas with high slopes. The second “Growth Controls” policy assumed the city enacted a growth policy which limited development to areas that have public water and sewer service. In the land allocation section of this study four scenarios were considered.
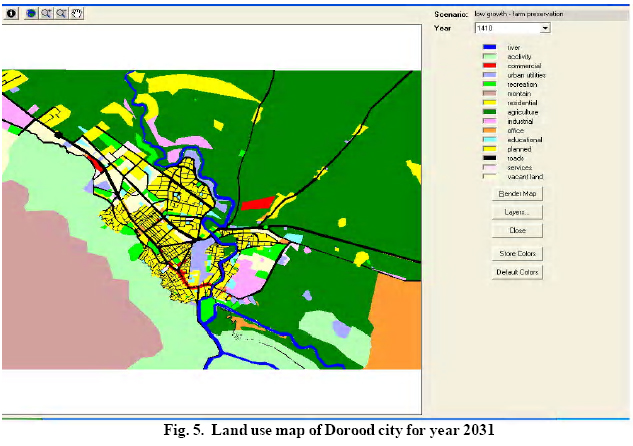
What-if requires researcher to determine the allocation order for land uses. In his study residential, commercial, office, and industrial land uses were given first to four priority respectively. During the allocation process infrastructure and land use controls (e.g. infrastructure plans, road networks) can be added to the analysis. If no land use control is considered, what-if will continue theallocation process only based on land suitability, demands and allocation order. Also, user should determine the minimum acceptable UAZ size for each land use. The minimum UAZ size prevents the allocation of small UAZs to land uses, which needs a larger minimum lot sizes. For example industrial activities need larger parcels of land compared to residential land uses. Table 11 shows the minimum and maximum UAZ size for different land uses applied in land allocation process in this study: The last part of what-if allocation model deals with growth type. allocation part and user can run the allocation for each of these. Fig 5. shows the land use map projected based on the Farm Preservation/Low Growth scenario of this study which was considered as desired development scenario. CONCLUSIONSTo application of What-If in the study area shows that city of Dorood has limited options for its future development. Most of its developable lands are also high quality agricultural lands. Two types of growth pattern, concentric and radial patterns exist in what-if lands are also high quality agriculturallands. City is constrained by high slope lands in most of the sides, and with agricultural lands in the other sides. Perhaps land preservation and low growth option provides a better future development scenario for the city. Scenarios developed in this study by means of What-If provide better and visible ideasabout the future sustainable development options for the city. As the basic motivation for this study was to assess the applicability of What-If in a very broad basis, it is obvious that if what-if? is used within a planning framework and institutional setting with enough recourses and data, useful information can be obtained from the software. This information is particularly useful for planners and decision makers of Dorood city who want to preserve the city’s agricultural lands while accommodating future growth to achieve sustainable urban development. The results of what-if model is almost similar to the suggested development areas in the master plan of the city. If other scenarios are selected for future growth of the city most of the farmland and prime farmland will be lost. Although what-if has not been specifically designed for sustainability assessment, but users can introduce their assumptions and indicators in various parts of the software. REFERENCES
Copyright 2007 - Graduate Faculty of Environment University of Tehran The following images related to this document are available:Photo images[er07028t10.jpg] [er07028f4.jpg] [er07028t5.jpg] [er07028t11.jpg] [er07028t8.jpg] [er07028t9.jpg] [er07028t7.jpg] [er07028t2.jpg] [er07028t6.jpg] [er07028f2.jpg] [er07028f1.jpg] [er07028t4.jpg] [er07028f3.jpg] [er07028f5.jpg] [er07028t1.jpg] [er07028t3.jpg] | |||||||||||||||||||||||||||||||||||||||||||||||||||||||||||||||||||||||||||||||||||||||||||||||||||||||||||||||||||||||
| |||||||||
