 |
| About Bioline | All Journals | Testimonials | Membership | News |
|
||||||
|
||||||
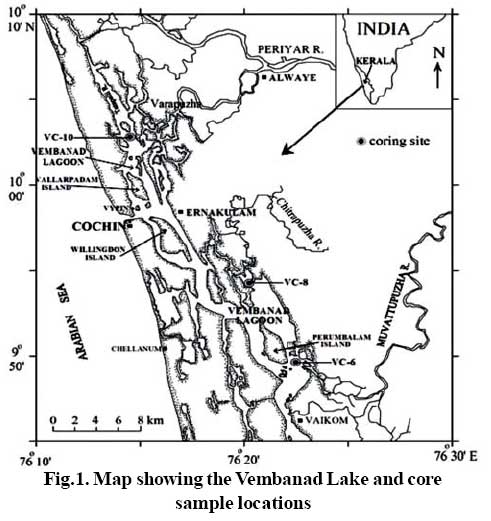
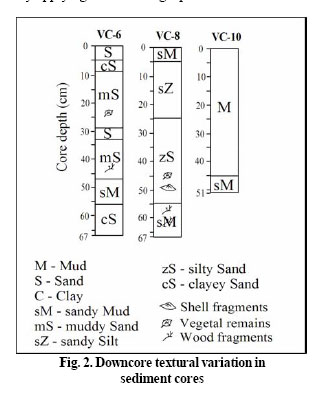
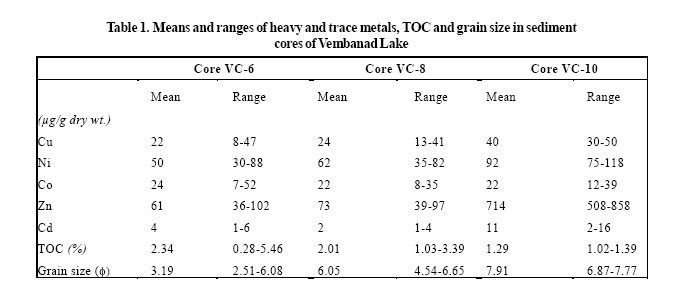
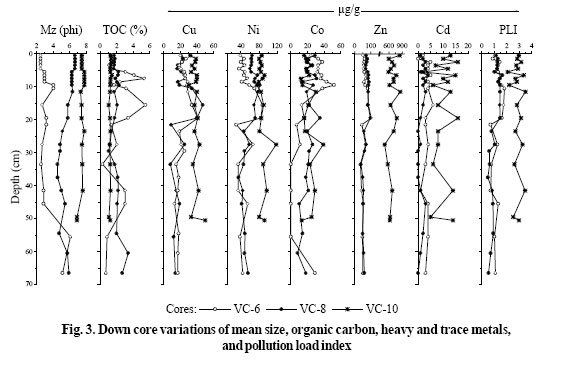
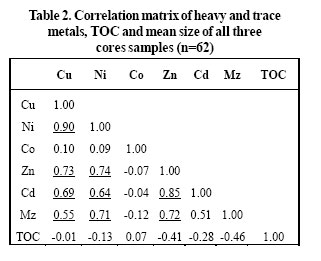
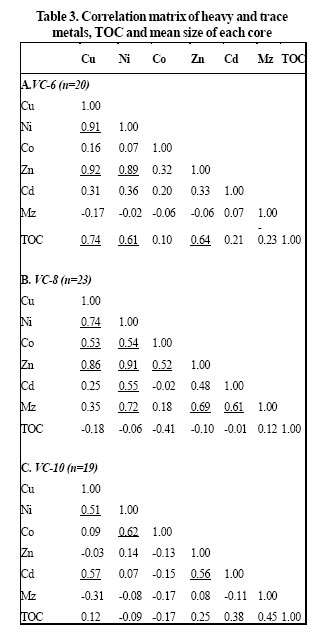
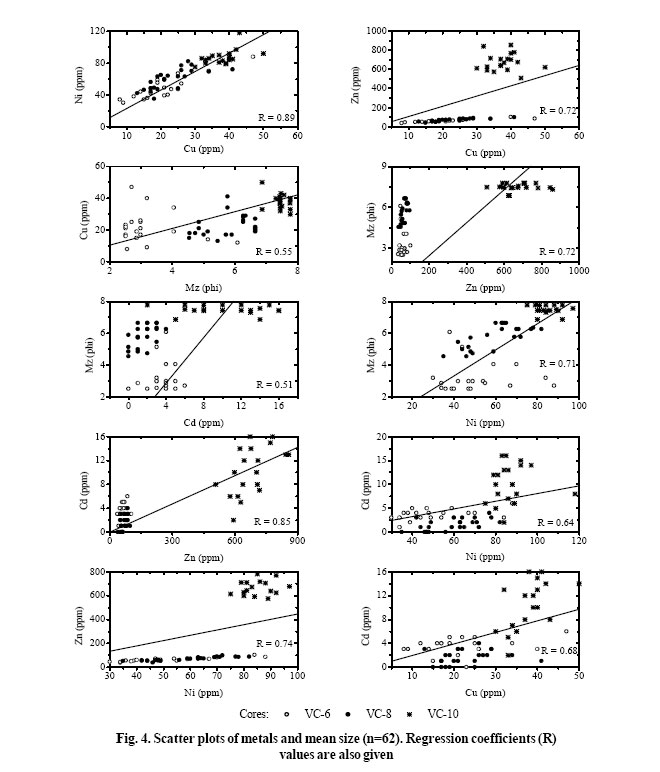
International Journal of Environmental Research, Vol. 1, No. 4, 2007, pp. 280-289 Heavy and Trace Metals in Vembanad Lake Sediments Priju, C. P. and Narayana, A. C.* Department of Marine Geology & Geophysics, Cochin University of Science & Technology, Cochin-682 016, India *Corresponding author: Email-a_c_narayana@yahoo.com Received 3 June 2007; Revised 30 July 2007; Accepted 20 Aug. 2007 Code Number: er07037 ABSTRACT Metal contents viz., Cu, Ni, Co, Zn and Cd in sediment cores recovered from the Vembanad Lake, the largest estuarine-lagoonal system on the west coast of India, were analysed to understand the pollution levels and the impact on the coastal environment. Of the three cores studied, VC-10 shown enrichment in all metals compared to other cores, as it is located in the vicinity of industrial area. Further, all the cores show enrichment of metals in the top 20 cm suggesting the increase of contamination in the recent past. Pollution Load Index increases from the bottom to the top of cores. Interrelationships of metals suggest the similar source for all the metals. The study suggests that industrial effluents are major source of metal enrichment in the lagoonal system. Key words: Coastal sediments; Heavy metals; Pollution load index; Vembanad lagoon, India INTRODUCTION Sediments of aquatic environment act as a major reservoir of metals (Caccia, et al., 2003), and also as a source of contaminants (Adams, et al., 1992; Burton Jr. and Scott, 1992). Enrichment of heavy metals due to industrialization and urbanization was recorded in sediments of coastal seas all over the world (Allen and Rae, 1986; Barcellos, et al., 1991; Birch, et al., 1996; Lottermoser, 1998; Gallasso, et al., 2000; Manta, et al., 2002; Feng, et al., 2004; Pekey, 2006). The monitoring of metal contents from anthropogenic activities is particularly important for the assessment of environmental quality and protection. Metal distributions in lagoonal and intertidal sediments have frequently been used to investigate chronological inputs (e.g. Owen and Sandhu, 2000; Spencer, 2002; De Carlo and Anthony, 2002) and spatial distribution of contaminants (e.g. Schintu, et al., 1991; Rubio, et al., 2000; Haynes and Kwan 2002; Daka, et al., 2003; Bertolotto, et al., 2005). Enrichment of heavy metals, radionuclides and radioactive pollutants is recorded in sediments of coastal areas like Bombay, Goa and Cochin because of industrialization. There are proposals to set up new industries in and around Cochin. In view of this, the present study is taken up to estimate the metal concentrations in the coastal area of Cochin. Studies on the trace element distribution patterns in the sediments of Vembanad lagoon are a few (Murty and Veerayya, 1981; Borakkar, et al., 1984; Paul and Pillai, 1986; Nair, et al., 1990; Padmalal, et al., 1997; Manjunatha, et al., 1998; Nath, et al., 2000). These studies were related to the spatial distribution of trace metal concentrations in surficial sediments. The present study deals with the spatial and temporal variations of trace metal contents, their controlling factors and an assessment of the pollution levels in the sediment cores of Vembanad Lake (lagoon), SW coast of India. The study focuses to test the hypothesis that concentrations of metals subject to anthropogenic inputs would increase in recent sediments as urbanization of the watershed continued to increase. Vembanad Lake (VL) is the largest lagoonbackwater system (length: 80 km; width: 0.5-4.5 km) on the southwest coast of India and floods an area of about 244 km2 encompassing the recent to sub-recent sediments. The Vembanad Lake is connected to the Arabian Sea at two places - one at Cochin (Fig.1) and the other at Munambam, (~25 km away from Cochin bar mouth) in the northern part of the study area. Seven rivers -Muvattupuzha, Minachil, Manimala, Pamba, Achankovil (in the south), Periyar and Chalakudi (in the north) - discharge in to VL. Chitrapuzha, a small stream, also drains into the central part of the lagoon. These rivers carry annually 7,32,560 MT of sediments in to the lagoon (Narayana and Priju, 2006). The study area and its vicinities are conspicuous with a number of industries. A large amount of effluents come from the industries viz., Fertilizers and Chemicals Travancore Ltd. (FACT), Hindustan Insecticides, Indian Rare Earths, Travancore Cochin Chemicals (TCC), Cochin Refineries Ltd and Zinc-Alumina ore smelting (Hindustan Zinc and Indian Aluminium Company). About 260 million m3/day of effluents from these industries are liberated into the Cochin backwaters. During the SW monsoon season (June-September), the rainfall exceeds > 300 cm and the influx of water and sediment into the lagoon is higher, whereas in the non-monsoon season, the river influx reduces and tidal influence gains momentum with an increase in salinity longitudinally leading tothe mixed typeof estuarine conditions in the Vembanad lagoon (Rasheed, et al., 1995; Priju and Narayana, 2007). The estuarine water gets diluted considerably near the Muvattupuzha river mouth in the south and at Periyar river mouth in the northern part during the monsoon. The salinity values range between 10 x 10-3 and 35 x 10-3 during the non-monsoon period and from 0 to 27 x 10-3 during monsoon (Balachandran, 2001). MATERIALS AND METHODSThree sediment core samples were recovered from the VL, close to the mouths of Muvattupuzha (core VC-6) and Chitrapuzha (VC-8) and Periyar (VC-10) Rivers (Fig.1). The mouth of Muvattupuzha River is a fluvial dominated environment whereas Chitrapuzha river mouth is a tide-dominating environment and influenced by petroleum refinery effluents. The northern part of the lagoon, the area of southern arm of Periyar River, is influenced by a large influx of industrial effluents, as major chemical industries (Fertilizers and Chemicals Travancore Ltd., Hindustan Insecticides etc.) and metal-processing industries (Hindustan Zinc Ltd., Indian Aluminium Ltd., Indian Rare Earths Ltd) are located alongside of the riverbanks. The sediment cores were subsampled at 1 cm interval. In total, 62 subsamples were analyzed for grain size, organic carbon and trace metal contents after drying the samples at 50°C in a hot air oven. The sediment grain size was analyzed using the procedure of Folk (1980) and sand-siltclay ratios were obtained. Lithologs showing the downcore textural variations are given in Figure 2. The total organic carbon (TOC) content in samples was determined using wet oxidation method (Gaudette, et al., 1974). Trace and heavy metals analyzed include Cu, Ni, Co, Zn and Cd. For the metal analysis, 0.5g each selected sample was digested using HF-HClO4-HNO3 acid mixture (Shapiro and Brannock, 1962), and the metal contents were determined with the help of atomic absorption spectrophotometry (Model-PE 3110). The precision and accuracy of the metal analyses were checked against the reference marine estuarine sediment, (MESS-1, NRC Canada) and it is found that all the metal estimations were in agreement with the reported values (95% confidence level). The range and average of metal contents are given in Table 1. The downcore variation of metal distribution is shown in Fig. 3. The heavy and trace metal contents, organic carbon and mean size of the samples were subjected to statistical analysis (correlation coefficient) to find out the interrelationships (Tables 2 and 3). Bivariate plots of metal contents were prepared and regression coefficients (R) were found out (Fig. 4). Tomlinson’s pollution load index (PLI) (Tomlinson, et al., 1980) of the sediment samples was calculated using the heavy and trace metal data and metal concentration for the world shale average (Wedepohl, 1971) as the background value. The PLI is obtained as a concentration factor (CF) of each metal with respect to the background value in the sediment (Angulo, 1996), by applying the following equation: Concentration Factor of the metal (CFmetal) = Concentration of the metal in the sample (Cmetal) / Concentration of metal in the background (Cbackground ) PLI = n√(CF1 x CF2 x …x CF n) The PLI represents the number of times by which the metal content in the sediment exceeds the background concentration, and gives a summative indication of the overall level of heavy metal toxicity in a particular sample. The concentration factor and pollution load index are given in Table 4 and Fig. 3. RESULTS & DISCUSSIONGrain size Most of the samples constitute muddy sand, sandy mud, silty sand and mud (Fig.2). In general, mean size of sediments varies from 2.51φ to 7.77φ with an average of 5.5φ. The average mean size (Mz) of sediments in cores VC-6, VC-8 and VC10 are 3.19φ, 6.05φ and 7.91φ respectively (Table 1). In VC-6, mean size ranges from 2.51φ (at 0-5 cm depth) to 6.08φ (at 55-56 cm depth). The upper part of the core dominantly constitutes sand (muddy sand alternated with sand) and the lower part is of clay. In VC-8, mean size ranges from 4.54 (at 33-34 cm depth) to 6.65φ (at 0-5 cm depth). The upper and lower portions of the core are constituted by sandy mud and sandy silt, and the rest is silty sand. The mean size of VC-10 varies from 6.87φ(at 49-51 cm depth) to 7.77φ(at 6-10 cm depth) and it mostly comprises of muddy sediments. Total organic carbon (TOC)In VC-6, organic carbon content ranges from 0.28% (at 33-34 cm depth) to 5.46% (at 15-16 cm depth), with higher content in the top (5-20 cm depth) and middle portions (40-45 cm depth) (Fig.3). It varies from 1.03 to 3.39% and shows an increasing trend downwards in VC-8. The organic carbon content is comparitively less (1.021.39%) in VC-10 (Fig.3). Heavy and Trace metalsThe average concentrations and down core variations of Cu, Ni, Co, Zn and Cd are presented in Table 1 and Figure 3. High contents of these metals are observed in the top 20 cm of all the core samples (Fig.3). The distribution and behaviour of each element is presented in this section. CopperOverall Cu content in sediments varies from 8 to 50 µg/g with an average of 27 µg/g. The average Cu contents in VC-6, VC-8 and VC-10 are 22 µg/g, 24 µg/g and 40 µg/g respectively (Table 1). The downcore variation of Cu in VC-6 and VC-8 shows a similar trend. Cu content in VC-10, located in the backwater region of industrial area, is higher (32 to 50 µg/g) compared to other cores and and is further high in the bottom portion of the core. Nickel Ni content varies from 30-118 µg/g with an average of 64 µg/g in the study area. The average Ni contents in VC-6, VC-8 and VC-10 are 50 µg/ g, 62 µg/g and 92 µg/g respectively. In VC-6, Ni content varies from 30 to 88 µg/g, and in VC-8 it varies from 35 to 82 µg/g. Both the cores exhibt similar downcore trend. In VC-10, Ni content is much higher than in other two cores and ranges from 75 to 118 µg/g. CobaltIn general, Co varies from 7 to 52 µg/g with an average of 22 µg/g. The average Co content in VC-6 is 24 µg/g, whereas in VC-8 & VC -10 it is 22 µg/g. Co content is higher at 15 cm depth of the core in VC-6 and is not detected between 33 and 56 cm depth. It doesnot show significant downcore variation in cores VC-8 and VC-10. Zinc Zn varies from 36 to 858 µg/g with an average of 253 µg/g in the study area. The average contents of Zn in VC-6, VC-8 and VC-10 are 61 µg/g, 73 µg/g and 714 µg/g respectively. In all the cores, higher content of Zn is observed in the top 25 cm depth. Zn content varies from 36 to 102 µg/g in VC-6 and 39 to 97 µg/g in VC-8 and shows a similar decreasing trend towards bottom of the core. VC-10 exhibits markedly high Zn values (508 - 858 µg/g)throughout thecore(Fig.3). Cadmium Cd content varies from 1 to 16 ppm with an average of 5 µg/g. The average Cd contents are 4, 2 and 11 µg/g in VC-6, VC-8 and VC-10 respectively. Generally Cd content is higher in the upper 20 cm of all the cores. In VC-6, Cd content varies from 1 to 6 µg/g, and in VC-8 it varies from 1 to 4 µg/g. However no Cd is detected in the middle portion (23 to 38 cm) of VC-8. The highest Cd content (16 µg g-1) is recorded in VC-10. There is a wide variation in downcore distribution of Cd values in VC-10 (Fig.3). Interrelationships of trace metals, organic carbon and mean size for the combined data of all the three cores are given in Table 2. Cu exhibits very good correlation with Ni (r = 0.90) and Zn (r = 0.73), and Ni with Zn (r = 0.74) and Mz (r = 0.71). Zn shows very good correlation with Cd (r= 0.85) and Mz (r = 0.72). A good positive correlation is also recorded between Cu and Cd (r = 0.69), Niand Cd(r= 0.64), Cd and Mz(r= 0.51). Co and TOC do not show any significant correlation with other heavy metals and Mz (Table 2). A correlation coefficient matrix for each core samples is shown separately in Table 3. In VC-6, good correlation is exhibited by the metals Cu and Ni with Zn (r = 0.92 and 0.89), and as Cu and Zn with TOC (r = 0.74 and 0.64). In VC-8, Cu exhibits a strong correlation with Zn and Ni (r = 0.86 and 0.74 respectively), whereas Zn and Ni also show strong correlation (r=0.91). Ni and Co also exhibits a linear relationship (r = 0.54). Mean size has good correlation with Ni (r = 0.72), Zn (r=0.69) and Cd (r = 0.61) in VC-8. A significant correlation is observed between Ni and Co (r = 0.62), Cu and Cd (r = 0.57), and Zn and Cd (r = 0.56) in VC-10 (Table 3). Individually core VC-6 exhibits strong positive correlation between Cu, Ni, Zn and TOC, and all the elements show negative correlation with mean size (Table 3). VC-8 shows strong positive correlation between Ni, Cu and Zn. Interestingly Co exhibits positive correlation with Cu, Ni and Zn. Mean size shows good positive correlation with Ni, Zn and Cd, whereas TOC exhibits negative correlation with all the metals. VC-10 reveals moderate positive correlation between Ni and Cu and Ni and Co, whereas Cd shows positive correlation with Cu and Zn. Mean size has negative a correlation with all the metals. In both the cores VC-8 and VC-10, organic carbon does not show any relation with any of the metals. Scatter plots Bivariate plots of trace metals are shown in Figure 4. Clustering of values between Cu-Zn, Zn- Cd and Ni-Zn is observed in VC-10. A distinct clustering of Zn and Mz values is seen in all the cores. A good linear relationship is also observed between Zn-Mz (R = 0.72) and Ni-Mz (R = 0.71) in all the cores. Table 4. Concentration Factor (CF) and Pollution Load Index (PLI) of sediments
A linear relationship is also observed between Cu & Mz (R = 0.55) andCd & Mz (R = 0.51) (Fig. 4). Pollution Load Index (PLI)Downcore variation of PLI is shown in Figure 3. The PLI increases from bottom to the top of cores, and particularly higher in the top 20 cm. In VC-6, PLI ranges from 0.70 (21-22 cm) to 1.82 (10-11 cm), and in VC-8 it varies from 0.49 (3738 cm) to 1.66 (6-7 cm). In VC-10, the PLI values are much higher when compared to other two cores, and vary from 2.18 (5-6 cm) to 3.70 (11-12 cm) suggesting the enrichment of pollutants by two to three times (Table 4). Based on PLI values, it can be explained that VC-10 is proximal to the potential source of contaminants, particularly the industrial effluents. Spatially all the three cores show distinct variation in metal contents as the core locations represent three distinct sites influenced by different sources of metals. The cores from northern (VC10) and central (VC-8) parts exhibit higher contents of Ni, Zn and Cd in the upper portion of the cores, which suggests the increased input from metal-based industries in the recent past. Core VC-8 is influenced by the Chitrapuzha stream, where petroleum based industries are situated, and the location of VC-10 is influenced by the discharge of effluents from industries such as Fertilizers and Chemicals, Insecticides, Zinc, Rare earths etc. located on the southern branch of Periyar river. The sediments at the core site VC6 exhibit generally low contents of metals, as the area has a minimal industrial activity, except for the contaminants from Hindustan Paper Corporation Ltd. (HPCL) situated along the banks of Muvattupuzha River, and from municipal and agricultural sources in the catchment areas. Higer Cu content in sediments of the northern part of the lagoon points to the input from an insecticide manufacturing unit in the upstream part of the Periyar river. Extensive application of insecticides in agricultural land of the upper reaches may also have contributed for the accumulation of Cu in the sediments. The metals Ni, Zn and Cu are generally also associated with petroleum contamination (Caccia, et al., 2003). Contamination gradients exist for Zn, Ni, and Cu in the study area and it may be possible that some form of desorption of metals takes place as sediment particles are transported towards the mouthof estuaries (DeGroot et al., 1971), but other factors also may influence. Parallel gradients of organic matter content and grain size distribution are also likely to affect metal concentrations in the estuaries (Daka et al., 2003). The fine-grained sediments have a greater surface area and provide a more efficient environment for the adsorption of metals (Wasserman et al., 1998). Trace metal content generally increases as the grain size decreases due to the higher ability of fine particles to collect both transition and heavy metals. The association of metals (Cu, Ni and Zn) with fine size sediments is shown by its good correlation with mean grain size in all the three cores of the study area. All the three cores exhibit higher contents of metals in the top 20 cms. It is observed in many estuaries across the world that concentrations of elements with known anthropogenicinput generally increase towards the top of the cores. De Carlo andAnthony (2002) have recorded higher contents of Cu, Zn, Ni, and Cd in the top portions of the core sediments recovered from the watersheds of Hawaii and they attribute such elevated levels to anthropogenci input. Cu, Ni and Zn show uniform distribution below 20 cm in all the three cores. The metal contents and their strong positive interrelationships (among Cu, Ni, Zn and Cd) in the sediment cores of VC-8 and 10 indicate that the central and northern parts of Vembanad lagoon are influenced by point source contaminants. Correlation matrix data for of all the three cores exhibit strong positive interrelationship between Cu, Ni, Zn, Cd and mean size (Table 2). However, the combined metal data do not show any positive correlation with organic matter, and in most cases it has a negative correlation. Scatter plots also support these observations (Fig. 4). Correlation coefficients suggest that Co and Cu in all the cores were derived from a common source and their distribution is mainly controlled by pollution load indicated by higher concentration factor (CF) in VC-6 and VC-10 (Table 4). Cu is used as a catalyst in many industrial processes, which has lead to large inputs of anthropogenic Cu to the marine environment. Cu is also an efficient biocide, and has been used in antifouling paint on boats. Generally metals are adhered to particle surfaces and will therefore follow the particle transport in water. In VC-6, organic carbon (TOC) shows good correlation with Cu, Ni and Zn (Table 3). Cu and TOC show particularly good correlation, as Cu is known to preferentially adsorb to organic matter (Davis, 1984; Bergkvist et al., 1989). Organic carbon is said to be the main carrier of Cu to the watershed and a significant correlation between TOC and Cu could therefore be expected. Humic substances to some extent flocculate in the coastal environments and during the process Cu is entrained in the sediments (Scholkovitz and Copland, 1981). Ni, Zn and Cd values show higher CF and PLI values in the core VC-10 from the northern part indicating their distinct industrial sources. The concentration factor (CF) and pollution load index (PLI), which are the indices of sediment toxicity, are found higher in the study area compared to background values. The higher values of Cu, Ni, Zn and Cd are particularly recorded in the northern part, a major industrial area. The metal-smelting and chemical industries are the main sources of pollutants. The low-lying nature of the coast does not permit periodic flushing out of pollutants leading the area to become a large heavy-metal sink. The industrialization and rapid urban development during the recent past around Cochin area have led to the elevated metal concentrations in the lagoonal sediments. Most of major industries (70%) of Kerala are located in the study area, and about 260 million m3/day of effluents from these industries are released into the Cochin backwaters, which contribute to the increase of metal contents and eventually to high CF and PLI values in sediments. CONCLUSIONBased on the temporal distribution of heavy and trace metals, it is inferred that accumulation of Cu, Ni, Co, Zn and Cd in the recent past has increased in the Vembanad Lagoon region. This is supported by the lesser metal contents in the bottom portion of the cores. Metal contents do not show significant variation downward below 20 cm in all the cores. The statistical analysis of the data revealed that point source of contaminants, especially metal-based industries situated around northern part of the study area are responsible for the higher heavy-metal input in lagoon sediments. It is observed that highest content of Cu, Ni, Zn and Cd is recorded in the sediments of northern part of the VL. A strong positive correlation is seen between Cu, Ni, Zn and mean size, overall in the sediments. Whereas, individually among the cores, the one recovered from the northern part of the lake shows only moderate correlation between these metals and have a negative correlation with mean size. Scatter diagrams of these metals and mean size also gave the similar results. Higher concentration factor (CF) and pollution load index (PLI) are recorded for heavy and trace metals, more distinctly the northern part of the VL. Apart from industrial effluents, it is observed that domestic sewerage and rapid urbanization are becoming a major threat for this low-lying coastal tract as indicated by increasing fine size fraction in the sediments. The present study reveals that the toxic heavy metals have been accumulating at a faster rate in the sediments of Vembanad Lake and are being enriched in the recent sediments. The enriched metal concentrations will have a direct bearing on this tropical coastal ecosystem and periodic monitoring of effluent discharges is essential for effective management of this coastal zone. ACKNOWLEDGEMENTSCPP thanks the Council of Scientific & Industrial Research, New Delhi, for the Research Fellowship. ACN thanks the Department of Ocean Development, Government of India, for funding under a research grant No.DOD/11-MRDF/4/2/UNI/97(P-6). Authors thank N. Chandramohankumar and S. Muralidharan Nair, Department of Chemical Oceanography, Cochin University of Science & Technology, for AAS facility and help in analyzing the samples. REFERENCES
Copyright 2007 - Graduate Faculty of Environment University of Tehran The following images related to this document are available:Photo images[er07037t3.jpg] [er07037f2.jpg] [er07037f4.jpg] [er07037t2.jpg] [er07037t1.jpg] [er07037f3.jpg] [er07037f1.jpg] | ||||||||||||||||||||||||||||||||||
| |||||||||
