 |
| About Bioline | All Journals | Testimonials | Membership | News |
|
||||||
|
||||||
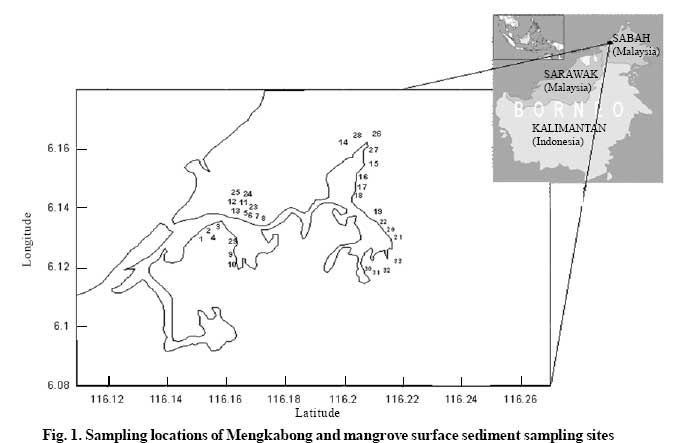
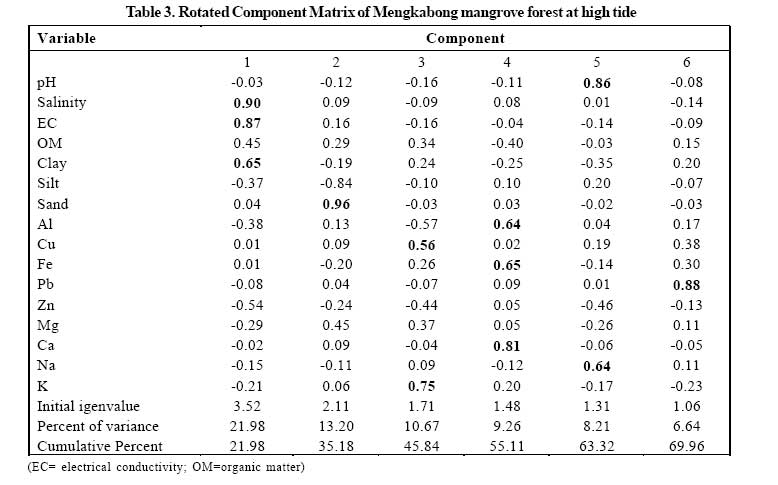
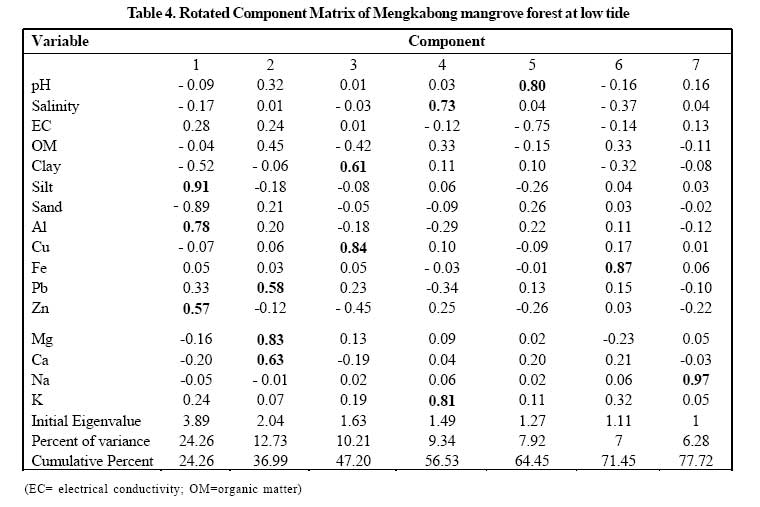
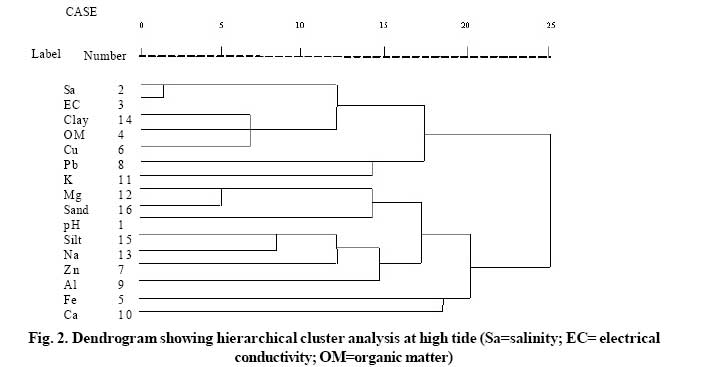
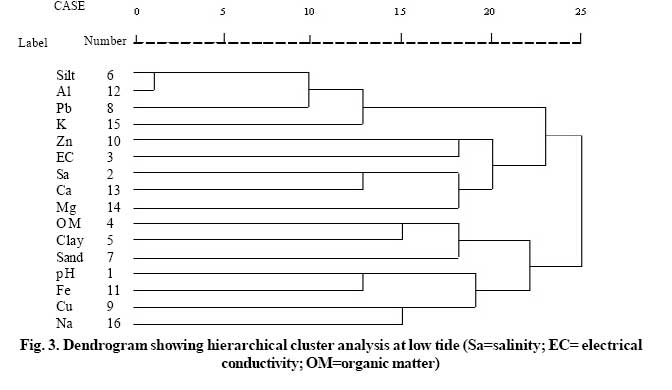
International Journal of Environmental Research, Vol. 2, No. 2, Spring 2008, pp. 139-148 Heavy Metals in Mangrove Surface Sediment of Mengkabong Lagoon, Sabah: Multivariate and Geo-Accumulation Index Approaches Praveena, S. M.1*, Ahmed, A.1, Radojevic, M.1, Abdullah, M. H.1 and Aris, A. Z.2 1School of Science and Technology, Universiti Malaysia Sabah, Locked Bag No. 2073, 88999 Kota Kinabalu, Sabah, Malaysia *Corresponding author: Email-smpraveena@gmail.com Received 26 June 2007; Revised 20 Sep. 2007; Accepted 7 Oct. 2007 Code Number: er08018 ABSTRACT The inter-tidal mangrove environment of Mengkabong lagoon is important as it supports the local fishing activities, nursery grounds for many fish and shellfish species, and as well as being central for ecotourism activities. The study showed that in general, the physicochemical parameters (pH, salinity and electrical conductivity), granulometric fractions, organic matter, base cations (Na, K, Ca and Mg) and heavy metals (Fe, Cu, Pb, Zn and Al) showed increasing loadings at high tidecompared to low tide. Multivariatestatistical techniques, principal componentsanalysis (PCA) and cluster analysis(CA), wereemployed tobetter interpret information about the sediment and its controlling factors. The PCA results revealed six controlling factors at high tide while seven at low tide. In CA there are two district clusters were identified at high and low tides. The calculation of geoaccumulation index (I geo) suggests the Mengkabong mangrove sediments are having background concentrations for Al, Cu, Fe, and Zn and unpolluted for Pb. Key words: Mangrove, Sediment, Tide, Multivariate analysis, Geo-accumulation index INTRODUCTION Mangrove sediments have been extensively studied all around the world (Malaysia, China, Australia, Brazil, India UnitedArab Emirates, and Thailand etc) and some of these studies assessed the pollution status of the sediments. For example, a study done by Kehrig, et al., (2003) in Jequia mangrove forest, Brazil concluded that the mangrove forest has been polluted with heavy metals by the anthropogenic sources surrounding the estuary. Study done by Ramanathan, et al. (1999) concluded the concentration of heavy metals in Pichavaram mangrove forest, India were generally below the levels found in polluted and unpolluted estuaries and mangroves. Heavy metal cycling is a serious problem addressed in mangrove environments (Marchand, et al., 2006; Pekey, 2006). The high concentrations of heavy metals are derived from anthropogenic inputs from industrial activities around the estuary such as discarded automobiles, batteries, tires, waste water disposal etc (Shriadah, 1999). For an example, Shriadah (1999) found high concentrations of lead due to the inputs from oil spills from discarded automobiles in addition to petrol combustion while study done by Bloom and Ayling (1977) in the Derwent Estuary revealed high concentration of zinc and lead due to a zinc refining company situated near the estuary. Sediments act as sinks and sources of contaminants in aquatic systems because of their variable physical and chemical properties (Priju and Narayan, 2007; Pekey, 2006, Marchand, et al., 2006; Rainey, et al., 2003). Pekey (2006) demonstrated that heavy metals tend to be trapped in the aquatic environment and accumulate in sediments.A multivariate statistical approach allows the researhers to manipulate more variables (Davis, 1986). Principal Components Analysis (PCA) and cluster analysis (CA) were the statistics methods used in the interpretation. PCA and CA often used together to check the results and provide grouping of each variable. PCA and CA are explanatory tools in multivariate statistical analysis to discover and interpret relationships between variables (Yongming, et al., 2006; Karbassi and Shankar, 2005; Jonathan, et al., 2004; Karbassi andAmirnezhad, 2004; Facchinelli, et al., 2001). According to Facchinelli, et al. (2001), FA and CA are often used together to check the results and provide grouping of each variable. Yongming, et al. (2006) explained that PCA is widely used to reduce data and to extract a small number of factors depending on the correlation matrix, whereas CA is performed to further classify elements of different sources on the basis of their similarities chemical properties. Hierarchical cluster analysis using dendograms identifies relatively homogeneous groups of variables in separate clusters and combines clusters until only one is left. Mengkabong lagoon formerly earmarked as the Mengkabong Forest Reserva, but released by the Forestry Department to become a state land. The Mengkabong mangroves, Tuaran District, experienced a 15% decrease from 1991 to 2000. In 1991 the mangroves covered 12.6 km2 while in 2000 it was 10.7 km2. Most of the mangroves have been lost due to the spread of rural development such as housing, aquaculture projects and surrounded by an industrial zone, Kota Kinabalu Industrial Park (KKIP) (Environmental Indicator Report, 2003). There is practically no detailed information on the environmental study of Mengkabong mangroves. Threfore, it was decided conduct a study of Mengkabong lagoon mangrove sediment and its pollution status. The purpose of this study was: (1) to determine the physicochemical parameters (pH, electrical conductivity and salinity), granulometric fractions, organic matter, heavy metals (Al, Cu, Fe, Pb and Zn) and base cations (Ca, Mg, Na and K) at high and low tides; (2) to identify the controlling factors by using factor analysis (FA) and cluster analysis (CA) at high and low tides and (3) to gauge the degree of anthropogenic influence on heavy metals concentration in mangrove sediment using geoaccumulation index (I geo). MATERIALS & METHODS This study was conducted in Mengkabong mangrove forest, Tuaran District, West Coast of Sabah which is 40 km away from Kota Kinabalu. The total of study area spreads over from latitude 06006’N to 06011’N and longitude 116008’E to 1160 13’E (Fig. 1). The Mengkabong mangrove forest consists of two shallow spurs, with the southern spur forming the administrative boundary between Tuaran and Kota Kinabalu Districts. This spur ends in Salut Bay which is entirely surrounded by an industrial zone, Kota Kinabalu Industrial Park. The southern spur of the estuary has been significantly degraded already and there is little left to protect. The northern spur is much larger and more irregular. There are still abundant and high quality mangroves remaining around the estuary (Environmental Impact Assessment 1992). Mangrove sediments were sampled randomly and taken in triplicates with an auger at 33 stations from March 2006 to November 2006 (Fig. 1) at low and high tides. The exact position of each sampling site was recorded using Global Positioning System (GPS). The sampling was done based to the accessibility to the mengrove forest. Mangrove surface sediments were choosen for this study as this layer controls the exchange of metals between sediments and water (El Nemr, et al., 2006). Sampling bottles and the laboratory apparatus were acid soaked in diluted nitric acid before the analysis. After acid soaking, they were rinsed thoroughly first with tapwater and then with distilled water to ensure any traces of cleaning reagent were removed. Finally, they were dried and stored in a clean place. The sediments were kept cool in an icebox during transportation to the laboratory. The physicochemical measurements of the surface sediment were made as soon as possible in the Environmental Science Postgraduate Laboratory, School Science and Technology, Universiti Malaysia Sabah. The physicochemical parameters (pH, electrical conductivity and salinity) were measured on 1:2 soils to water ratio extracts as soon as the samples reached the laboratory (Radojevic and Bashkin, 1999). The pH, electrical conductivity and salinity electrodes were calibrated before the measurements were taken. For other analyses, the surface sediments were air-dried, and after homogenization using pestle and mortar, passed through a 2-mm mesh screen and stored in polyethylene bags. Methods and references for various analyses are given in Table 1. For the determination of heavy metals, the samples were digested using aqua regia. Approximately 2g of each sample was digested with 15 mL of aqua-regia (1: 3 HCl: HNO3) in a Teflon bomb for 2h at 120oC. After cooling, the digested samples were filtered and kept in plastic bottles before the analysis. Radojevic and Bashkin (1999) stated that aqua regia is adequate for extraction of total metals in soil sample and is widely used in most soil analyses. For base cations (Na, K, Ca and Mg), the method used in this study is the measurement of exchangeable cations using ammonium acetate. Heavy metals and base cations were analyzed usingAAS with air/acetylene (Cu, Fe, Pb, Zn, Na, K, Ca and Mg) and nitrous oxide-acetylene (Al) at specific wavelengths (Atomic Absorption Spectrometer Perkin Elmer 4100). RESULTS & DISCUSSION The descriptive statistics of physico-chemical properties (pH, salinity, electrical conductivity) granulometric fraction, organic matter, heavy metals (Al, Cu, Fe, Pb and Zn) and base cations (Ca, Mg, Na and K) low and high tides are given in Table 2. PCA was applied to discover and interpret relationships between variables at high and low tides. The results showed a different trend at high tide and at low tide. Tables 3 and 4 display the factor loadings with a Varimax rotation as well as the eigenvalues, percentile of variance and cumulative percentage at high and low tides. In reference to the eigenvalues, six factors at high tide and seven factors at low tide were extracted as they have eigenvalues greater than 1 (Tables 3 and 4). At high tide, factor one accounted for 22% of total variance and is mainly characterized by high levels of salinity, electrical conductivity and clay fraction. Factor two accounted for 13% of the total variance with sand loadings. Factor three consits of Cu and K with total variance of 11%. Factor four characterized by 9% of total variance with highloadingsof Fe, Ca and Al. Factor five with 8% of total variance, contains high loading of Na and pH. Factor six with 7% of total variance is characterized by high loading of Pb. At low tide, factor one accounted for 24% of total variance and is mainly characterized by high levels of silt, Al and Zn. Factor two accounted for 13% of the total variance with Mg, Ca and Pb loadings. Factor three consits of Cu and clay with a total variance of 10%. Factor four is characterized by 9% of total variance with high loadings of salinity and K. Factor five, with 8% of total variance, contains high loading of pH while factor six, with 7% of total variance, is characterized by high loading Fe. Factor seven has 6% of total variance with Na loading. Cluster analysis was performed on the data set using average linkage between groups (Rescaled Distance Cluster). Although not substantially different from PCA, CA can be used as a substitute method to confirm the results of PCA. The results are illustrated in the dendrograms on Hierarchical Cluster Analysis (Figs. 2 and 3). At high tide (Fig. 2), two district clusters can be identified. Cluster one contains salinity, electrical conductivity, clay, organic matter, Cu, Pb and K. Cluster two contains pH, silt, and sand, Na, Zn, Al, Fe, Mg and Ca. At low tide (Fig. 3), two district clusters were observed, Cluster one contains silt, Al, Fe, K, Zn, electrical conductivity and salinity; Cluster two contains Ca, Mg, organic matter, clay, sand, pH, Pb, Cu and Na. The geoaccumulation index (I geo) introduced by Muller (1979) was also used to assess metal pollution in sediments. Geoaccumulation index is expressed as follows: Igeo = Log2 (Cn/1.5Bn) (1) Where C n = measured concentration of heavy metal in the mangrove sediment, Bn = geochemical background value in average shale (Turekian and Wedepohl, 1961) of element n, 1.5 is the background matrix correction in factor due to lithogenic effects. The calculated values for the Mengkabong mangrove sediment are given in Table 5 and remain in either class 0 or class 1, which indicates that the investigated mangrove sediments in Mengkabong mangrove sediment are unpolluted. At high tide, factor one in PCA results contain salinity, electrical conductivity and clay fraction. This corresponds to the associations in Cluster one results at high tide. Salinity and electrical conductivity clusters at the distance of one (Fig. 2), shows that the contributions of seawater during high tide in Mengkabong. According to Church (1989), seawater contains 3.5% of salinity of which 90% is fully ionized ions. The fully ionized ions and high salinity at high tide explained the high load of salinity and electrical conductivity at high tide. The salinity and electrical conductivity then form another cluster with organic matter and clay fraction. These associations then formed another cluster with PCA results of factor one, factor six and factor three. While factor three consists of Cu and K, with total variance of 11% in agreement with CA results (Cluster one) where the association of Cu, Pb, Mg, K and sand. Tidal flooding can bring additional ions such as K, Mg and Na into the system. It enables ion exchange to occur, such as between K and Cu (Preda and Cox, 2000). Similar findings were obtained between K and Cu by Grande, et al. (2003), who observed a negative correlation with marine indicators such as K. The new condition induced by tidal clash causes precipitation of metals such as Cu. These associations are mainly related to anthropogenic inputs and reflect the complexing nature of clay. Pb most probably arises from indirect sources for instance atmospheric deposition (Liu, et al., 2003). Based on PCA (factor four, factor five and factor six) and CA (Cluster 2), Al, Ca, Fe and Zn were correlated in PCA and CA results. The CA results showed the relationship between Al, Ca, Fe and Zn at the distance of 12, 15 and 19. PH value in estuarine sediments is one of the important factors that regulate the concentration of dissolved metals in water and sediment (Grande, et al., 2003; Hsue and Chen, 2000). The CA results showed associations between pH, Na silt and Mg. According to Hsue and Chen (2000), dissolved salts such as Na+ and Mg2+ played an important role in buffering the pH change. The process of tidal clash occurs in the Mengkabong mangrove forest. The influx of seawater from the high tide resulted in major inputs of selected cations which were then adsorbed by the sediment (clay, silt and sand). Rubio, et al., (2000) explained that the association between Mg and sand is strongly controled by biogenic carbonates and plays an important role as a dilutant material of the heavy metals in the samples. Biogenic carbonates are the dominant source of Ca2+, an abundant component in shallow marine sands (Morad 1998). Besides, Zhou, et al. (2004) states that Ca is an important components of marine biota and plays vital a role in the marine biogeochemical cycle. At low tide, silt and Al clusters at the distance of 1. Then, this association clusters with Fe (factor six in PCA). Salinity and electrical cnductivity clusters at the distance of 14 at low tide. This distance is far higher compared to the association of electical conductivity and salinity at high tide (Fig. 2 and Fig. 3). This demonstartes the lower contributions of seawater at low tide compared to high tide. While at low tide, in PCA (Table 4), it shows the, factor one accounted for 24% of total variance and is mainly characterized by high levels of silt, Al, Z n and EC. Cluster one (Fig. 3) shows the silt and Al is associated at the distance of 1. Besides, there is also an association of Zn of factor one in PCA with Fe (factor six in PCA), K and salinity (factor four in PCA). Zhou, et al. (2004) stated that besides antropogenic enrichment, heavy metals occur naturally in silt and claybearing minerals of terrestial and marine geological deposits. The natural occurrence of heavy metals complicates the assessment of potentially contaminated estuarine sediments.The measureable concentrations of metals do not automatically infer anthropogenic enrichment in the estuary. Therefore, heavy metal enrichment assessment is conducting in detail. While association of K+ is explained asa function of ionic strength. K+ is a monovalent cation with low replacing power compared with divalent cations such as Fe2+, Zn2+ etc (Hussien and Rabenhurst 2001). Cluster 2 at low tide (Fig. 3) shows clusters of Ca, Mg, organic matter, clay fraction, sand fraction, pH, Pb, Cu and Na. These associations are consistent with PCA results with the loading factor of factor two, factor three, factor five and factor seven. PCA and CA results show associations between organic matter and pH, clay fraction, sand, Cu, Pb, Ca and Mg. In coastal environments such as in mangroves, the associations between organic matter, granulometric fractions, heavy metals and base cations are become as functions of ionic strength of sediment solution and surface cation complexation (Hussien and Rabenhurst, 2001). The concept of cation exchange capacity at low tide implies that ions will be exchanged between wetlands, colliod surface and the surrounding water. Sediment organic matter has higher ion exchange capacity than sediment colloids and plays an important role in cation exchange capacity (Matagi, et al., 1998). As elobrated by Hussien and Rabenhurst (2001), the replacing power of the cation exchange complex depends on its valence, ionic strength, and its diameter in hydrated form and its concentration in water. This clarifies the loadings of marine indicator divalent cations (Mg2+, Ca2+) together with organic matter and Pb2+ due to the ionic strength. Moreover, it also observed that the dissolved salts such as Na+, Mg2+, Ca2+ etc. The role in buffering the pH change at low tide was also observed. Igeo has been appplied to the set of sediment data to assess the sediment quality in Mengkabong mangrove forest. The I geo index proposed by Muller (1979) showed that all the heavy metals are in Class 0 and Class 1 (Table 5) at high and low tide. Karbassi, et al. (2006) elobrated that I geo values can be used effectively and more meaningful in explaining the sediment quality. Buccolieri, et al. (2006) in the Gulf of Taranto, Italy, also reports similar findings with this study. This suggests that the mangrove sediment of Mengkabong is unpolluted. Soto-Jimenez and Paez-Osuna (2001) demonstrated the input of metals into sediment that are located seawards to be low in the total concentration of most of the elements and this could be due to the mixing of enriched particulte material with relatively clean marine sediments. CONCLUSION The application of multivariate analysis (PCA and CA) technique has been proved to be an effective tool for factors identification in Mengkabong mangrove sediment at high and low tides. PCA analysis extacted factors were six at high tide while there were seven at low tide. According to CA results, two clusters were formed at high and low tides. The salinity and electrical conductivity component loadings and clusters at high and low tides explained the tidal process where there is high contribution of seawater. The tidal clash causes the precipitation of metals. The relationships between organic matter, graunometric fractions, heavy metals, base cations become as a function of ionic strength of sediment and surface complexation. Less contribution of seawater was observed at low tide where the surface cation complexation and cation exchange capacity involved. The I geo calculations revealed that the Mengkabong mangrove sediment was in unpolluted condition. ACKNOWLEDGEMENT We would like to thank Mr. Asram and Mr. Neldin Jeoffrey for assisting with the field sampling. The author gratefully acknowledges her Universiti Malaysia Sabah Scholarship (YTL Foundation). REFERENCES
Copyright 2008 - Graduate Faculty of Environment University of Tehran The following images related to this document are available:Photo images[er08018t2.jpg] [er08018t4.jpg] [er08018t3.jpg] [er08018f3.jpg] [er08018f2.jpg] [er08018t5.jpg] [er08018f1.jpg] [er08018t1.jpg] |
| |||||||||
