 |
| About Bioline | All Journals | Testimonials | Membership | News |
|
||||||
|
||||||
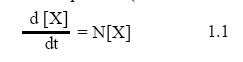
International Journal of Environmental Research, Vol. 3, No. 4, 2009, pp. 511-516 Biokinetics of Anaerobic Digestion of Municipal Waste Nwabanne, J. T.*, Onukwuli, O. D. and Ifeakandu, C.M. Department of Chemical Engineering, Nnamdi Azikiwe University, PMB 5025, Awka, Nigeria Received 20 Sep. 2008; Revised 25 Jan. 2009; Accepted 10 Feb. 2009 Code Number: er09056 ABSTRACT A study of the biokinetics of anaerobic digestion of municipal solid waste (MSW) was carried out using anaerobic batch digester. From the experimental results, the kinetic parameters (coefficient values) of the digestion of the MSW were determined. The maximum rate of substrate utilization (K), saturation constant (Ks), endogenous decaycoefficient (Kd), biomassYield or microbial growth yield (Y) and maximum specific growth rate (µmax) were found to be 0.144 day -1, 21.23 mg/L, 0.038 day -1, 0.367, and 0.053 day -1 respectively. These values indicate that practical digesters for MSW will require inoculation of the feed with microorganism to increase the rate of digestion. The biokinetics of anaerobic digestion of MSW was well described by first order kinetic model. Key words: Anaerobic digestion, Municipal solid waste, Biokinetics INTRODUCTIONThe rapid growth of population of Nigeria coupled with the growing level of modernization presents a significant challenge to the sustainability of our environment. Reckless disposal of solid waste in our cities has become a source of concern as it poses serious environment pollution (Dioha et al., 2005). Municipal solid waste (MSW) is a major type of solid waste to contend with in our cities because of its nature, and the large quantities generated on daily basis. MSW is a high solid type of waste that is largely non-flowing, which makes its handling and management relatively difficult, compared to the types of waste that can flow from one location to another or even vaporize (Igoni et al., 2006). Management of solid waste includes a variety of methods like reduction in raw materials usage, reduction in solid-waste quantities, re- use of solid waste materials, materials recovery and energy recovery (Peavy et al., 1985). However, the best environmentally practicable option is the conversion of solid waste components to energy, fuels and other valuable products, as well as the recovery or salvage of existing materials (Onyinlola, 2001). Anaerobic digestion of MSW produces three principal products viz. biogas, digestate and water (Tchnobonoglous et al., 1993). It is effectively a controlled and enclosed version of the anaerobic break down of organic and carbon dioxide. Biogas is a renewable source of energy which can relieve the burden of dependence on fossil fuels (Agunwamba, 2001). The storage, transportation and distribution of biogas are cheap and economical; their handling less hazardous than that of the fossil fuels (Baki et al., 2004). The production of biogas from MSW depends on a lot of parameters such as pH, C/N ratio, total solids, etc (Fernando and Dangogo, 1986; Dioha et al., 2005). The kinetics of microbial growth govern the oxidation, utilization, of substrate and the production of biomass, which contributes to the total suspended solids concentration in a biological reactor (Metcalf and eddy, 2003). Biomass solids in a bioreactor are commonly measured as total suspended solids (TSS) and volatile suspended solids (VSS). The coefficient values (K, Ks, Y, and Kd) used to predict the rate of substrate utilization and biomass growth can vary as a function of wastewater source, microbial population, and temperature (Metcalf and Eddy, 2003). They pointed out that for municipal and industrial wastewater the coefficient values represent the net effect of microbial kinetics on the simultaneous degradation of a variety of different wastewater coefficients. The kinetics of the microbial process of anaerobic digestion may be divided into kinetics of growth and kinetics of food (or substrate) utilization. The rate of increase of the biomass (microorganism) concentration, X is modeled as a first-order process (Sincero and Sincero, 1996).
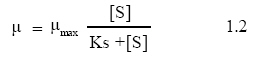
Mood (1949) discovered that in pure cultures N is a function of or is limited by the concentration, S of a limiting substrate or nutrient and formulated the following equation
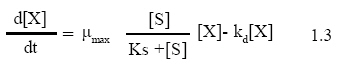
The dynamics or kinetics of death and cannibalization is represented mathematically as a decay of the population Kd[X]. Incorporating Monod’s concept and the kinetics of death into equation 1.2, the model for the rate of increase of
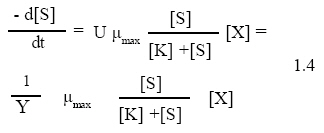
The rate of decrease of the concentration of the substrate is proportional to the rate of increase of the concentration of the organisms. The right-hand side of equation 1.3 is the rate of increase of microorganism that corresponds to the rate of decrease of the substrate. Therefore, the rate of decrease of the substrate is
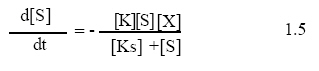
Where, U is the reciprocal of Y. Also, the substrate utilization rate or rate of decrease of the substrate can be modeled with the following expression
Equation (1.5) is referred to as the Michaels – Menten equation (Bailey and Ollis, 1986).
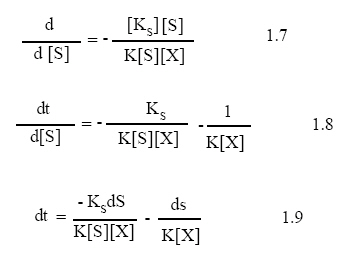
From equation (1.5)
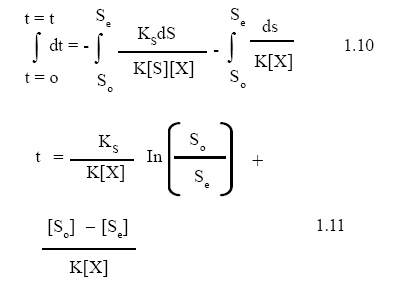
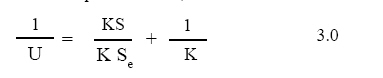
Biodegradable municipal solid waste was collected from a refuse dump along Kwata road, Awka, Anambra State, Nigeria. The waste was sorted to remove the undesirable and nondegradable components in the sample. The waste sample was shredded to increase the surface area available to microbes in the digester and hence increase the speed of digestion (Hang,1993).The waste sample consisted of yam peels (6kg), plantain peels (3kg), vegetables (1.9kg), pineapple peels (4kg) and cow dung (10.1kg).According to Peavey et al(1985) ,there are three basic steps in anaerobic digestion where methane is to be produced from solid wastes: (1)Preparation of organic fraction of the solid wastes for anaerobic digestion and it usually includes receiving, sorting, separation, and size reduction, (2) addition of moisture and nutrients, blending and pH adjustment and anaerobic digestion in reactor, and (3) capture, storage, and, if necessary, separation of the gas components evolved during the digestion process. The shredded waste sample (25kg) was diluted with 751itres of water to form slurry in the ratio of 1:3 and charged into a locally made digester with a capacity of 117 litres. The temperature of the digester and the atmospheric temperature were recorded using a clinical thermometer. After this initial measurement, the digester was made airtight with adhesive. The slurry was stirred to ensure the formation of a homogenous mixture. Digestion lasted for a period of 35 days. The biogas produced was measured daily be means of downward displacement of water by the biogas in an inverted measuring cylinder. The substrate and biomass concentrations were determined in terms of the chemical oxygen demand (COD), and the mixed liquor volatile suspended solids (MLVSS) respectively, the percentage total solids (TS) of the mixture was determined by ovendrying method and pH was measured with a digital pH meter. These measurements were repeated every 5 days. RESULTS & DISCUSSIONTemperature has a pronounced effect on the removal of pathogen or bacteria and the rate of gas production in anaerobic digestion. The temperature in the digester remained at mesophilic temperature during the digestion process (Table 1). Fig.1. shows the effect of time of digestion on MSW and microorganism concentrations. Retention time affects the concentration of microorganism. This is because microorganisms get weak and some even die as the digestion time increases. It is seen that the highest utilization of MSW took place between days 5 and 10 before degradation became more sluggish up to 35th day when reduction in MSW concentration became constant. The sluggishness in MSW utilization is attributable to the system being self-generating in biomass as there was no inoculation as seed to prime the system at the beginning. Also microbial growth was slow in the first 5 days before it came to its peak in the 10th day. This is because microorganisms must first become acclimatized to their surrounding environment and to the food provided (Peavey et al., 1985). The rate of decomposition of the MSW is a function of the concentration of the solid waste and other environmental factors. The process follows first order kinetic (Fig. 2). From equation (1.11), a plot of -In (So/Se) versus t (Fig. 2) gave a straight line with correlation coefficient of 0.986.This confirmed that the kinetics of MSV digestion is a first order reaction. From the figure, K was obtained as 0.183. The data used for the determination of kinetic parameters were generated from the batch digestion experiment. The data are displayed in Table 1. Using these tables the kinetic parameters of the digestion of the MSW (V, K, Ks, Kd and µmax) were determined. The procedure given by Viessman and Hammer (1993) was used for the determination of the kinetic parameters from the linearized equation below,
a plot of 1/U against 1/Se (Fig.3). gave Ks/K as slope and 1/K as intercept. K was obtained as 0.144 day -1 and Ks as 21.23 mg/L. These values imply that microorganism required more time to regenerate which is the reason for their sluggish performance and therefore MSW will need inoculation for better performance. Rao (2006) pointed out that in anaerobic decomposition the cell production in relatively low resulting in low sludge generation. Fig.4. shows the plot of inverse mean cell residence, 1/θ verses specific rate of MSW utilization, U. From the figure, Y is obtained from the slope as 0.367 and Kd from the intercept as 0.038 day-1 The specific rate of growth of microorganism, µmax is also obtained from equation (1.3) as 0.053 day-1 CONCLUSION The kinetic parameters K, Ks, Kd, Y and ìmax were determined by anaerobic digestion of MSW. The values of these kinetic parameters indicate that the anaerobic digestion of MSW will require inoculation of solid waste to speed up the process instead of allowing the process to depend on self- generation and subsequent regeneration. The biokinetics of MSW was well described by first order kinetic model. REFERENCES
Copyright 2009 - International Journal of Environmental Research The following images related to this document are available:Photo images[er09056f2.jpg] [er09056t1.jpg] [er09056f3.jpg] [er09056f4.jpg] [er09056f1.jpg] |
| |||||||||
