 |
| About Bioline | All Journals | Testimonials | Membership | News |
|
||||||
|
||||||
International Journal of Environmental Research, Vol. 3, No. 4, 2009, pp. 557-568 Adsorption of Phenol on Granular Activated Carbon from Nutrient Medium: Equilibrium and Kinetic Study Dabhade, M. A. 1*, Saidutta, M.B.2 and Murthy, D.V.R.2 1 Institute of Petrochemical Engineering, Lonere, Dr. Babasaheb Ambedkar Technological University, Raigad-402 103, Tal-Mangaon, Maharashtra, India Received 11 May 2008; Revised 17 Aug. 2009; Accepted 25 Aug. 2009 Code Number: er09061 ABSTRACT This paper presents the adsorption of phenol on granular activated carbon (GAC) from nutrient medium suitable for microorganisms’ growth and also the subsequent biodegradation. Two parameter Langmuir and Freundlich adsorption isotherm models were studied using large range of phenol concentration (50-1000 mg/L). In low range of phenol concentration (50-300 mg/L), correlation coefficient, normalized deviation “g% and separation factor were 0.9989, 2.18% and 0.38 0.78 respectively, while for higher concentration range (400-1000 mg/L), the corresponding values were 0.9719, 1.9% and 0.45- 0.67. Freundlich isotherm gave correlation coefficient of 0.9984, 1/n. value of 0.7269 and normalized deviation of 4.55%. Comparison based on R2, adjusted R2, normalized deviation and root mean square deviation (RMSD) showed that the Redke-Prausnitz isotherm model gives better prediction compared to other models. Adsorption of phenol follows pseudo second order kinetics with correlation coefficient closer to one. Biodegradation study using immobilized cells of Nocardia hydrocarbonoxydans on GAC showed that, biodegradation begins well before GAC reaches the saturation period. Key words: Activated carbon, Adsorption isotherm, Normalized deviation, Separation factor, Phenol biodegradation, Immobilization INTRODUCTIONVarious industries like pharmaceutical, petroleum refining, pesticide manufacturing, synthetic resin, wood pulp production and coke manufacturing are rich source of phenolic waste water (Autenrieth et al., 1991). Many synthetic organic compounds have phenol as their basic structural unit. Phenol is protoplasmic poison and its toxic effects are pronounced even at very low concentration. USEPA has listed phenol as priority pollutant and set a discharge limit of 0.1 mg/L of phenol in waste waters. As per Indian, Environment Protection Rules 1986, the permissible limit for phenol for the discharge of effluent into inland surface water is 1.0 mg/L and 5 mg/L in public sewer and marine coastal areas (Gupta et al., 2006). The effect of phenol on the aquatic life is destructive at low concentrations, for fishes 5-25 mg/L is lethal and as low as 0.1 mg/L leaves an odor. When phenol in several micrograms per liter combines with chlorine, it imparts an objectionable, medicinal taste to drinking water. The permissible limit on phenol in drinking water set by US, Canada and Japan is 1µg/L, 2µg/L and 5µg/L respectively, while FDAhas set limit of 1µg/L in bottled water. Phenol is third largest of the secondary product of benzene. Phenol removal by various physical, chemical and biological methods is extensively reported in literature. Combined methods like biochemical, electrochemical, physicochemical or simultaneous adsorption and biodegradation is nowadays gaining importance. Simultaneous adsorption and biodegradation increases the life of adsorbent, as biofilm on adsorbent degrade the adsorbate. For the removal of aqueous dissolved organic pollutants the advanced water treatment process like adsorption onto activated carbon is considered to be the most effective and reliable method. Activated carbon either in granules or powder form has good capacity for the adsorption of organic molecules (Hassani et al., 2008; Aghamohammadi et al., 2007). They have ability to attract to their surface soluble materials such as phenol from solution. Irrespective of the disadvantages of use of activated carbon like cost, it is being used in advanced waste water treatment. Literature shows the use of activated carbon made from various low cost materials like straw, automobile tyres, fly ash, coal reject, sewage sludge, begasse, fertilizer waste and saw dust etc for phenol adsorption. Rengaraj et al., (2002) used activated carbon prepared from rubber seed coat for phenol adsorption. Different porous materials like activated carbon cloth, activated carbon fibre, Ca-alginate beads, diatomaceous earth, denatured biomass, chitosan material (Annadurai et al., 2000); Na-Alginate, ion exchange resin, clay etc have been used for adsorption. In designing adsorption system it is necessary to know the adsorption capacity of an adsorbent which is characterized by the isotherm study. There is continuous diffusion of solute from the liquid into the solid surface and back diffusion of solute into the liquid. At equilibrium the solute remaining in solution are in dynamic equilibrium with that of the surface. Kumar et al., (2007) have conducted detailed literature survey of the various adsorption isotherms. They have reported the isotherm parameter values in same unit for the comparison purpose. Literature shows most of adsorption study from water except Kumar et al., (2007) who used basal salt medium suitable for P.putida growth. The objective of this work is to use wide range of phenol concentrations (50-1000 mg/L) to study the adsorption of phenol on granular activated carbon from the mineral medium suitable for the growth of microorganism Nocardia hydrocarbonoxydans. Use the equilibrium data for fitting the two parameters and three parameters adsorption isotherm models and compare the applicability of these isotherms using R2, adjusted R2, normalized deviation, root mean square deviation (RMSD) and variance etc .The different forms of Langmuir isotherm model would be used for low and high range of phenol concentrations. Also the dimensionless term called separation factor RL to test the validity of Langmuir isotherms will be used and the results compared with those available in literature. The adsorption kinetics using pseudo first order and pseudo second order would be applied to determine the rate equation. The biodegradation study would be carried out in a continuous bio-contactor and the time required for the contactor to attain steady state would be compared with the adsorption saturation time. MATERIALS & METHODS
In the adsorption study, 100 mL of nutrient media having phenol in various concentrations viz., 50, 100, 200, 300, 400, 600, 800 and 1000 mg/L was taken in a 250 mL conical flask. The adsorbent GAC loading was kept constant at 2g per liter of phenol containing nutrient medium. The GAC and all the required chemicals were obtained from NICE Chemicals, Chennai, India. The properties of GAC used in this study are: particle size- 2.4 mm, specific surface area (BET) - 700 m2/g, bulk density- 0.53±0.05 g/cm3, average pore radius10µm, micro pore volume- 0.38 cm3/g and true density of 1378.7 kg/m3. Nutrient medium consisted of ammonium nitrate (1 g/L), ammonium sulphate (0.50 g/L), sodium chloride (0.50 g/L), di-potassium hydrogen orthophosphate (1.5 g/L), potassium di-hydrogen orthophosphate (0.5 g/L), ferrous sulphate (0.002 g/L), calcium chloride (0.01 g/L) and magnesium sulphate (0.50 g/L) in distilled water. This nutrient medium composition is suitable for the growth of microorganism Nocardia hydrocarbonoxydans used in phenol biodegradation studies (Shetty et al., 2007). The conical flasks and other glassware were initially sterilized to avoid any contamination or bacterial growth. The conical flasks were closed with sterilized cotton and aluminum foil, after addition of required solution of mineral medium, phenol and GAC. GAC was initially sieved to obtain the required size. It was thoroughly washed in hot distilled water so as to remove all dirt and impurity, dried at 110 oC during one day and then used in the experiment. The conical flasks were kept in shaker operated at 150 rpm and atmospheric temperature of 30 oC. Sample of 1mL was withdrawn at regular interval for phenol analysis. The residual phenol was immediately analyzed using UV-Vis Spectrophotometer (HITACHI2000) at 510 nm using standard methods (APHA, 1975). Experiment was continued for 300 minutes at which the steady state was reached. RESULTS & DISCUSSION
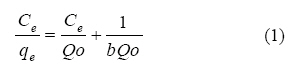
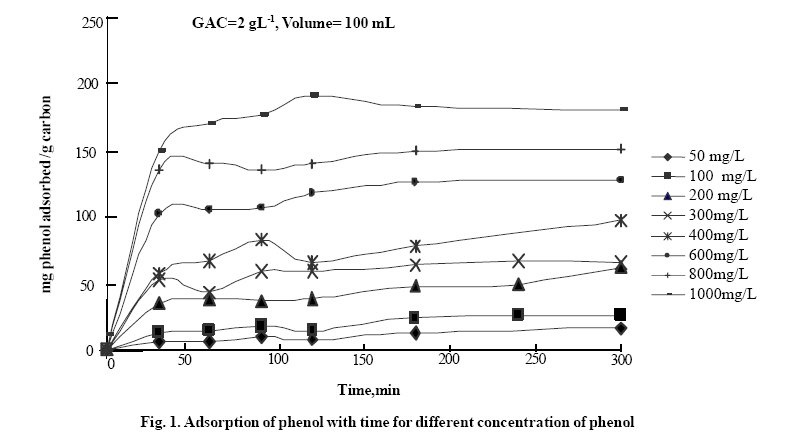
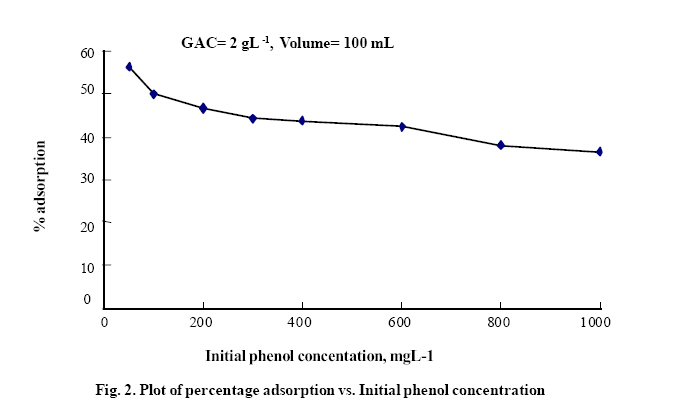
Fig.1. shows the effect of time on adsorption of phenol for different initial phenol concentration. Initially there is strong adsorption and then reaches to equilibrium after around 300 minutes. Fig. 2. shows the effect of initial phenol concentration on percentage adsorption at steady state. Increase of concentration decreased the percentage adsorption.As phenol concentration increases from 50 mg/L to 1000 mg/L, percentage removal was decreased from 56.4 % to 36.3 % since at high concentration of phenol the ratio of weight of phenol to available surface area is high. Various researchers showed that decrease of particle size increases the percentage removal of adsorbate. Mondal and Balmojumder (2007) used GAC particles size from 4-5 mm to 2-4 mm for phenol and resorcinol removal. They found that 2-4 mm size of GAC was optimum for adsorption and biodegradation. Annadurai et al., (2000) used chitosan particles of size 0.177 mm, 0.384 mm and 1.651 mm for adsorption of phenol. Throop (1975) studied the effect of GAC particle size for adsorption of phenol and concluded that particle size of 0.4 mm to 2.4 mm is suitable for adsorption. Decrease in particle size increases the percentage removal due to increase in surface area as well as micro pore volume (Annadurai et al., 2000; Kumar et al., 2007). Smaller particle size means more interior surface and micro pore volume and hence more will be the area of active sites for adsorption. Also for larger particles the diffusion resistance to mass transfer is higher and most of the internal surfaces of the particle may not be utilized for adsorption and consequently the amount of phenol adsorbed is small (Annadurai et al., 2000). Although smaller size is better, in packed bed it gives higher pressure drop and hence very small size is not desirable. Smaller the particle size of adsorbent means more is the grinding cost. In the present work the GAC will be used in the biodegradation study in the spouted bed contactor. The spouted bed contactors are better when the particle size is larger than 1 mm (Mathur & Epstein, 1974). This gives better spouting of bed ensuring uniform recirculation of solids in the contactor and hence the proper contacting of phases. By considering the above points, the average particle size of 2.4 mm was selected in this work. The adsorption isotherm is probably the best method to determine the amount of adsorbate that an adsorbent can retain and that remaining in the solution at equilibrium. Langmuir and Freundlich isotherms are two parameter isotherms commonly used for study of phenol adsorption on activated carbon. Toth’s isotherm, Redlich-Peterson isotherm and Redke-Prausnitz isotherm are three parameter isotherms models being used. Adsorption data of Figure 1 was used to fit these isotherms by regression analysis using Window Excel based solver function. Initially the linear form of model was used in excel spreadsheet using Linest function to obtain the parameter values in case of two parameter models. Then these values were used as initial guess while using solver. Also, the model was tested using Polymath 6.0 software. The program uses the Levenberg-Marquardt (LM) algorithm for finding the parameter values. The objective function that is minimized is the ith sum of squares of the errors. The error is the difference between the actual value of the dependent variable and the calculated value of the dependent variable from the model expression. The LM technique is an iterative solution method that usually converges very rapidly, except when the Hessian matrix becomes nearly singular. In such cases, the algorithm switches to the steepest descent method. Adsorption data was fitted in two parameter and three parameter isotherm models.Langmuir isotherm theory is based on the assumption that adsorption is monolayer. Following equation is commonly used.
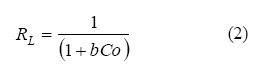
Where, Ce (mg/L) and qe (mg/g) are the equilibrium adsorbate concentration in liquid and solid phase respectively. Qo and b is Langmuir constants related to adsorption capacity and energy of adsorption respectively. Plot of Ce/qe vs. Ce would give the values of constants. A dimensionless equilibrium parameter called separation factor, RL is used to study the applicability of Langmuir adsorption isotherm where;
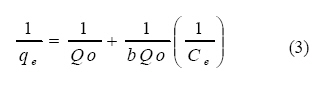
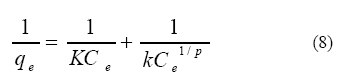
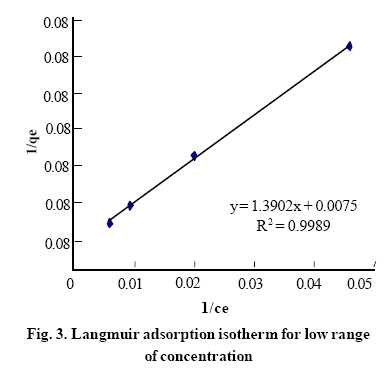
Here Co is initial concentration and b is Langmuir constant. RL value within 0-1 indicates the applicability ofisotherm. Vinod and Anirudhan (2002) studied adsorption of phenol on activated carbon of particle size 0.096 mm prepared from coconut husk by single step pyrolysis. They used the above equation for the range of concentration studied. Qadeer et al., (2002) used commercial carbon of size 5 micron for a study, varying phenol concentration from 100 to700 mg/L. Annadurai et al., (2000) used Chitosan (0.177 to 1.651mm size) for adsorption of phenol. Phenol concentration of 20 to200 mg/L was used in the adsorption isotherm study. Kumar et al., (2007) used GAC size of 0.536 mm, GAC concentration of 5 gL-1 and phenol concentration up to 1000 mg/ L in a basal salt medium at 30 0C and pH 7.0 as these conditions are suitable for P-putida growth. Juang et al., (1996) used activated carbon fibers for phenol adsorption isotherm study in the concentration range of 40- 500 mg/L at 303 K. They suggested that above Langmuir equation (1) is good only in higher concentration ranges and gave an alternate form of Langmuir equation (3) for lower concentration range,
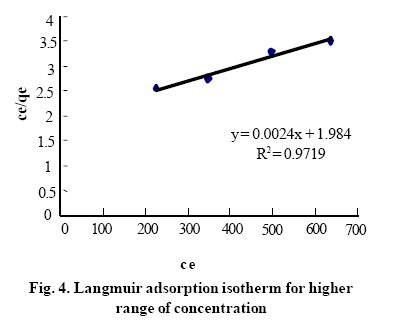
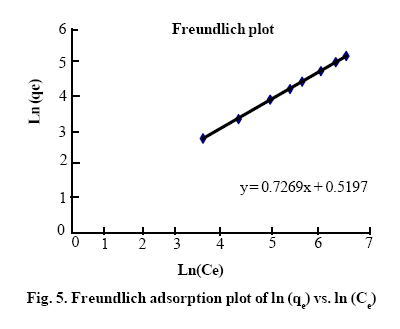
The plot of 1/qe vs. 1/Ce would give the values of constants. A similar approach is used in this work. The lower concentration range of 50- 300 mg/L was selected, while higher concentration range was 400- 1000 mg/L. This gives better fit in both the ranges. Initially when equation (1) was used for whole range of concentration, it gave poor fit with correlation coefficient of 0.93. Fig.3 and 4 gives the isotherm plot for low and high range of concentrations.This gave Qo value, i.e. adsorption capacity of 133.33 mg/g and 416.66 mg/g for lower range and higher range of concentration respectively. The corresponding values of isotherm constant b were 0.00539 L/mg and 0.00121 L/mg respectively. Juang et al., (1996) obtained Qo value of 117.5 mg/g and 155.38 mg/g for lower and higher range of concentration, while corresponding b value was 0.187 and 0.0425 L/ mg respectively. The value of Qo in other studies were 30.78 mg/g (Mondal and Balmojumder, 2007), 146.16 mg/g (Vinod and Anirudhan, 2002), 165.80 mg/g (Kumar et al., 2007). The corresponding value of b was 0.03, 0.0182 and 0.04 respectively. The constants obtained in this work are comparable with those in published literature. The difference could be due to different range of concentration, different type of material used and their properties like functional groups present on the surface, surface area, pore structure, pH and temperature of the solution(Kumar et al., 2007).The dimensionless equilibrium parameter called separation factor obtained in this study was in the range of 0.38- 0.78 for lower concentration range and 0.45-0.67 for higher concentration range indicate the applicability of Langmuir adsorption isotherm. Correlation value obtained in lower and higher ranges was 0.9989 and 0.9719 respectively. Also in both the cases the fit was linear. Freundlich adsorption isotherm is used for heterogeneous surface energies system. qe = K f Ce(1/n)(4) Where, K f and 1/n are Freundlich constants related to adsorption capacity and intensity of adsorption respectively. Linear equation of Freundlich adsorption becomes, ln( qe ) = (1 / n ) ln( Ce ) + ln( K f ) (5)
Plot of ln (qe) vs. ln (Ce) would give the values of constants. Figure
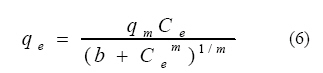
5 shows the Freundlich adsorption isotherm plot. It is a straight line with 1/n, Kf and correlation coefficient values of 0.7269 1.6814 and 0.9984 respectively. Value of n >1 is favorable adsorption condition (Treybal, 1998). When 1 Toth’s Model is a three parameter model and it describes adequately heterogeneous systems The model is given as,
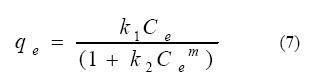
The model parameter qm represents the total adsorption capacity, m is the dissociation parameter and b is the adsorption equilibrium constant.Redlich-Peterson Model is a three parameter model and is in general agreement with that of Langmuir and Freundlich (Annadurai et al., 2000). It is given as,
Here k1, k2 and m are the model parameters. The value of m lies between 0 and 1.Redke-Prausnitz Model is slightly modified from Redlich-Peterson model and is given as,
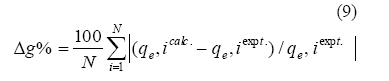
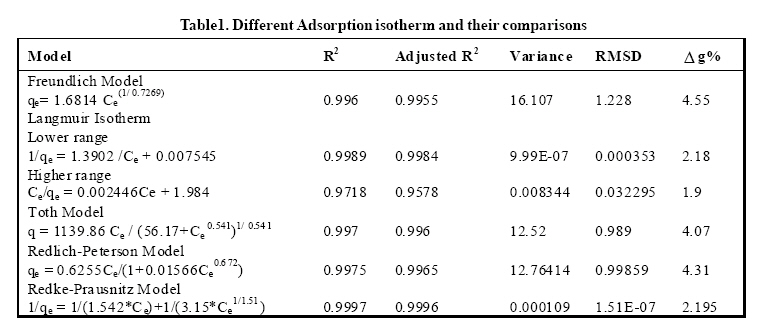
Here, K, k and 1/p are model parameters. The model parameters are obtained using procedure mentioned in section 3.2 and values are reported in Table 1 along with their statistical analysis. The comparison of models is made using R2, adjusted R2, Variance, RMSD and normalized deviation (Δg%).Normalized Deviation term is used to judge the fitting of the adsorption models. It is calculated as,
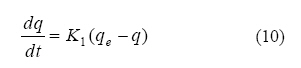
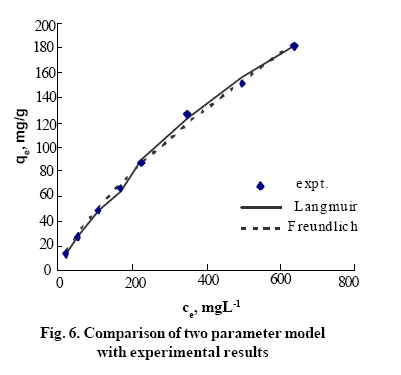
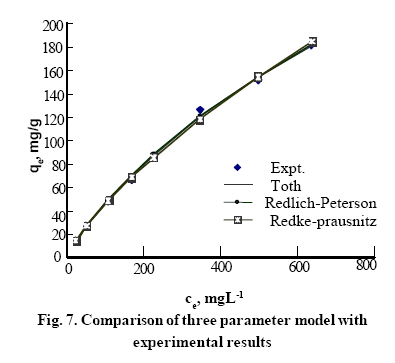
Where, superscripts “calc.” and “expt.” are the calculated and experimental values, respectively. N is the number of measurements. Δg % for Langmuir adsorption was 2.18% and 1.9 % for lower and higher range of concentration while for Freundlich adsorption it was 4.55 %. The values of Δg% for other models are reported in Table 1.Fig. 6 and Table 1 gives comparison of two parameter models with the experimental results. Based on values of R2 and Δg% we ca say that both the isotherms explain the adsorption process, however, higher R2, smaller Δg%, smaller RMSD and smaller variance of Langmuir adsorption shows the better applicability over Freundlich adsorption isotherm. The Qo value was higher than the corresponding Kf value. Mondal and Balomjumder (2007) and Vinod and Anirudhan (2002) have drawn similar conclusion. Fig. 7 and Table 1 gives comparison of three parameter models with the experimental results. These models are compared using the statistical parameters as given in Table 1. If value of R2 and adjusted R2, is closer and near to unity, model is best predictable and the model is significant. Also, if RMSD, variance and ∆g % values are smaller, then model prediction is good. Based on these criteria, Redke-Prausnitz Model prediction is better compared to other models. In order to model the adsorption of phenol from nutrient medium on GAC, pseudo first and second order kinetic model is applied (Behera, et al., 2008).Pseudo first order kinetic model is,
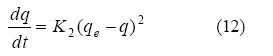
Integration of equation (10) gives ln(qe- q) = ln(qe) –K1t (11) Plot of ln(qe-q) versus t, will give value of rate constant K1 and from Y- intercept, qe can be calculated. Pseudo second order kinetic model is represented as,
Integration of equation (12) gives
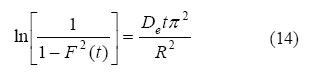
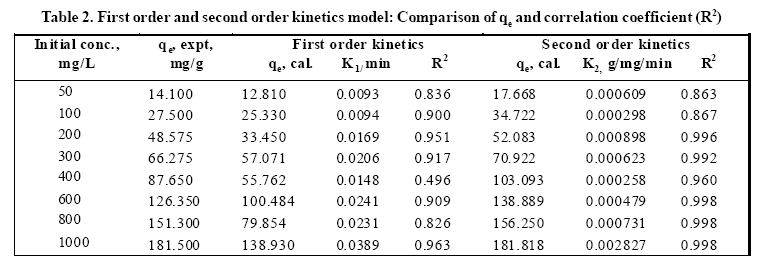
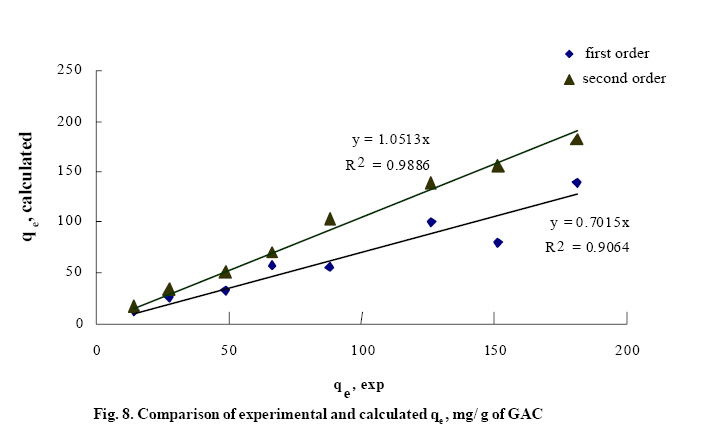
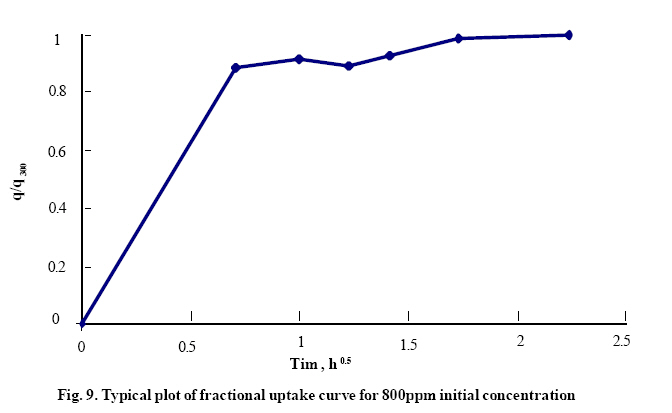
Where, qe mg phenol adsorbed per gm of GAC at equilibrium Table 2 gives the values of correlation coefficients, experimental and calculated values of qe for different initial phenol concentration. Fig. 8. shows the comparison of experimental and calculated qe values. Comparison of values of R2 and qe, from the Table 2 and also from figure 8 shows that, adsorption of phenol from nutrient medium follows pseudo second order kinetics. The adsorption steps include the transport of adsorbate in bulk phase and in solid phase. The properties of adsorbate, adsorbent, solution phase decide the uptake rate. The initial transport of adsobate to macropore is fast, then transport to mesopore is medium and finally there is slow diffusion into micropores. This can be indicated in plot of fractional uptake vs. t0.5 (Kumar et al., 2007) as shown in Fig. 9. In general, intra particle diffusion transport is considered as rate limiting step in case of adsorption on porous solid adsorbent from aqueous solution, if system is well mixed. Following equation is used for intraparticle diffusion.
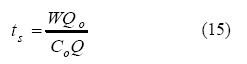
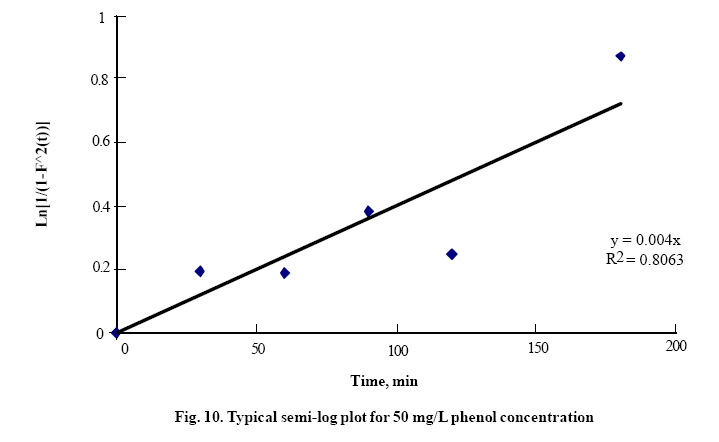
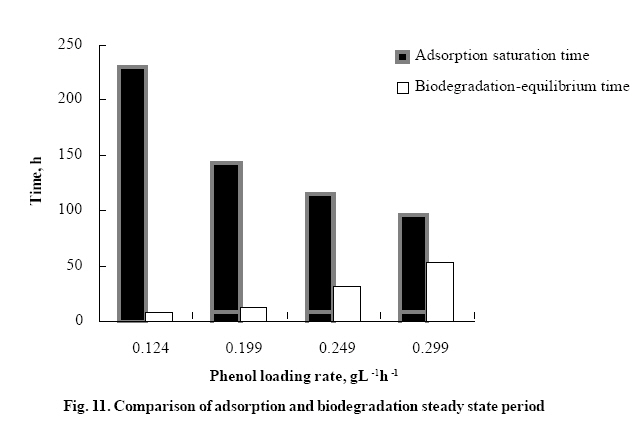
Where, De is effective diffusivity, m2/sec, t is time, R is radius of solid and F (t) is fractional uptake of the adsorbate on adsorbent. Slope of plot of ln [1/ (1-F2(t))] vs. t gives diffusivity. Typical plot for 50 mg/L is shown in Fig. 10. The diffusivity values of phenol into activated carbon for the range of concentration studied was between 0.15 x 10⁻¹² to 9.7 x 10⁻¹² m2/s. They are consistent with the published values. Phenol biodegradation study was carried out in a spouted bed bio-contactor with 200 g of GAC immobilized with Nocardia hydrocarbonoxydans and used in the reactor for different phenol loading rates. Initially the microorganisms were grown in nutrient medium and acclimatized to the required phenol concentration slowly with an increment of phenol concentration.The GAC was then immobilized with the third acclimatized culture in flask for two days. The standard procedure as used by Shetty et al. (2007) was followed for acclimatization and immobilization. The GAC thus immobilized with microorganisms was then used in the contactor. The synthetic phenolic effluent along with nutrient medium was then charged to the contactor with certain dilution rate and phenol concentration. Experiment was continued till steady state was reached indicated by constant phenol effluent concentration of three successive reading, each taken after three hydraulic retention time (Mayer et al., 2007). The GAC from contactor was used to find the attached biomass weight as per procedure mentioned elsewhere (Livingston et al., 1989). The time required for a contactor to attain a steady state was noted. The biodegradation study was conducted with phenol loading rate of 0.124 g/L/hr to 0.299 g/L/hr. The biodegradation results were compared with the adsorption study using the adsorption capacity obtained. If the adsorption study were to have been conducted in the contactor, the saturation time required in the contactor would be calculated as,
Where, Qo Adsorption capacity, mg/g The saturation time t is the time at which bed becomes saturated with phenol. After initial period of 3 to 4 h, effluent phenol concentration starts increasing which is above permissible discharge limit. The saturation time t s , is then compared with the time required for a contactor to attain a steady state in biodegradation study for the given phenol loading (Fig. 11). The result shows that the biofilm became active and the bio-degradation took place well before the saturation time was reached. GAC has a potential for Norcardia hydrocarbonoxydans immobilization and can be effectively used in spouted bed contactor for biodegradation study. The adsorption of phenol from the mineral medium onto the granular activated carbon was studied. Percentage adsorption decreased with increase of initial concentration while the amount of phenol adsorbed per unit weight of activated carbon increased with increase of initial concentration as the ratio of weight of phenol to average surface area is high at high concentration. Smaller the particle size better is the percentage removal; however, smaller size means higher the grinding cost and higher is the pressure drop in packed bed. Hence it needs a compromise in cost and size. A different form of Langmuir isotherms for low and high range of concentration gave correlation coefficient of 0.9989 and 0.9719 respectively.The smaller RL values (0.38- 0.67) and smaller ∆g% indicated the applicability of Langmuir adsorption isotherm. Freundlich isotherm gave correlation coefficient value of 0.9984 and ∆g% of 4.55%.This suggest that although both the model fit well the adsorption data, Langmuir isotherm is better as it gave smaller ∆g% value. In case of three parameter adsorption isotherm models, Redke-Prausnitz Model showed better applicability as compared to other models as this model showed higher value of R2 (0.9997) and smaller values of RMSD (1.51E-07) and ∆g% (2.195%) compared to other models. The rate of adsorption follows pseudo second order kinetics with correlation coefficient closer to one. Diffusivity values obtained were of the order of 10-12 m2/s indicating that the intra particle diffusion is rate limiting step. Biodegradation using cells immobilized on GAC shows that simultaneous adsorption and biodegradation takes place and it takes less time to reach steady state than mere adsorption to remove the pollutant. Nomenclatureb:Toth isotherm parameter, the adsorption
equilibrium constant.
Q : Volumetric flow rate, (L/h) Qo:Langmuir constant related to adsorption capacity, mg/g. R2 : Correlation coefficient. RL :Dimensionless equilibrium parameter, separation factor. R : Radius of particle, m. t : Time, sec. ts:Saturation time, h W:Weight of GAC, g. REFERENCES
Copyright 2009 - International Journal of Environmental Research The following images related to this document are available:Photo images[er09061f4.jpg] [er09061f1.jpg] [er09061t2.jpg] [er09061f2.jpg] [er09061f5.jpg] [er09061f10.jpg] [er09061f8.jpg] [er09061f6.jpg] [er09061t1.jpg] [er09061f7.jpg] [er09061f9.jpg] [er09061f11.jpg] [er09061f3.jpg] |
| |||||||||

