 |
| About Bioline | All Journals | Testimonials | Membership | News |
|
||||||
|
||||||
International Journal of Environmental Research, Vol. 4, No. 1, 2010, pp. 41-48 Estimation of the Current Status of Floral Biodiversity at Surroundings of Integrated Industrial Estate-Pantnagar, India Banerjee, T. and Srivastava, R . K.* Department of Environmental Sciences, G.B. Pant University of Agriculture & Technology
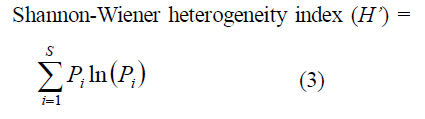
Pantnagar-263 145, U.S. Nagar (Uttarakhand), India Received 2 June 2009; Revised 12 Sep. 2009; Accepted 22 Sep. 2009 Code Number: er10005 ABSTRACT Gradualdecreaseofbiodiversity related to the rapid industrialization and urbanization is stimulating the fundamental research towards a better understanding of the relationships between biodiversity and ecosystem functioning. Present study emphasizes the nature and status of floral diversity in the vicinity of Integrated Industrial Estate-Pantnagar, Uttarakhand, India (IIE-Pantnagar). Three monitoring locations were selected in the vicinity of industrial estate and data were collected to compute species richness, evenness, Importance Value Index (IVI), Shannon and Wiener Species Diversity Index and Simpson’s Index of biodiversity. Cynodon dactylon was found to be major dominant species among all three monitoring locations, followed by Sorghum halepense and Parthenium sp. The Simpson’s index of biodiversity varied at a range of 0.28 to 0.41, signifying the presence of less biodiversity. Species evenness, a measure of relative abundance of the different species was at a range of 0.36 to 0.46. Monitoring location outside industrial area (site-2) revealed slight higher diversity with Shannon and Wiener Species Diversity Index of 0.742 in comparison to other monitoring locations inside the industrial area. Mostly the encountered vegetation were found as invasive species, therefore, recommendations were hereby made to take precautions regarding its further spread. Development and maintenance of greenbelt in and around industrial area were also suggested. Key words: Shannon and Wiener Species Diversity, Simpson’s index, Species diversity, Species evenness, Species richness INTRODUCTIONContinuous anthropogenic interferences with the earth life supporting system coupled with rapid industrialization to meet increasing demands of humanity in both developed and developing countries, produced irreversible damages to the ecosystems. Moreover, incessant economic developments and population expansions lead to a series of several associated problems, mostly related to the environmental protection and sustainability (Banerjee et al., 2008). Almost 40% of the Earth’s land surface is managed for cropland, while natural forests cover approximately 30% of the land surface (FAO, 2000). But gradual changes in global climatic regimes and land use pattern has lead to modification of current vegetation, which is further deteriorated due to anthropogenic habitat destruction. Among several other associated reasons, destruction of habitat by anthropogenic activities is designated as the most vital cause both for biological invasions on all temporal and spatial scales and for existing rates of species extinction (Chronopoulos and Christodoulakis, 2000; Maihe and Krauchi, 2003). Moreover, changes in climatic pattern, habitat disturbances and destructions, variations in nutrient loading rates, and other environmental constraints also have a significant impact on successional dynamics coupled with the maintenance of vegetation (Schulze and Mooney, 1993; Maihe and Krauchi, 2003). Biological invasions may also generate changes in composition and competition of species and have the potential to completely eradicate the native species of a particular area (Banerjee et al., 2008). The ‘Hemeroby concept’, based on the difference of current vegetation in comparison with the pristine or potential natural vegetation on a given scale, is often being used in order to quantify the temporal and spatial changes in vegetation (Kowarik, 1988; Maihe and Krauchi, 2003). However, in this specific study, authors aim to determine the floral biodiversity present in an adjacent area of recently developed industrial estate in order to measure industrial impacts on its adjacent biodiversity. The industrial pollution due to its nature has potential to cause irreversible changes in the environment and hence is posing a major threat to sustainable development. Therefore, due to establishment of IIE-Pantnagar within 20 km radius from G.B. Pant University of Agriculture & Technology (GBPUAT) Crop Research Centre (CRC), Horticulture Research Centre (HRC) and Vegetable Research Centre (VRC) etc. as well as other research centers of the university, the environmental degradation cannot be ignored in its surroundings (Banerjee et al., 2008). Determination of any possible existing and future impacts on floral pattern by IIE-Pantnagar are also crucial aspect to evaluate the sustainability of existing industrial estate. Present investigation was therefore, carried out to determine the status of floral pattern in the surrounding area of the IIE-Pantnagar with the primary aim to have preliminary knowledge of the extent industrial impacts on the adjacent floral biodiversity. In the present study, interpretations on floral biodiversity were carried out at integrated industrial estate of Pantnagar (IIE-Pantnagar) in Uttarakhand, India. The IIE-Pantnagar is located with latitude between 28°59´51´´ and 29°01´12´´N and longitude between 79°24´9´´ and 79°26´15´´E, occupying 431 industries spread over 1310 hectares of land, which was earlier belong to agricultural farm of GBPUAT primarily used for intensive agriculture. However, the industrial estate currently poses only its half strength as barely 200 industries have commenced commercial productions while remaining are at their final stage of construction. The major types of industries that are established are FMCG (Fast Moving Consumable Goods), electroplating, plywood, pharmaceuticals, automobile and allied industries. This area encounters seasonal variations of climate throughout the year with high temperature in summer (March to June), intense rainfall in monsoon (July to September) and severe cold in winter (October to February). Maximum and minimum temperatures recorded in this region in year 2008 are 39.2°C and 6.7°C, respectively, with annual rainfall 950 mm. Monitoring of floral diversity was carried out in the vicinity of IIE-Pantnagar to quantify existing floral diversity in the particular area and monitoring locations are shown in Fig.1. Biodiversity of particular location usually expressed in terms of three hierarchical categories viz. genes, species, and ecosystems. Among these species diversity, its composition and competition broadly reflects historical as well as environmental factors that are acting upon it (Maihe and Krauchi, 2003). Moreover, enhanced level of species diversity of a particular ecosystem also enhanced its level of sustainability, therefore, considered as an indicator of the well-being of ecological systems. Therefore, the contemporary approaches in most of the developed countries are to establish biological monitoring programmes for different ecosystems in order to assess spatial and temporal changes (Yoccoz et al., 2001). However, in the present study, the preliminary aim was to estimate existing status in vegetation at the adjacent area of IIE-Pantnagar using species diversity measures over time and space. Various species of the community may be determined through different phytosociological methods like quadrat, transect and point. In vegetation analysis of a selected location, quadrat of any size, number and arrangements may be used depending upon the study area (Banerjee et al., 2008). For the present study the quadrat (1 × 1 m2), a square sample plot or unit used for detailed analysis of vegetation was used to determine floral pattern in surroundings of IIE-Pantnagar. The encountered vegetation of the study area was analyzed to calculate density, frequency & abundance (Curtis and Mclntosh, 1950) with standard methods as outlined in Ecology Work Book (Mishra, 1969). The theory of community succession illustrates that replacement process of plant individuals and species exists within a community (Horn, 1981). Therefore, relative abundance, density and frequency in respect to individual species for a particular location were used to compute Importance Value Index (IVI) of a particular species (Phillips, 1959). Species diversity was computed by using a measure which combines the two components viz. richness and abundance. Shannon-Wiener Index and Simpson’s Index were also measured to compare diversity indices between different monitoring locations. Quantitative analysis of vegetation for IVI was carried out following the approach of Mishra (1969). The IVI of a species in the community gives idea of its relative importance in community. The IVI of the individual species was computed considering species frequency, abundance and density and as expressed in equation 1. Importance Value Index (%) = Relative density + Relative frequency + Relative Abundance (1) Frequency of an individual species denotes its spatial pattern, importance and also the evenness of spatial distribution in community (Dale, 1999). It is also useful to illustrate the complexity and diversity of community at some extent. After determining the percentage frequency of each, various species were distributed according to the Raunkiaer’s law of frequency (RF), which were characterized by ‘A’ to ‘E’ frequency classes depending upon their frequency values as demonstrated in Table 1 (Braak, 1986). Density quantifies the strength of species in the community and therefore, considered as one of prime important character in determining community structure. Abundance is the number of individual species per quadrat of occurrence. Species distribution and abundance can vary both temporally and spatially, and may therefore, differ regionally in response to the species life history, habitat characteristics, resource availability and as well as based on natural and anthropogenic disturbances. Moreover, sound knowledge on species abundance is also requisite for the efficient management of introduced generalist species, which may live in a wide range of environmental conditions. The abundance to frequency ratio (A/F) of different species was therefore, computed to define the distribution pattern of the species (Whitford, 1949). This ratio indicates regular (<0.025), random (0.025 to 0.050) and contiguous (>0.050) distribution (Curtis and Cottam, 1956).Species richness (Ma) refers the number of species present in a given area or in a given sample, without entailing any particular regard for the number of individuals observed for individual species. Therefore, it is only a measure of the number of different kinds of organisms present in a particular area. However, species richness can be numerical or be related to area. It was McIntosh, who was first to coin the term species richness, but the actual concept is oldest and most fundamental of biological diversity (Peet, 1974). Biodiversity equals variety at the species level of biological organization. Therefore, species richness has become key concepts in conservation biology and is also an important characteristic of community structure. However, species richness makes use of both the number of species and the total number of individuals collected. Some communities may be simple enough to allow complete species counts to determine species richness. But in a complex ecosystem, species richness is determined by using formulae of Margalef (1958). Evenness is a measure of the relative abundance of the different species making up the richness of an area. A community dominated by one or two species is considered to be less even than one in which several different species have a similar abundance. Fundamentally, species diversity is the function of the species richness (Ma) and the evenness (Jsw) with which the individuals are distributed among these species.Evenness or equitability quantifies the unequal representation of species against a hypothetical sample where all species are equally abundant (Krebs, 1989). As evenness is computed by dividing the actual diversity with the potential maximum diversity of a selected location, therefore, low evenness value signifies a high dominance or presence of a few species. Further, when all species are equally abundant, an evenness index would be maximum and decrease towards zero as the relative abundances of the species diverge away from evenness (Ludwig and Reynolds 1988). Different measures of evenness have been proposed, however, in the present study, the Pielous evenness index was used to examine the distribution evenness of species and to reflect the species diversity of communities (Ma, 1994). Pielou Enenness index (Jsw) =- ∑ P i ln (Pi) / ln (S) (2) where, S = the number of species in a quadrat Pi = proportion of species 'i'relative to the total number of species Shannon index or Shannon-Wiener Index (H´) is basically used to evaluate diversity in categorical data. It is the information entropy of the distribution, treating species as symbols and their relative population sizes as the probability (Shannon and Wiener, 1963). Shannon index measures the average degree of uncertainty in predicting to what species individuals may be chosen at random and this uncertainty may be considered as synonym with the diversity present in the ecosystem (Ludwig and Reynolds 1988; Krebs 1989). Therefore, more the degree of uncertainty exists, more will be the diversity and simultaneously greater will be the degree of uncertainty in correctly predicting the identity of the next species chosen at random (Williams et al., 2005). Moreover, the index measures the degree to which species richness (Ma) and evenness (Jsw) changes across sampling level (Veech et al., 2002). The Shannon index was used in the present study because parametric statistics can be used to test significant differences between various surveys. The basic advantage of this index is that it takes into account the number of species and the evenness of the species; therefore, it is increased having either by additional unique species or by greater species evenness (Banerjee et al., 2008).Therefore, species diversity at each site was expressed by Shannon-Wiener index (Equation 4) where S is the number of the species in each site and Pi is the proportion of the population abundance of the ith species in each site.
The proportion of species 'i' relative to the total number of species (Pi) is computed, and then multiplied by the natural logarithm of this proportion (ln Pi). The resulting product is summed across species, and multiplied by -1. Simpson's index (1-D) proposes that diversity is related to the probability that two individuals randomly selected from a sample belong to the same species. Therefore, if the probability is high (D approaches to 1) then the probability will be higher for both that individuals to be belong within the same species and it suggests that the sample diversity is actually low and vice versa (Simpson, 1949; Williams et al., 2005). Krebs (1989) proposes the original form of D as D =∑ Pi2 (4) where Pi is the proportion of number of individuals of species i to N, and can be used to estimate Simpson’s index of diversity (1-D) only for an infinite population. However, according to some scientists depending on the sample size, Shannon–Wiener diversity index (H’) has a large bias, while Simpson's index of diversity (1-D) has not (Lande, 1996). Moreover, Shannon–Wiener diversity index was not as suitable for comparison of the species diversity in different communities with different number of species and/or individuals (Lande, 1996; Ito, 2007). For a finite population, the appropriate estimator of species diversity should be
where, 'ni' signifies the total no. of individuals of 'i' species and 'N' signifies the total number of individuals of all the species in the sample (Krebs, 1989). In site-1, Cynodon dactylon shows maximum IVI with 226.4 and therefore represents the most dominant species in that particular area (Table 2). All the four encountered species represent class ‘E’ as per Raunkiaer’s frequency classifications. Simpson’s index of biodiversity in the particular area was 0.28, representing presence of very less floral diversity. Species evenness in the particular site is very less (0.36) signifying that only few species are dominating in the particular monitoring location. Species richness of the particular area is 4, representing only 4 encountered species in location. Shannon-Wiener Index (H´) for the encountered vegetation was 0.506, signifying presence of less biological diversity. Distribution pattern for the site-1 for all the encountered species demonstrate contiguous distribution except for the Euphorbia hirta, which revealed random species distribution. As like as in monitoring location at site-1, Cynodon dactylon revealed maximum IVI (181.9) and therefore, represents the most dominant species in the site-2 (Table 3). The importance value index for all the remaining species exists at a range of 21 to 41, signifying major dominance of species C. dactylon in the area. Encountered vegetation was also distributed in different Raunkiaer’s frequency classes, which reveals L. camara as least frequent species to be found in the site. Parthenium sp. and Sorghum halepense represent class ‘D’ of Raunkiaer’s classifications, representing less frequent than the Cynodon dactylon. Distribution pattern for the Cynodon dactylon and Parthenium sp. also found as contiguous and remaining species demonstrate regular to random species distribution. Simpson’s index in the area is 0.41, which represent a greater amount of floral diversity in comparison to other monitoring sites. Species evenness (0.46) in the particular site signifies that only few species are dominating in the monitoring location. Species richness, which is the measure of number of species present in a given location, was 5 for site-2, more than the remaining two sites. Similar to species richness, Shannon-Wiener Index (H´) for site-2 was also higher (0.742) than remaining monitoring locations (Table 4). Despite having the same Raunkiaer’s frequency classes (E) for all the encountered species, Cynodon dactylon revealed maximum IVI with 197.2 at monitoring location-3, and therefore represents the most dominant species. Both C. dactylon and Parthenium sp. represent contiguous distribution pattern, while remaining two species exhibit random distribution. Simpson’s index in the area is 0.36, signifying presence of less diversity than that of site 2. Like other two sampling locations, species evenness in this particular site is also very less (0.39) and mostly dominant by the Cynodon dactylon followed by Parthenium sp. Species richness of this particular site is 4. Shannon-Wiener Index (H´), which is the measure of existing biodiversity was 0.541 Table 5. Simpson's index of diversity and Shannon-Wiener diversity index for all three sampling sites signifies that floral diversity among species in the particular region is very less. But if all the three sites are compared then site-2 represents maximum floral diversity over other two locations. This may be due to more disturbances within the industrial area at site-1 and site-3, either by anthropogenic activities or industrial activities than the site-2, which is primarily a vacant land outside the industrial estate boundary and lies between road and agriculture field. It can also be visualize that that above identified species present in this industrial estate is weeds or invasive species. Therefore, precautions should be taken in order to restrict the growth of these species as bioinvasion may be considered as a major threat to exploit local biodiversity. The present study concludes that the floral diversity at the surrounding of IIE-Pantnagar is at stake. Most of the fallow lands inside industrial estate were now fully covered by weed species. All the three monitoring locations showed very less diversity and it mostly consists with invasive species. Encountered vegetation also consists of very less species richness with maximum dominance of cynodon dactylon. Therefore, it was found necessary to take necessary actions like plantations of native ornamental plants in the fallow land so that the growth of bio-invasions can be checked adequately. Moreover, design of green belt is also recommended which not only enhance the scenic beauty but also be useful to restrict the dispersion of air pollutants. ACKNOWLEDGEMENTThis study has been undertaken as a part of the project on “Environmental Impact Assessment Study of SIDCUL Integrated Industrial Estate Pantnagar”, funded by Uttarakhand State Council for Science & Technology, Dehra Dun. Authors are thankful to Dr. P.C. Joshi, Resident Engineer, IIE-Pantnagar; Head, Department of Environmental Sciences; Dean, C.B.S.H & Director Experiment Station, G.B.P.U.A.&T., Pantnagar, for their technical assistance during this study. REFERENCES
Copyright 2010 - International Journal of Environmental Research The following images related to this document are available:Photo images[er10005t4.jpg] [er10005t6.jpg] [er10005f1.jpg] [er10005t5.jpg] [er10005t3.jpg] [er10005t2.jpg] [er10005t1.jpg] |
| |||||||||

