 |
| About Bioline | All Journals | Testimonials | Membership | News |
|
||||||
|
||||||
International Journal of Environmental Research, Vol. 4, No. 2, 2010, pp. 321-332 Heavy Metals in Water, Sediment and Some Fishes of Buriganga River, Bangladesh Ahmad, M. K.1*, Islam, S.2 , Rahman, S.3 , Haque, M. R.4 and Islam, M. M.1 1Department of Fisheries, University of Dhaka, Dhaka-1000, Bangladesh
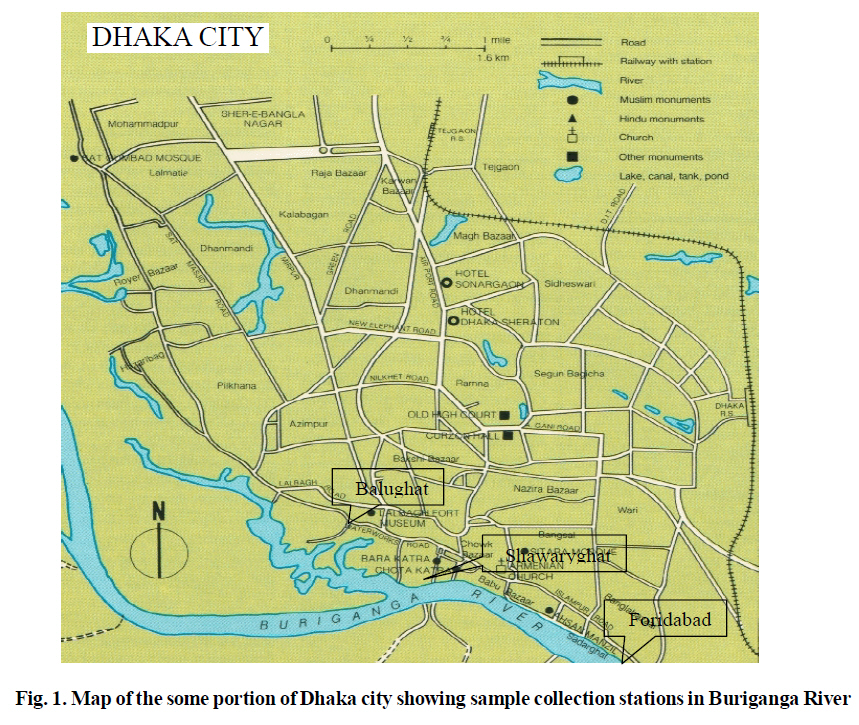
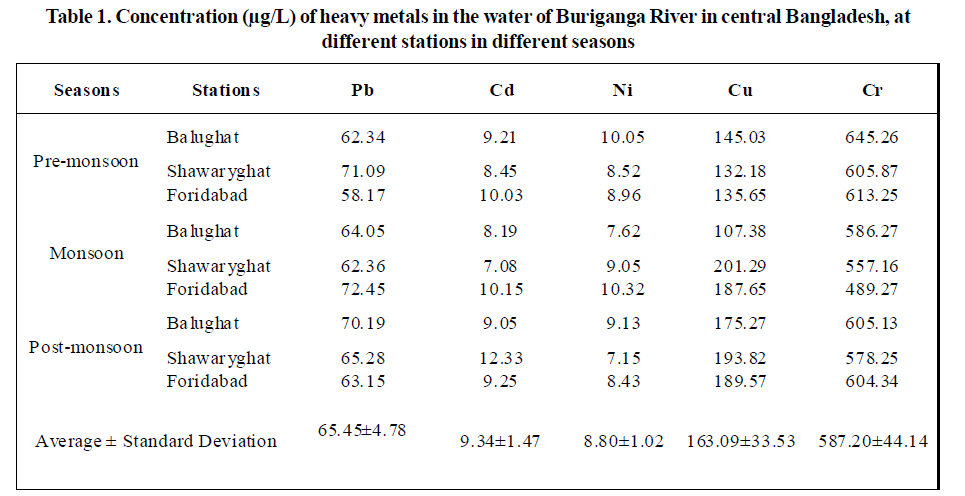
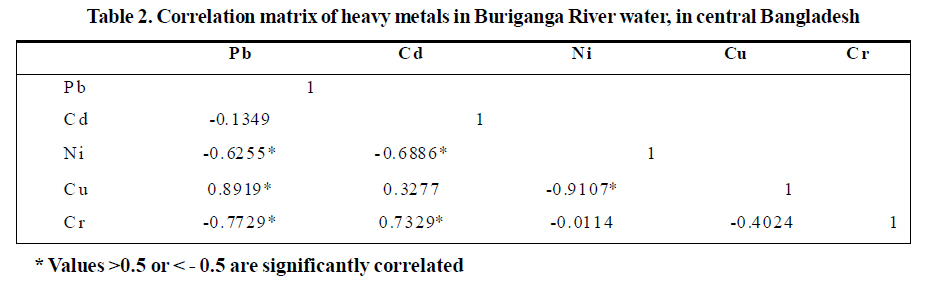
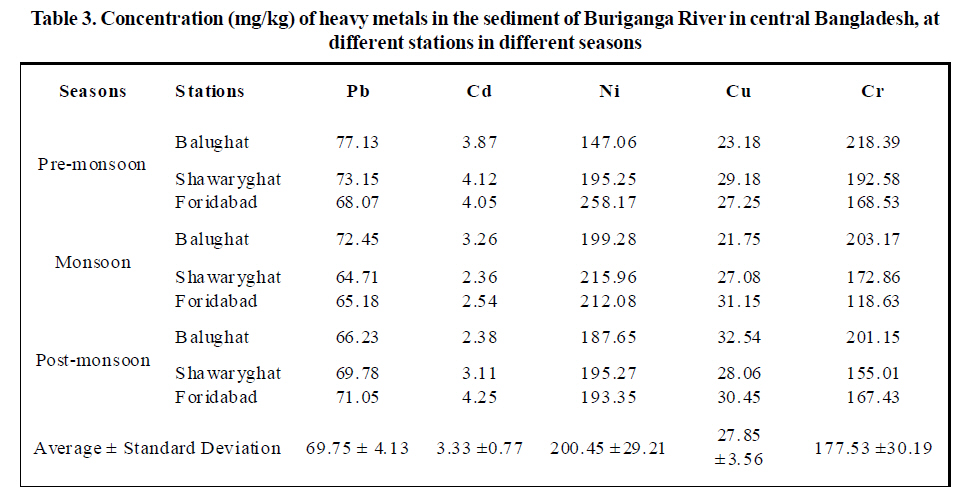
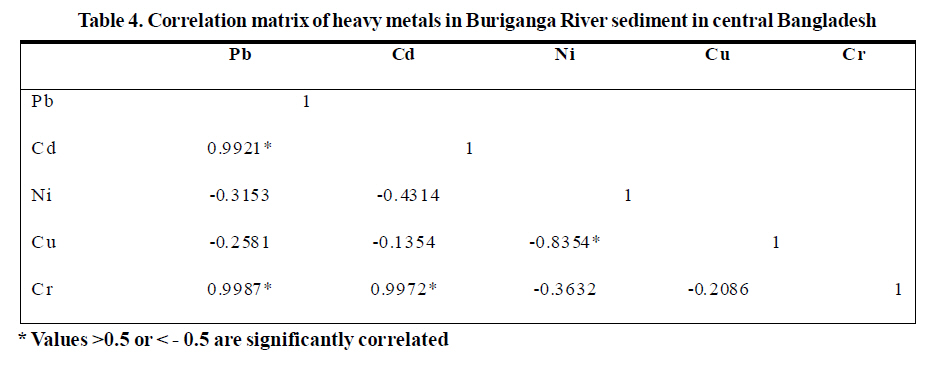
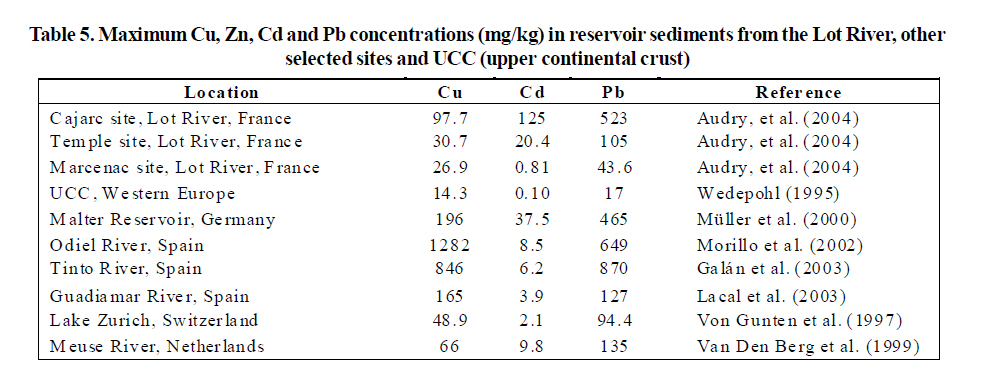
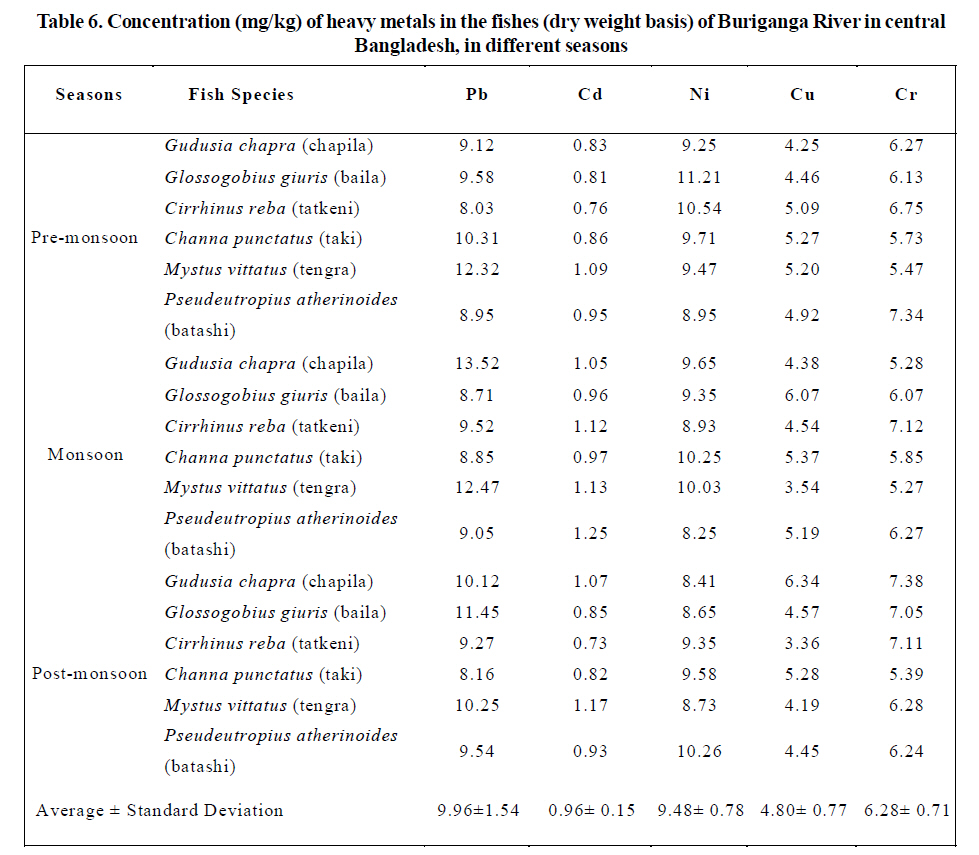
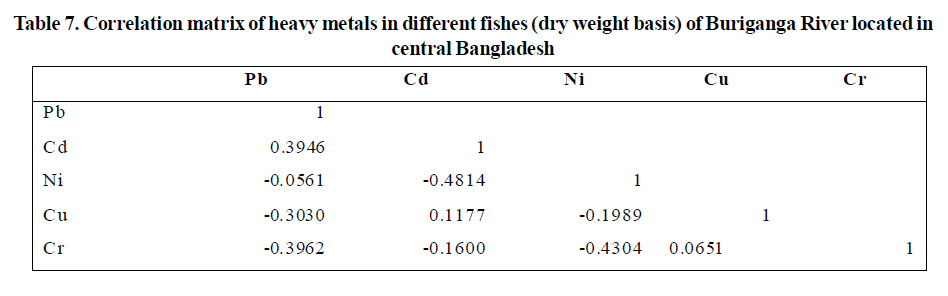
*Corresponding author E-mail: kawser_du@yahoo.com Received 14 Dec. 2008; Revised 25 Aug. 2009; Accepted 10 Nov. 2009 Code Number: er10035 ABSTRACT The spatial and temporal distribution of heavymetals in water, sediment and fish (dry weight basis) of Buriganga River, Bangladesh were determined by atomic absorption spectrophotometer. In water concentration ofPb, Cd, Ni, Cu andCr varied seasonally and spatiallyfrom 58.17to 72.45µg/L, 7.08 to 12.33µg/L, 7.15 to 10.32µg/L, 107.38 to 201.29µg/L and 489.27 to 645.26µg/L, respectively. Chromium was the most abundant in the water of Balughat during pre-monsoon, whereas, Cd was the most scarce in the water of Shawaryghat during monsoon. The sediment also showed spatial and temporal variation of Pb, Cd, Ni, Cu and Cr ranged from 64.71 to 77.13 mg/kg, 2.36 to 4.25 mg/kg, 147.06 to 258.17 mg/kg, 21.75 to 32.54 mg/kg and 118.63 to 218.39 mg/kg, respectively. Among all the metals studied in sediment, Ni was the highest at Foridabad during pre-monsoon and Cd was the lowest at Shawaryghat during monsoon. In six species of fish studied, the concentration of Pb, Cd, Ni, Cu and Cr varied seasonally from 8.03 to 13.52 mg/kg, 0.73 to 1.25 mg/kg, 8.25 to 11.21 mg/kg, 3.36 to 6.34 mg/kg and 5.27 to 7.38 mg/kg, respectively. Of the five metals studied Pb concentration was the highest in Gudusia chapra during monsoon, in contrast, Cd concentration was the lowest in Cirrhinus reba during post-monsoon. Some of the heavy metals’concentrations are higher than the recommended value, which suggest that the Buriganga is to a certain extent a heavy metal polluted river and the water, sediment and fish are not completely safe for health. Key words: Bioaccumulation, Heavy metals, Buriganga River, Water, Sediment, Fish, Bangladesh INTRODUCTIONThe River Buriganga running by the side of the Dhaka City, the capital of Bangladesh, is one of the most polluted rivers in Bangladesh. The Dhaka City is bounded by four rivers: Balu on the east; Tongi Khal on the north; Turag on the west; and Turag-Buriganga on the south, as shown in Fig. 1. The drainage of the City is mostly depended on the water levels of the peripheral rivers. The major drainage channels (locally known as Khal) in the City are Dholai khal, Gerani khal, Segunbagicha khal and Begunbari khal, which collect catchment’s runoff as well as wastewater and drain to the peripheral rivers. The Greater Dhaka City is one of the most densely populated cities in the world, home to approximately nine million people of which less than 25% are served by sewage treatment facility. Many industries have set up in and around the City during the last decade, and the number of new industries are continually increasing. As a direct consequence, the amount of untreated wastewater being discharged into the Buriganga has risen steadily. That is why; in the lean flow period of dry season (six months), quality of water within the 17 kilometre reach of the river is much lower than required for the sustainability of aquatic life, posing a severe threat to the aquatic ecosystem. Natural and human activities driven changes in the Buriganga river and the rivers around Dhaka city have in the dry seasons of the last decades caused a complete deterioration of water quality. The river Buriganga is increasingly being polluted with the city’s thousands of industrial units and sewerage lines dumping huge volumes of toxic wastes into it day and night (Islam et al., 2006). At present, Dhaka city alone generates about 3500 to 4000 m tons of solid wastes per day. The amount increases with the increase of population every year. The domestic, commercial, street sweeping, combustible and non-combustible wastes include discarded food, grass, plants, paper, cardboard, textiles, plastics, polythene materials, glass, metals, and construction debris. Heavy metals contamination in aquatic environment is of critical concern, due to toxicity of metals and their accumulation in aquatic habitats. Trace metals in contrast to most pollutants, not bio-degradable, and they undergo a global ecological cycle in which natural water are the main pathways. Of the chemical pollutants, heavy metal being non-biodegradable, they can be concentrated along the food chain, producing their toxic effect at points after far removed from the source of pollution (Tilzer and Khondker, 1993). Heavy metals that are introduced into the aquatic environment are ultimately incorporated into the aquatic sediments; organisms living in these sediments accumulate these heavy metals to varying degrees (Cross et al., 1970; Bryan and Hummerstone, 1971). Contaminated sediments may be derived from inputs of suspended solids to which toxic substances are adsorbed, such as soil particles in surface water run-off from fields treated with pesticides. Alternatively, the natural suspended material in a watercourse as well as the river bed surface can adsorb chemicals from the water. When the suspended material settles out, the toxic material forms a sink or reservoir; the extent to which this can cause harm to aquatic life depends on the strength of the bond between the chemical and the particles. Substances with a very low solubility in water can be tightly bound and persist in the sediment for a long time. However, they may not be available for uptake by organisms in the sediment unless there is a direct route of entry trough the skin surface or the gut. Although very low, the sediments are likely to continue for a long time at a slow steady rate. The toxic effect of such heavy metals, which are not utilized in the synthesis of new substances useful to the organisms, lies in their ability to be stored up in enzymes and displace chemically similar elements. In this way vital bio - chemical reactions are blocked. Such an accumulation of heavy metals can harm the organism itself or can be transmitted to the trophic level of the food chain, where a similar toxic process can take place. In discriminate use of these potential toxic chemicals in the agricultural field ultimately drains into the adjacent water bodies and are carried downstream through the river waters. Their subsequent incorporation into the food chain, with biological magnification, at highest tropic level, risks the stability of biota itself and also results in the disruption of the biogeochemical cycles of the ecosystem. The problem may be exacerbated due to increased concentrations of toxicants during summer paddy cultivation when rivers have low discharge (Karim, 1994). In Bangladesh the concentration of heavy metals in fish, water and sediment are studied by some authors but Chowdhury (1994), Hossain (1996), Khan et al. (1998), Sharif et al. (1991, 1993a, b, c), Bhowmik (2002), Ahmed (2000), Ahmed et al. (2002, 2003, 2009a,b,c) and Haque et al. (2003, 2004, 2005, 2006, 2007) are prominent. Although no complete study in the river Buriganga has been carried out so far. Thus, it is important to determine the intensity of pollution by inventorying the heavy metal concentrations and their spatial and temporal distribution in water, sediment and fish of Buriganga River. For the determination of heavy metals, the samples of water, sediment and fish were collected from three stations such as Balughat, Shawaryghat and Foridabad of Buriganga river during pre-monsoon, monsoon and post-monsoon (Fig.1).The Balughat station is under the Hazaribagh thana of Dhaka city where a lot of tanneries discharge their effluent. On the other hand Shawary ghat and Foridabad stations is industrial and heavily populated zone. The water samples were collected in plastic bottles and acidified immediately with 2 mL of HNO3 per litre of water and preserved in refrigerator at 4ºC for laboratory analysis. The sediment samples were collected by vertical corer and Ekman grab sampler. Six different species of adult fish such as Gudusia chapra (chapila), Glossogobius giuris (baila), Cirrhinus reba (tatkeni), Channa punctatus (taki), Mystus vittatus (tengra) and Pseudeutropius atherinoides (batashi) were collected from river fishermen of Shawaryghat station. The fish were washed, weighed and dried in an oven at 105ºC for 3 days until gaining constant weight. After cooling in a desiccators, the samples were grinded by carbide mortar and pastel to make powder and homogenised. The powdered sample was finally stored in a pre-cleaned dry plastic bottle and preserved in desiccators for further analysis. For the quantitative analyses of Pb, Cd, Ni, Cu, and Cr, the fish samples were digested. Dried (0.5 g) powder was taken in a long test tube. Then 1.0 mL 70% HClO4, 4 mL concentrated HNO3 and 1.5 mL concentrated H2SO4 were added into the test tube. The samples were then heated gently in an oil bath (~ 1000C) until the solid mass was dissolved. If sample was not clear 4 mL of HNO3 was added into the test tube and repeated until the solution was clear. Finally, the mixture was boiled at about 2100C in order to drive off the acids except H2SO4 and then it was cooled down at room temperature. Blank digestion was also performed to quantify possible contamination during sample preparation and analysis. The standard solution of the elements Pb, Cd, Ni, Cu, and Cr were prepared by pouring the required amount of the solution from the stock solution, manufactured by Fisher Scientific Company, USA. The standard solution was prepared before every analysis of the current work. The samples were analyzed by using air acetylene flame with combination, as well as single element hollow cathode lamps into an atomic absorption spectrophotometer (Shimadzu, AAS –6800). The analytical quality of the work was checked by analysis of standard reference materials NBS-SRM-1573, Tomato leaves and NBS-SRM-1566, Oyster tissue, prepared by the National Bureau of Standards, Washington DC, USA. The analytical procedures were also calibrated against the above standard reference materials. The average recovery ranged between 94 to 107%. Statistical software SPSS version 12 was used to analyse the data using ANOVA followed by LSD post-hoc for multiple comparison. The correlation matrix was carried our by Microsoft XL. RESULTS & DISCUSSIONThe concentrations of heavy metals in the water of Buriganga River, collected in three seasons from three locations are given in Table 1. Among all the metals studied in the water, Cr concentration was the highest, while, Cd concentration was the lowest. The Pb, Cd, Ni and Cu in water were not differed significantly (P>0.05) in pre-monsoon, monsoon and post-monsoon whereas Cr of water in pre-monsoon was significantly different (P<0.05) than that of monsoon. The variations of heavy metal concentration are mainly due to different collection spots and seasons. All the concentrations of Cr were higher than the standard level (50 µg/L) given by EQS (1991). The correlation matrix shows both positive and negative significant correlations among heavy metals (Table 2). The main reason for higher Cr at Balughat during pre-monsoon is due to discharge of untreated waste from large number of tanneries. The low water level of pre-monsoon also deteriorated the situation. The non-point sources of Cr may also find their way into the Buriganga River with rain water and sewage. In Foridabad during pre-monsoon the highest (645.26 µg/L) level of chromium was detected, whereas the lowest was also detected in the same place during monsoon. Although, Alam et al. (2003) found higher concentration of Cr in rainy season (3-13 µg/L) than the concentration of dry season (1.2-8µg/L). Khanet al. (1998) found the concentrations of Cr ranged from 0.015 to 0.491 µg/mL in the water of the GBM (Ganges-Brahmaputra-Meghna) estuary, values that are lower than the present study. The lower level of Cd at Shawaryghat during monsoon is due to dilution by rain water as well as runoff. The mean concentration (9.34 µg/L) was much lower than the drinking water standard limit (5000 µg/L) provided by EQS (1991) and Haque et al. (2000). Alam et al. (2003) found that in Buriganga River the Cd concentration varied between BDL (beyond detection limit-0.2 µg/ L) to 1.0 µg/L in rainy season and 1.7-10.60 µg/L in dry season. Ahmed (1998) reported the concentration of Cd ranged between 0.018 and 0.007 ppm in water of the Sundarban Forest Reserve. Rao et al. (1985) found the ranged between 0.9 and 1.3 µg/g in dissolved form and 6.6 and 18 µg/ g in particulate form. Much higher values than the current study, ranging between 0.2 and 0.4 µg/g have been reported from Ostofjorden, Norway and Liverpool Bay, UK by Peterson et al. (1972) and Rojahn (1972), respectively. Khan et al. (1998) found the concentration of Cd ranged from 0.001 to 0.107 µg/mL in the water of the GBM estuary, some of which are much lower and some are much higher than the present study. The highest (72.45 µg/L) and the lowest (58.17 µg/L) concentration of Pb were found in Foridabad during monsoon and pre-monsoon, respectively. However, all the values including the average concentration (65.45 µg/L) was much higher than the drinking water standard limit (50 µg/L) provided by EQS (1991) and Haque et al. (2000). Alam et al. (2003) found that in Buriganga River the Pb concentration varied between 0.1-0.7 µg/L in rainy season and 5-14.4 µg/L in dry season, which are much lower than the present study. Khan et al. (1998) found that the concentration of Pb ranged from 0.012 to 0.431 µg/mL, which are much lower than the current study. The lowest (7.15 µg/L) concentration of Ni was in Shawaryghat during post-monsoon, whereas, the highest (10.32 µg/L) was in Foridabad during monsoon. Both of these values are much lower than the standard limit (100 µg/L) for drinking purpose (Haque et al., 2000). Ni is mainly transported in the form of a precipitated coating on particles and in association with organic matter. Ni may also be absorbed on to clay-particles and via uptake by biota. Absorption process may be reversed leading to release of Ni from the sediment. Cu concentration was the highest (201.29 µg/L) and the lowest (107.38 µg/L) in Shawaryghat and Balughat, respectively during monsoon. However, the average concentration was (163.09 µg/L), which is well below the safe limit (1000 µg/L) for drinking purpose (Haque et al., 2000). Ahmed (1998) reported lower concentration of Cu ranged between 0.11 and 0.021 ppm in water of the Sundarban Forest Reserve, than the present study. Rao et al. (1985) found that the Cu concentration ranged between 6.8 and 30.6 µg/L in dissolved and 822 and 1801 µg/g in particulate form in Vishakhapattam. Metallic Cu causes no undesirable change in fish. However, its salts (chlorides and litigates) are toxic even at a concentration of 0.01 to 0.02 mg/L (Metelev et al., 1983).Ahmed et al. (2009a) studied the heavy metal concentration in water of the Shitalakhya River, Bangladesh and found the concentration of Ni ranged from 4.31 to 7.83 µg/L, Pb 41.24 to 63.15 µg/L, Cd 7.12 to 10.11 µg/L, Cr 192.18 to 234.32 µg/L, and Cu 156.38 to 254.07 µg/L, which are more or less similar with the present study and the findings of Ahmed et al. (2009b), who investigated the heavy metal concentration in the water of Dhaleswari River, Bangladesh. The concentrations of heavy metals in the sediment of Buriganga River are given in Table 3. Out of five metals investigated in sediment, Cd concentration was the lowest at Shawaryghat during monsoon, whereas, Ni was the highest at Foridabad during pre-monsoon. The Pb, Ni, Cu and Cr in sediment were not differed significantly (P>0.05) in pre-monsoon, monsoon and post-monsoon whereas Cd of water in pre-monsoon was significantly different (P<0.05) than that of monsoon. The correlation matrix shows both positive and negative significant correlations among heavy metals (Table 4). The variation of concentration of heavy metal from locations to locations may be correlated with the flow of the rivers and location of industries and their waste disposal system (Alam et al., 2003). The Cd concentration in the Sediments of the Baltic Sea ranged between 0.2 and 2.2 µg/g, while the values for the North Sea are below 1 µg/g for 80% of the samples (Nicholson and Moore 1981). Mehedi (1994) found that the concentration of Cd ranged from 0.8 to 0.88 µg/g and Cu ranged from 3.8 to 60.88 µg/g in the shipbreaking area of Chittagong. Chester and Stonar (1975) found as high as 2424 µg/g of Cu and 624 µg/g of Cr in sediments of Sorfijord, West Norway. Bryan and Hummerstone (1977) studied the heavy metal concentration in the Looe estuary, Cornwall, England and found the highest concentration of Cr as 5 µg/g. In the sediment the highest (77.13 mg/kg) concentration Pb was found in Balughat during pre-monsoon and the lowest in Shawaryghat during monsoon. Khan et al. (1998) reported the Pb concentration ranged from 2.355 to 26.086 mg/kg in sediment in GangesBrahamputra-Meghna Estuary. The highest (32.54 mg/kg) and the lowest (21.75 mg/kg) concentration of Cu were found during postmonsoon and monsoon, respectively in Balughat. The concentration of Cu, Cd and Pb in reservoir from Lot River, other selected sites and UCC (upper continental crust) are given in Table 5. Most of these levels are higher than the present study. In Foridabad during monsoon the lowest (118.63 mg/kg) level of Cr was detected mainly due to rain water and run off. The highest (218.39 mg/kg) was detected in Balughat during pre-monsoon. Discharge of huge tannery waste and less rain water and run off are the main reasons for this. Sediment is the ultimately depository of many chemical compounds including heavy metals from natural and anthropogenic sources. Aquatic organism living in the sediment accumulates heavy metal to a varying degree (Bryan and Hummerstone, 1977). Ahmed et al. (2009a) studied the heavy metal concentration in sediment of the Shitalakhya River, Bangladesh and found that the concentration of Ni ranged from 120.96 to 131.94 mg/kg, Pb 54.52 to 65.90 mg/kg, Cd 1.71 to 2.17 mg/kg, Cr 60.09 to 91.02 mg/kg, and Cu 56.07 to 91.51 mg/kg in dry weight basis, which are slightly lower than the present investigation, except for Cu. Ahmed (1998) found the highest and lowest concentration of Pb as 61.66 and 10.96 mg/kg, Cd as 0.817 and 0.121 µg/g, Cu as 50.5 and 6.89 µg/g and Cr as 120.8 and 20.2 µg/g, in sediment of the Sundarban Forest Reserve. According to Legorburu and Canton (1992) the standard values from the analysis of marine sediment (SD-N1/2), in the IAEA laboratory in Monaco, were 120 mg/kg for Pb, 11 µg/g for Cd, 72 µg/g for Cu and 149 µg/g for Cr.The present investigations show lower concentration of the above heavy metals except for Cr. However, the certified value of Pb from the USSR standard reference material No. 2499 -83, Soil SDPS-2 is 7 ± 5 µg/g and the present study reported higher concentrations of Pb than the certified value and therefore may not safe for soil and benthic community and ecosystem. Table 6 represents the concentration of heavy metals in the fish (dry weight basis) of Buriganga River during different seasons and in different places. The Ni and Cu were not differed significantly (P>0.05) among fishes, whereas Pb, Cd and Cr were differed significantly (P<0.05). Pb was differed significantly between Tatkini and Tengra, Taki and Tengra, and Batashi and Tengra. Cd was differed significantly between Tatkini and Tengra, Taki and Tengra, and Baila and Tengra. Cr was differed significantly between Tatkini and 125 523 Audry, et al.(2004) Tengra and Tatkini and Taki. The correlation matrix shows no significant positive and negative correlations among heavy metals (Table 7). However, seasonal variations as well as species variations of heavy metals’ concentration were found. Among the five metals studied, Pb concentration was the highest in chapila during monsoon, whereas, Cd concentration was the lowest in tatkeni during post-monsoon. These variations in concentrations are mainly due to feeding habits, chemical form of freshwater environment, season of the year and detoxification process. Organism can uptake the metals directly or with food particles from water body and then these metals are being bound into the different parts of the body of the organism and may cause harmful effect. During pre-monsoon heavy metals’ concentration in water were much higher than those of other seasons. As a result, the fish absorbed more heavy metals during pre-monsoon and at the start of monsoon their concentration increased. The lowest concentration of heavy metals in tatkeni is due to the fact that during monsoon the fish absorbed less metal and at the start of post-monsoon its concentration decreased. The highest level of Pb was found in chapila (13.52 mg/kg) during monsoon and the lowest in tatkeni (8.03 mg/kg) during pre-monsoon. Pb is known to be readily incorporated in calcium carbonate skeletons. Holden and Topping (1972) found that Pb concentrations ranged from 0.5 to 1.0 mg/kg on a wet weight basis of different fish species. Cd concentration was the highest in batashi (1.25 mg/kg) during monsoon and the lowest in tatkeni (0.73 mg/kg) during post-monsoon. May and McKinney (1981) monitored freshwater fish from USA and found Cd concentrations ranging from 0.01 to 1.04 mg/kg (wet weight), the mean being 0.085 mg/kg. Hardisty etal.(1974) sampled flounder (Platichthyes flesus) from the seven estuaries of UK and found the mean concentration of 3.4-7.3 mg/kg (dry weight) of Cd. Ahmed et al. (2009b) studied the heavy metal concentration in fish from the Dhaleswari River, Bangladesh and found the seasonal variation of Cd (0.52-0.8 mg/kg), Cr (9.38-19.65 mg/kg), Pb (7.03-12.18 mg/kg), Cu (7.55-11.50 mg/kg) and Ni (9.55-13.35 mg/kg). The present study shows slightly higher concentration of Cd, Pb and Cu and slightly lower concentration of Ni and Cr than the above author. Average Ni concentration was 9.48mgkg-1 in fish but in baila during pre-monsoon the highest (11.21 mg/kg) level was found. Aquatic organisms living in the sediment accumulate heavy metal to a varying degree (Bryan and Hummerstone, 1977). Cu level was the highest (6.34 mg/kg) in chapila during post-monsoon and the lowest in tatkeni (3.36 mg/kg) during the same time. Zindge et al. (1979) found that the Cu concentration ranged between 2.80 and 12.40 ppm in different fish species. Khan et al. (1987) found that Cu varied between 0.65 and 58.1 mg/kg on a dry weight basis for five different species of fish in the Bay of Bengal region of Bangladesh coast. Chapila contained the highest level of Cr during post-monsoon, whereas, tengra contained the lowest level during monsoon. Roth and Hornung (1977) found that Cr varied between 2.8 to 4.9 mg/kg on a wet weight basis for different species of fish. Ahmed et. al. (2009a) investigated the heavy metal concentration in fish and oyster from the Shitalakhya River, Bangladesh and found seasonal variation of Ni, Cr, Cd, Pb and Cu ranged from 8.19-9.07 mg/kg, 8.12-9.07 mg/kg, 1.09-1.21 mg/kg, 9.16-13.09 mg/kg and 5.47-8.19 mg/kg, respectively. The current investigation finds slightly higher concentration of Ni and slightly lower concentration of Cr, Cd, Pb and Cu than the above study. Şirelil et al. (2006) measured much lower concentrations of Cd and Pb than the current study, in vacuum packaged smoked fish species (mackerel, Salmo salar and Oncorhynhus mykiss); which varied from 0.003 to 0.036 mg/kg with a mean of 0.01367 mg/kg for Cd, and 0.001 to 0.791 mg/kg with a mean of 0.17710 mg/kg for Pb. Ashraf (2006) studied 57 samples of canned tuna fish and found the concentration of Pb, Cr, Cd, Cu, Ni, and Hg ranged between 0.14 and 0.82, 0.10 and 0.57, 0.08 and 0.66, 0.02 and 0.33, 0.09 and 0.48 and 0.18 and 0.86 mg/kg respectively, which are much lower than the present findings. Burgera and Gochfeld (2005) found As, Cd, Pb, Mn and Hg ranged from 0.23 to 3.3, 0.0001 to 0.01, 0.04 to 0.12, 0.1 to 1.0 and 0.05 to 0.6 ppm, respectively in the flounder, bluefish, yellowfin tuna, Chilean sea bass, cod, croaker, porgie, red snapper, whiting, shrimp (large and small), and scallops of New Jersey, USA, which are also less than the current findings. They found inter-specific differences in levels of metals for all metals. However, the same metals in fish did not have the highest values for more than two metals.They suggested that the differences were due to geography, trophic level, size, foraging method/location, and propensity of metals to undergo bio-magnification in the food chain. Sharif et al. (1993b) studied the heavy metal concentration in T. vagina and found the concentration of Ni, Cu, Pb and Cd as 2.4 ± 0.00, 3.76 ± 0.48, 2.42 ± 0.27 and 0.11 ± 0.00 mg/kg (dry weight basis), which are much lower than the present study. There may be several reasons for this; firstly, unlike the current study where fish were collected from one of the polluted rivers, in Sharif et al.’s(1991), study, fish bought from auction markets originated from variable habitats. Secondly, only the flesh of fish, which contains relatively less amount of heavy metal than other parts of the body (Wright 1976), was analysed, while on the other hand, the whole body was analysed in the current experiment. Moreover, the size was variable (100-500 g), whereas the present study was conducted with adult fish. Sharif et al. (1991, 1993c) found much lower concentrations of Pb, Cd and Cr in different marine fish such as Lates calcarifer, Pangasius pangasius, Polynemus indicus, Ilisha megaloptera, Racouda russelliana, Leander styliferus, Rastrelliger kanagurta, Scomberomorus guttatum, Polynemus paradiseus and Usteogeniosus militaris of the Bay of Bengal than those of our investigation and well below the permissible levels for human consumption. These variations are likely to be due to habitat differences, in addition to the reasons mentioned above for Sharif et al. (1993b). Haque et al. (2006) studied the seasonal variation of heavy metal concentrations in Gudusia chapra inhabiting the Sundarban mangrove forest and found the concentration of Cu, Zn, Fe, Pb, Cd, Cr and Ni seasonally varied from 0.527 to 3.99, 5.34 to 25.9, 0.038 to 0.221, 0 to 3.396 and 0.176 to 89.5 µg/g dry weight basis, respectively. The concentrations of these heavy metals are well below those of the present findings. In the present investigations some heavy metals’ concentrations are higher than the safe recommended value, which suggest that the Buriganga is partly a heavy metal polluted river and the water, sediment and fish are not fully safe for human health and ecosystem. With the gradual development of industry, intensive use of pesticides and discharge of untreated domestic sewage may further exacerbate the situation in coming years. ACKNOWLEDGEMENTThe authors are grateful to Department of Soil Water and Environment, University of Dhaka for giving permission to use the laboratory facilities and their kind cooperation during the course of the present study. REFERENCES
Copyright 2010 - International Journal of Environmental Research The following images related to this document are available:Photo images[er10035t5.jpg] [er10035f1.jpg] [er10035t6.jpg] [er10035t1.jpg] [er10035t7.jpg] [er10035t3.jpg] [er10035t4.jpg] [er10035t2.jpg] |
| |||||||||
