 |
| About Bioline | All Journals | Testimonials | Membership | News |
|
||||||
|
||||||
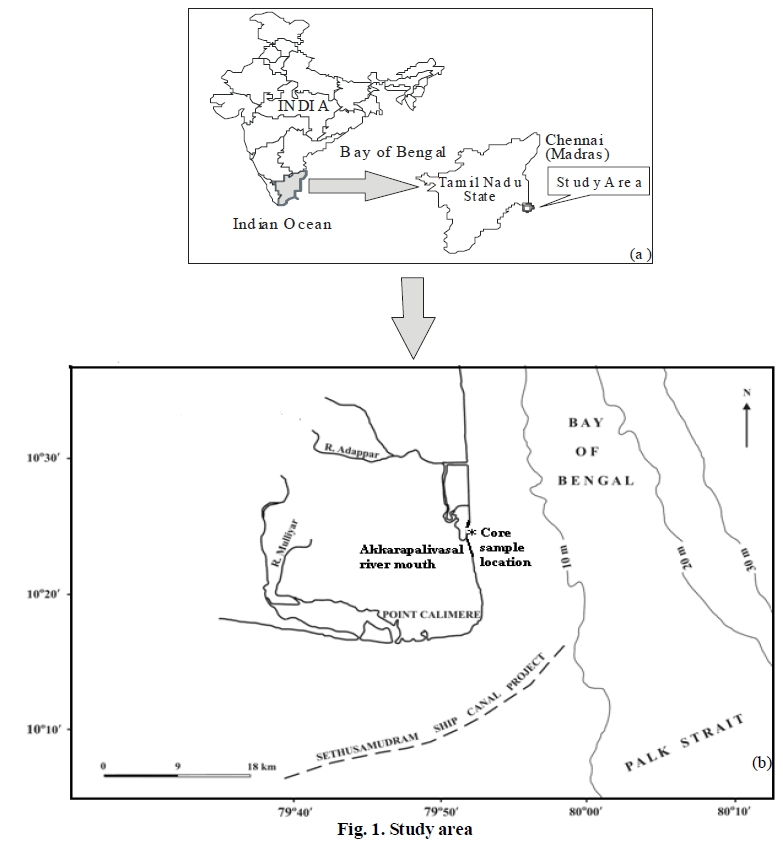
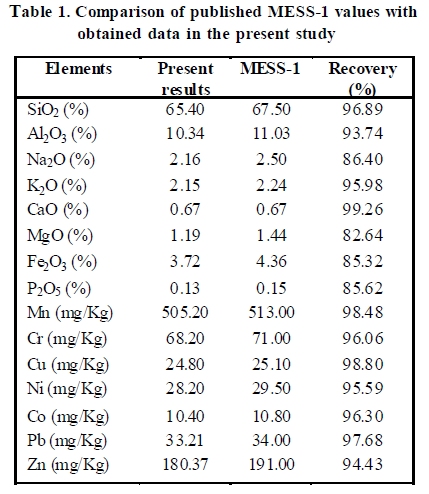
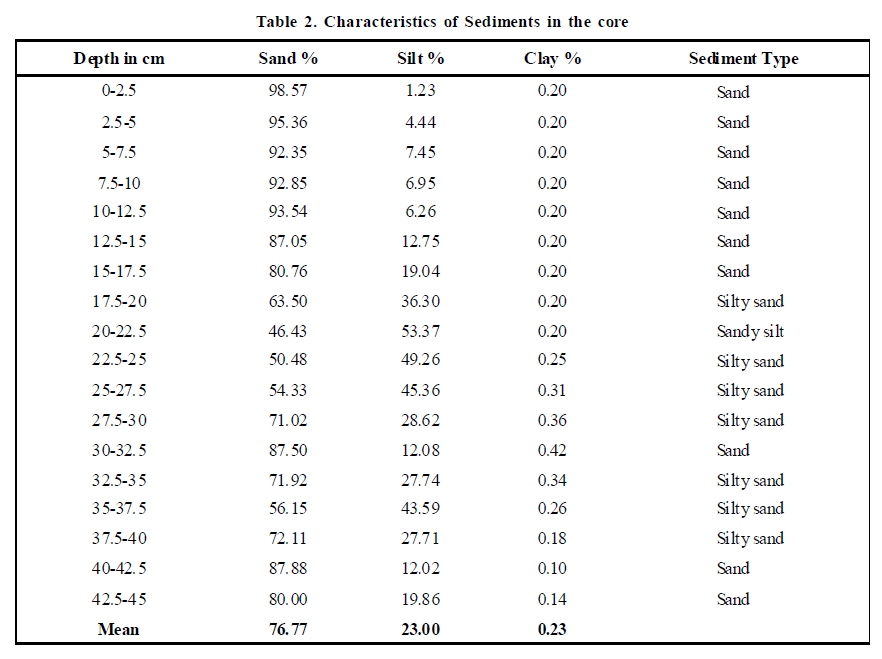
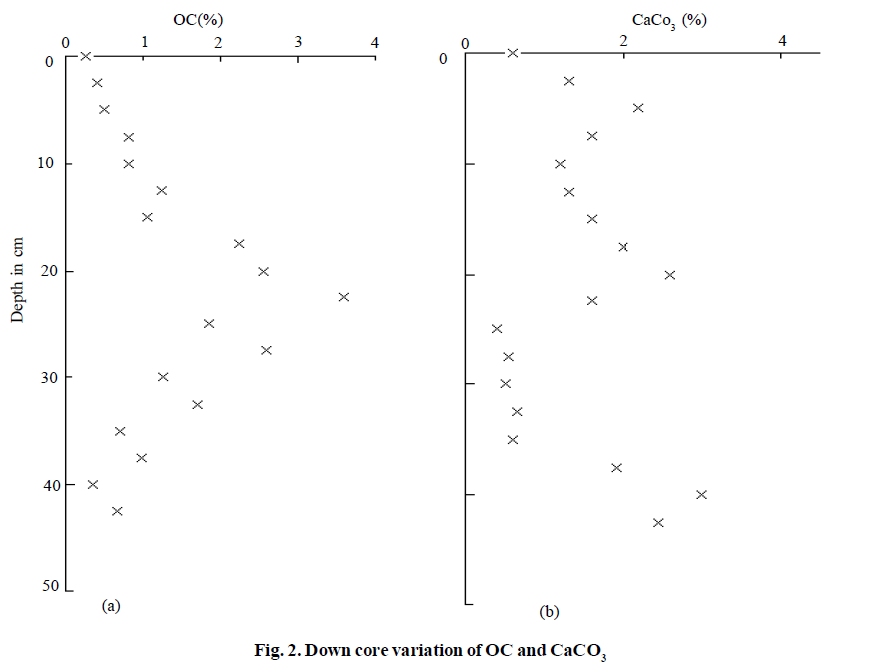
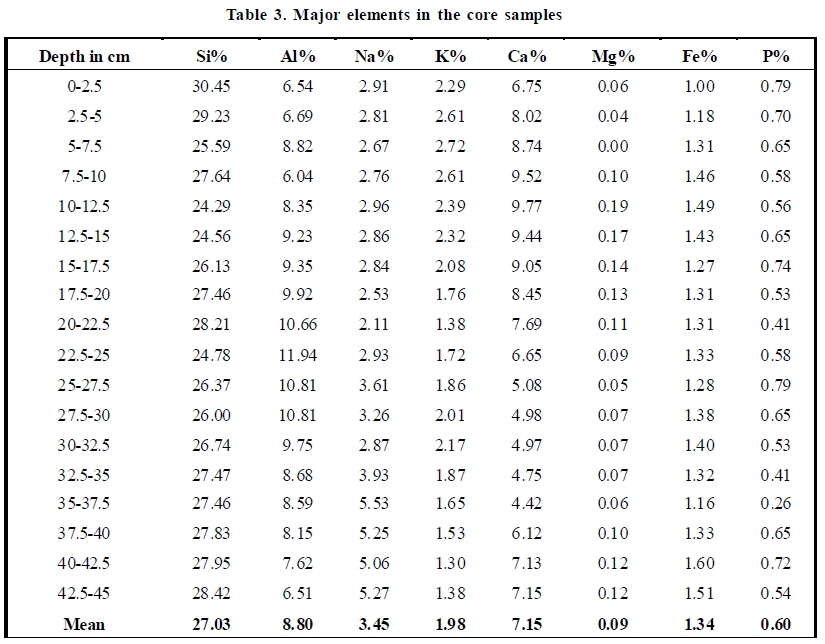
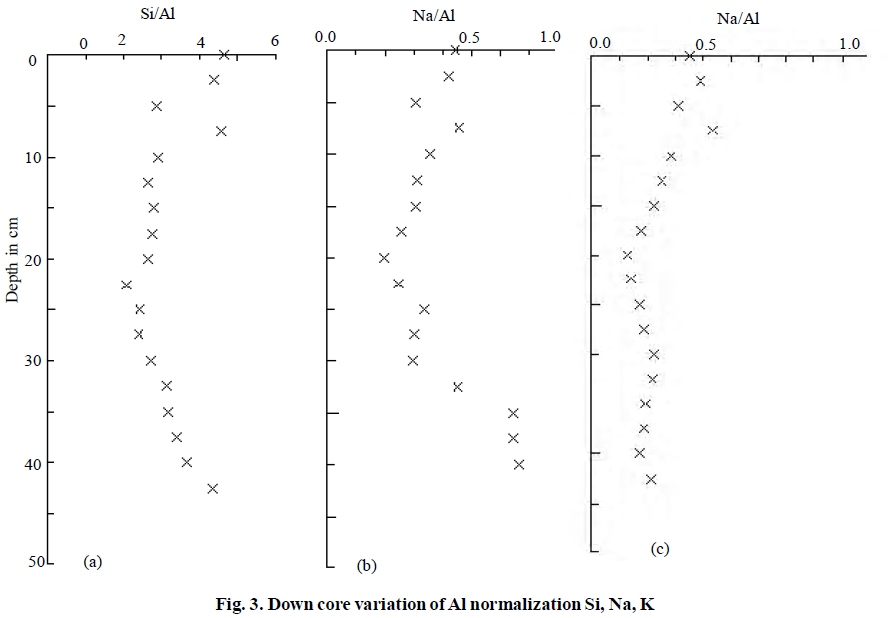
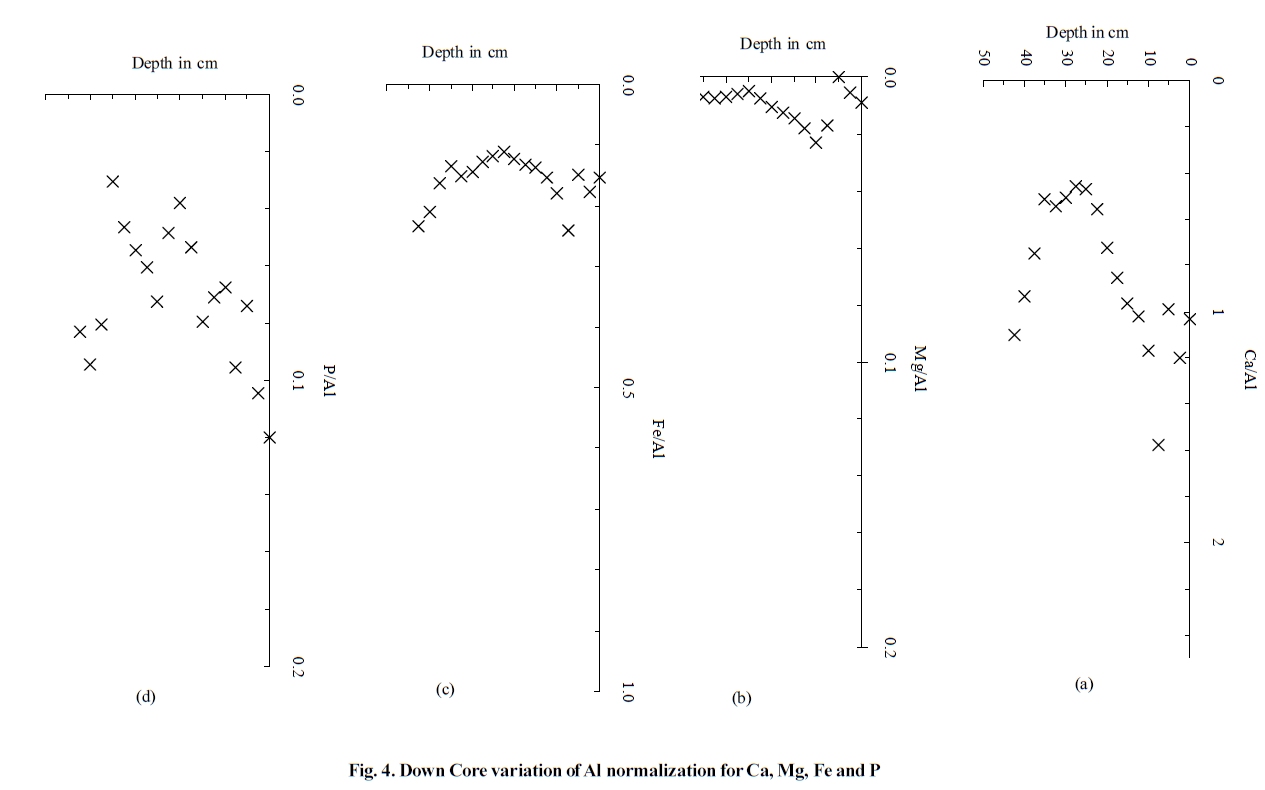
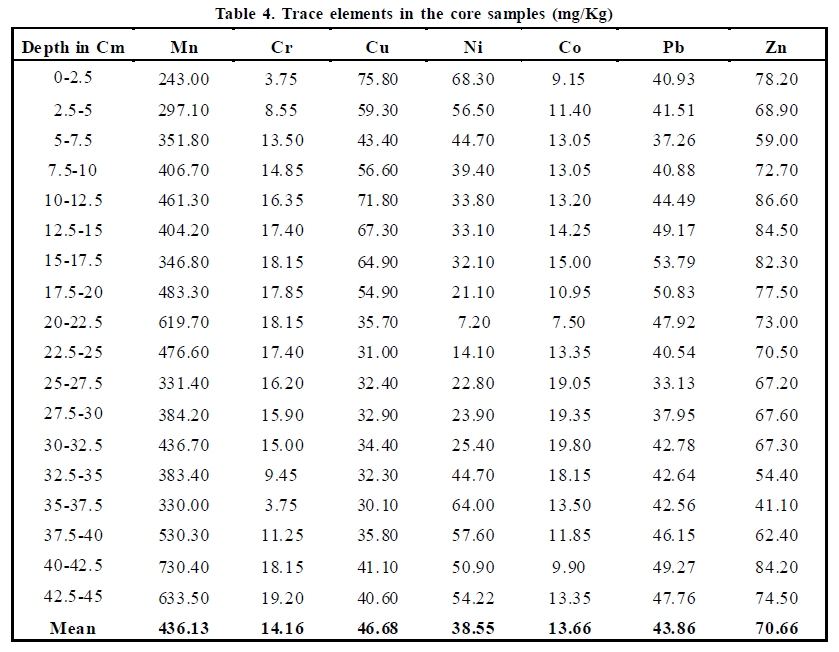
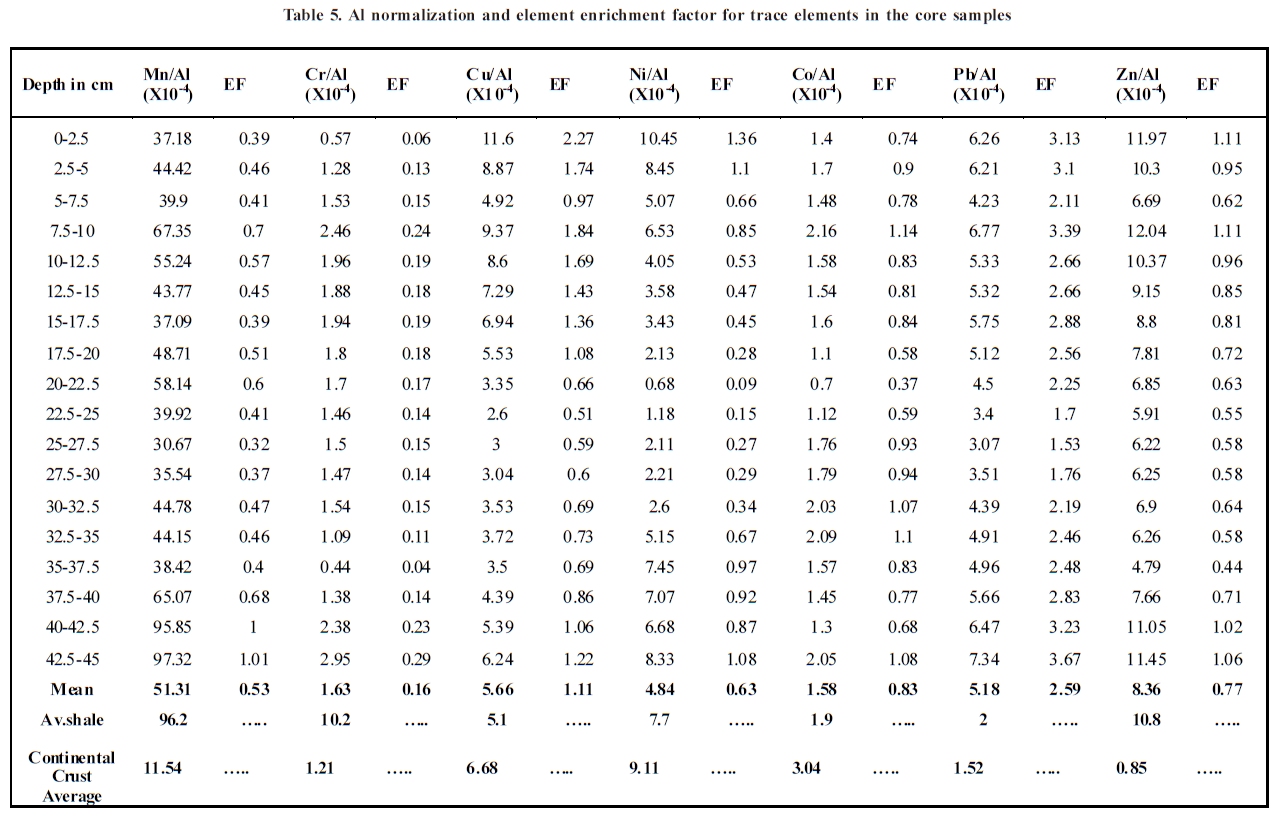
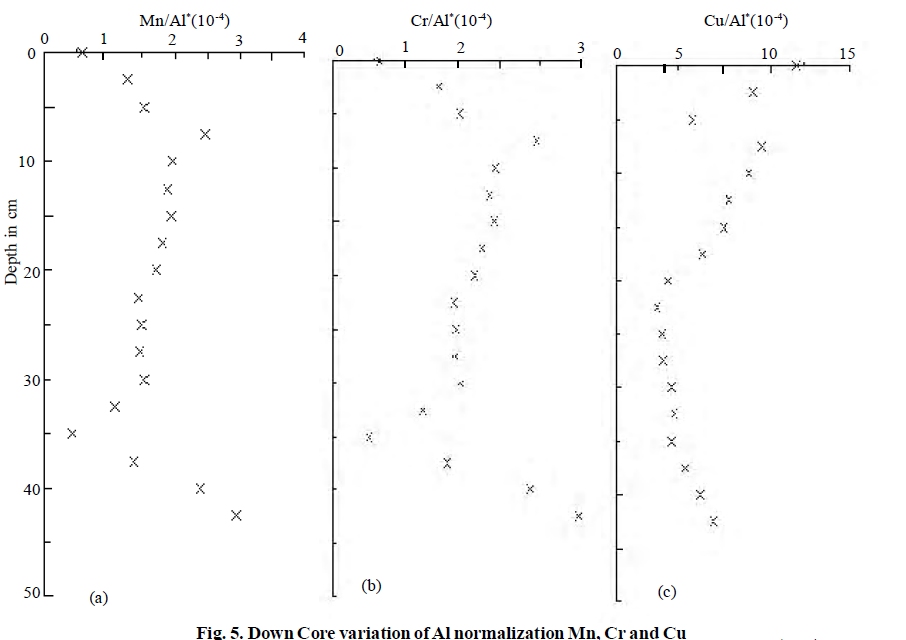
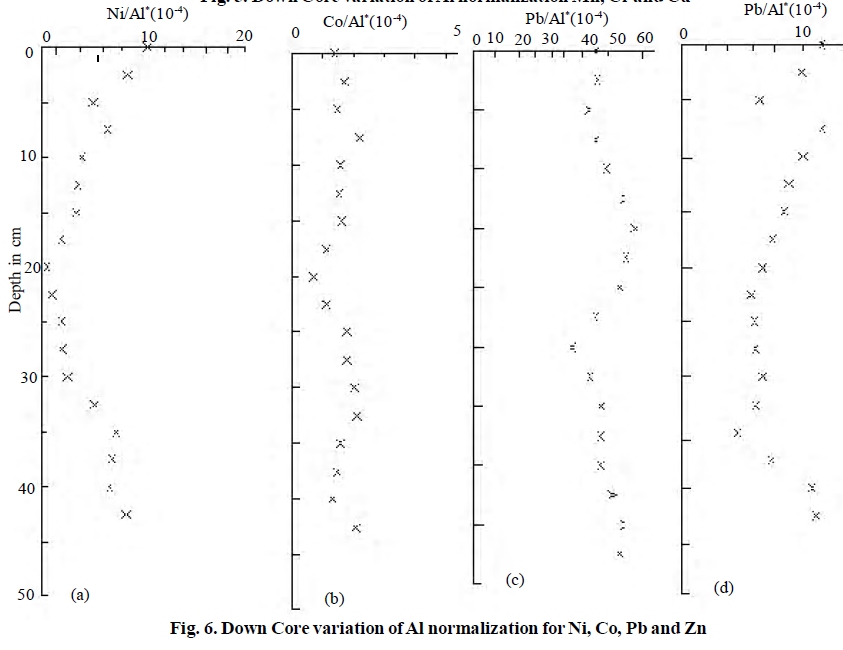
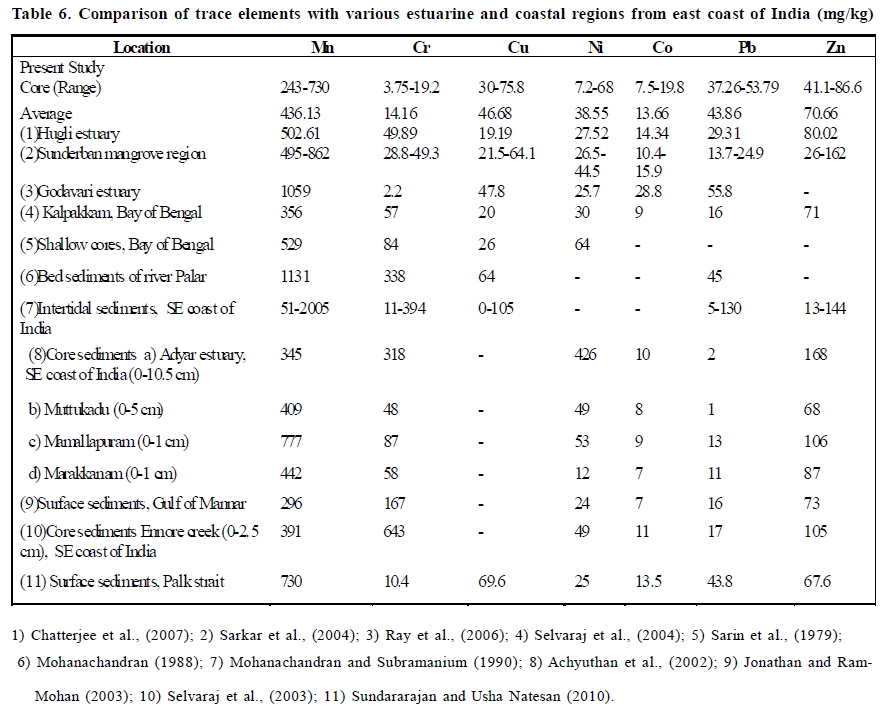
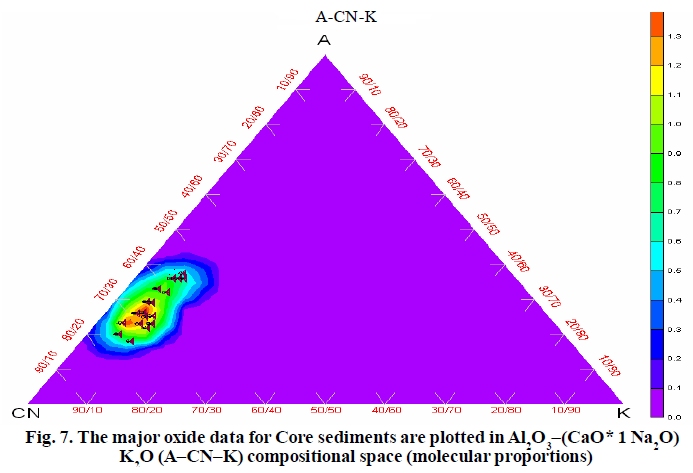
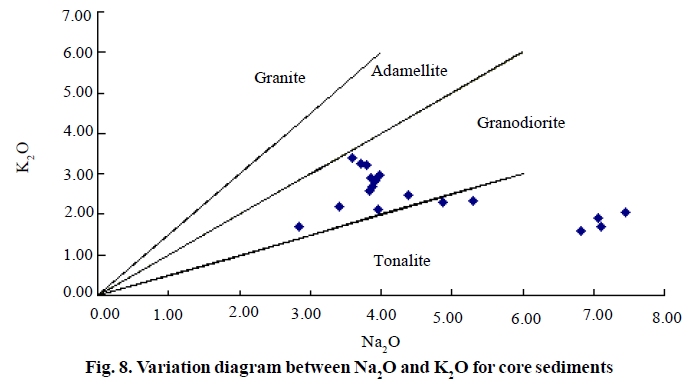
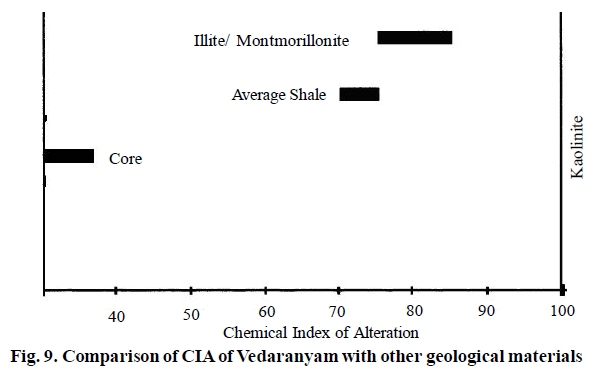
International Journal of Environmental Research, Vol. 4, No. 3, July-September, 2010, pp. 379-394 Article Geochemistry of elements in core sediments near point claimere, the Southeast Coast of India Sundararajan, M . 1* and Natesan , U. 2 1 National Institute for Interdisciplinary science and Technology, Council of Scientific and Industrial Research, Thiruvananthapuram – 695019, India Date of Submission: 25-Feb-2009 Code Number: er10042 Abstract The core sediment samples were analysed for grain size, carbonates (CaCO 3 ), organic carbon (OC) to obtain a preliminary view of its environmental conditions near Point Calimere along the southeast coast of Vedaranyam, India.The high concentration of sand in the core is attributed to the tidal influence at the Akkarapallivasal river mouth. The sea water which enters the river suspends the flocculated sediments at the mouth and transports the fine floccules to the water column. The tidal currents also play a major role in removing the fine particles from the river mouth. The value of OC does not show any significant variation towards depth. The concentration of various major elements in the core can be summarized as Si > Al > Ca > Na > K > Fe > P > Mg and the trace elements exhibit the following order for the core samples as Mn > Zn >Cu > Pb > Ni > Cr > Co. The studies indicate lithogenic origin for most of the elements. Major and trace elements of the core sediments were estimated and normalized.Keywords: Core sediments, Geochemistry, Heavy metals, Anthropogenic, Point calimere, India Introduction Sediments from the marginal marine and near shore environments had been studied by a number of geolo-gists for a considerable period of time to determine the process of deposition of ancient sediments. The na-ture of sediments is modified by anthropogenic activi-ties and as the impact of these activities has increased more in the following years, sediment geochemistry had been pursued with the objective to assess coastal pollution (Van Andel and Postma, 1954; Emery, 1960; Shepard et al., 1960; Strakhov, 1961; Van Andel and Shor, 1964; Van Andel and Veevers, 1967; Faganelli, et al., 1987; Holm, 1988; Karbassi and Amirnezhad, 2004; Karbassi and Shankar 2005; Pekey, 2006; Abdel- Ghani and Elchaghaby, 2007; Praveena, et al., 2008; Harikumar et al., 2009; Mohiuddin et al., 2010). Accumulation or mobilization of trace elements in the sediments of aquatic environment (Al-Masri, 2002).Sediments act as sinks and sources of contaminants in aquatic systems be-cause of their variable physical and chemical proper-ties (Rainey, et al., 2003; Marchand, et al., 2006; Prijiu and Narayan, 2007; Praveena, et al., 2008; Sundararajan, et al., 2009; Sundararajan, and Usha Natesan, 2010). Most of the chemical changes take place at or close to the sediment/water boundary and, for this reason, it is important to study the geochemical composition of bulk sediments (Hirst 1962; Calvert 1976). Bay of Ben-gal has attracted scientists and oceanographers from all over the world with regard to its sedimentation ge-ology, in particular, origin and history of the Bengal Fan sediments (Emmel and Curray 1983; Winkler 1987). Sediments are important carriers of trace metals in the hydrological cycle and they effectively collect or re-lease metals into the surrounding waters; thereby, they can reflect the current quality of an aquatic system (Salomons and Forstner 1984). Major elemental analy-sis effectively represents the composition of the solid fraction being eroded from the continents or the rock types present in the drainage basin of a river (Taylor and McLennan 1985). Trace metal enrichment in sediments started with the industrial evolution in Indian sub-conti-nent at the end of 19 th century. As a result, the fluxes of trace metals from terrestrial areas (espe-cially aquatic regions) have increased significantly in developing countries. Since, sediments are often the ultimate depository environment for trace metals in the aquatic environment, the solid-phase distri-bution can reflect the history of metal accumulation and the weathering pattern of the sediments from adja-cent regions (Forstner and Salomons 1980; Fedo et al., 1996; Nesbitt et al., 1996; Nath et al., 2000). Normaliza-tion is done by measuring the concentrations of met-als in bulk sediments and then dividing them by the percentage of 63 ΅m size fraction in the bulk sediments in order to obtain the concentration in the fine fraction (Krom et al., 1983; Morse et al., 1993; Palanques and Diaz, 1994). The aim of the present study is to identify the source and fate of metals and toxic elements in the study area, and its impact on the environment. Materials & Methods Akkarapallivasal river mouth (10º25'01"N lati-tude and 79º51'99"E longitudes) near Point Calimere was considered as the study area [Figure - 1]a,b.The coastal sands of recent age overlie the Tertiary rocks.The geomorphologic features observed in this stretch are sub aerial delta, strand plain, crevasses, chennies, cuspate bars, estuarine and swamps.The large part of the delta is occupied by their distributory flood basins comprising brown and reddish gray silty clay and fine sands.The coastline of Nagapattinam is straightened by south bound long shore currents from the Kollidam river mouth to Point Calimere. From Point Calimere to further south the coastline forms a bay. These soils occur in Nagapattinam taluk covering an extent of 37 km 2 . The soils are very deep, moderately drained, clay to sandy clay loam in texture with depos-its of sand in intermittent layers. The soils are some-what saline in nature due to the influence of tidal waves. Core sampling was done at one particular location dur-ing May 2003 for the present study. This location was selected as it is very close to the mouth of the river which can decipher the influence of coastal region .Col-lection of core samples was done from a boat using a PVC coring tube of 6.3 cm diameter and 2.5 m length, which was pre-cleaned with dilute acid. The sub-samples were sliced at 2.5 cm depth interval resulting in 18 numbers of samples. The water depth at the cor-ing site were 1.25 m and the sub-samples were tightly packed, transported to the laboratory and stored at -4º C until further analysis. The geochemical data presented in the present study have not been corrected for compaction, as it is likely to be uniform down the length of the core (Clark et al., 1998). During the first stage of work, sand and mud (silt + clay) were estimated following the procedure of Ingram (1970).Carbonate content (CaCO 3 ) was mea-sured following the procedure of Loring and Rantala (1992) and organic carbon (OC) was determined fol-lowing the procedure of Gaudette et al., (1974). Major elements (Si, Al, Fe, Ca, Mg, Na, K, and P) and trace elements (Mn, Cr, Cu, Ni, Co, Pb, and Zn) were deter-mined after preliminary treatment and total decompo-sition of sediments following the procedure of Loring and Rantala (1992). The final solution was analyzed using AAS (Varian Spectra AA220) which is equipped with a detritum background corrector. Further stan-dard reference material MESS-1 was used to ensure the quality control and accuracy of the analysis [Table - 1]. The geochemical elements delivered to the creek are not only from anthropogenic sources but also by natural flux of elements from the catchment areas. One of the popular methods to distinguish the fraction of metals or enrichment is by normalization with respect to Al (Kemp et al., 1976; Van Metre and Callender,1997; Loring, 1991). Moreover, Al is success-fully and widely used as a normalizer and it also com-pensates for variations in the grain size and com-position because it represents the quality of alumino silicates which is the most important carrier for adsorbed metals in the aquatic environments.The vari-ability of the normalized concentrations is expressed as enrichment factors (EFs), which is a ratio of the content of the element in the analyzed layer to the content corresponding to the pre-industrial period: EF = (Cx/CAl)s/(Cx/CAl)c where, (Cx/CAl)s ratio of concentration of element x and aluminium in the sample, (Cx/CAl)c ratio of concentration of element x and aluminium in unpolluted sediments (Continen-tal crustal values, Taylor and McLennan, 1985). An EF around 1.0 indicates that the sediment originates predominantly from lithogenous material, whereas an EF much greater than 1.0 indicates that the element is of anthropogenic origin (Szefer et al., 1996). Results & Discussion The sediment texture, down core variation and their implications on physico-chemical parameters of the core samples have been studied in detail.The grain size distribution in the core sediments is important in understanding the depositional environment history.In all the core samples, mud (silt + clay) dominates over sand, indicating relatively calm environment of depo-sition. There are local variations in grain size distribu-tion within the core at different depths. The results of grain size analysis for the core samples are presented in [Table - 2]. Grain size results indicate a variation of 46.43-98.57% for sand with an average of 76.77%. Silt ranges from 1.23-53.37% with 23% on an average. Clay con-tent in the core sample varies from 0.10-0.42%, with an average of 0.23%. The top portion of the core to a depth of 17.5 cm, the sediment is sandy type with sand varying from 80.76 to 98.57 %. At 15 to 17.5 cm depth, silt content is 19.04 %. At the middle portion from 17.5 to 30 cm depth, it is only silty sand with an exception of sandy silt at 20 to 22.5 cm depth. At a depth of 30 to 32.5 cm sand (87.5%) exists with 12.08 % silt and 0.42% clay. At the bottom portion from 32.5 to 40 cm depth, silty sand is seen with silt ranging from 27.71 to 43.59 % and at the bottommost portion at a depth of 40 to 45 cm it is sandy in nature (80-88 %). The high concentra-tion of sand in the core is attributed to the tidal influ-ence at the Akkarapallivasal river mouth. The sea water which enters the river suspends the flocculated sediments at the mouth and transports the fine floccules to the water column. The tidal currents also play a major role in removing the fine particles from the river mouth. Calcium carbonate concentration ranges from 0.40 to 3.00%. The average concentration of calcium car-bonate is 1.31%. Down core variations of CaCO 3 are plotted in [Figure - 2]b. The CaCO 3 content in the core in-creases from 0.6 % to 2.2 % at a depth of 5 to 7.5 cm and then decreases to 1.2 % at a depth of 10- 12.5 cm. It again increases to 2.6 % from 20 to 22.5cm. Beyond that it decreases suddenly from 25 to 27.5 cm and stays almost steady upto a depth of 37.5 cm. About 3% CaCO 3 content is observed at a depth of 42.5 cm. The de-creasing trend of the concentration of calcium indi-cates dissolution of carbonate due to transient drop in the pore water pH.The principal reason for this may be partial decalcification process (Oenema et al., 1988) due to transient drop in pore water pH. It may also due to biological productivity and its variation through course of time. Organic carbon (OC) concentration varies from 0.25 to 3.60%, as shown in [Figure - 2]a. Average organic carbon for the core is 1.31%. A good amount of organic matter is supplied by river runoff and considerable volume of organic debris is retained on the overlying water col-umn. An abundant supply of organic matter in water column, relatively rapid rate of accumulation of fine-grained inorganic matter, and low oxygen content of the waters immediately above the bottom sediments would favor high organic matter in the bottom sedi-ments. In the core, the OC content is high in the middle part (22.5-25 cm) there after the OC content varies in a zigzag fashion between 1.26 and 2.59% up to a depth of 35 cm and then decreases. The relatively higher concentrations of OC in top layers reveal the adsorp-tion and incorporation of organic materials from the polluted water column above. The low (minimum) con-centration at 0 to 2.5 cm depth is perhaps due to the domination of decomposition over production. The value of OC does not show any significant variation towards depth. The low values indicate domination of decomposition over production. The mean value of OC content in the core is 1.31%, which coincides with the reported values (Murthy and Veerayya 1972; Paropakari 1979; Jonathan 2001; Sundararajan 2001). The major elements in the core sediments of Vedaranyam coast are presented in [Table - 3]. Si values record a mean concentration of 27.03% ranging from 24.29 to 30.45%.It clearly indicates that the Si content is decreasing up to 25 cm and again it is increasing. Towards the bottom of the core there is not much varia-tion in Si concentration. The average sand content encountered in this core shows similar trend. The core is very near to the coast and the influence of tide is more. Estuarine removal of dissolved silica was re-ported by Liss (1976). Hence the contribution from detrital mineral grains and estuarine mixing in the re-moval of Si has been considered in the present study. The fluvial process and human induced activities are more in this area (Selvaraj et al., 2005). The average Al concentration in the core is 8.80% and ranges from 6.04 to 11.94% [Table - 3]. The con-centration varies with depth and relatively low con-centration of 6.54% is observed on the surface of the core (0- 2.5cm). A gradual increase of Al is observed from 7.5-22.5 cm (11.97%); thereafter, it decreases with depth. Na concentration in the core varies from 2.11 to 5.53%, the maximum of 5.53% being recorded at 35 to 37.5 cm depth. Upto a depth of 15 to 17.5 cm, almost a steady Na is observed between 2.61 and 2.96%. The bottom portion shows slightly higher % of Na from 3 to 5.5%.The middle and bottom portions contain lesser amount of K mostly below 2%, whereas at the surface up to a depth of 15 cm it varies from 2.29 to 2.72%. The concentration of Ca in the core records an average of 7.15% with a variation of 4.42-9.77%. Ca content varies from 4.42% at 35-37.5 cm depth to 9.77% at 10-12.5 cm depth with an average of 7.15%. The top portion shows high % of Ca compared to middle and bottom segments.Mg % is very less about 0.1%. Core samples record an average of 1.34% of Fe in the core. It varies from 1.00-1.60%. In the core sediments of the study area, phosphorous show moderate variations in concentration. The analytical results for the core are enumerated in [Table - 3]. P concentration varies from 0.26-0.79% with an average of 0.60%. Element/Al ratios of the core sediment samples are presented in the depth profile of element/Al ratios for each element [Figure - 3] & [Figure - 4] Estimated average values of Si/Al are higher 3.21, ranging from 2.08-4.66 for the samples in the core [Figure - 3]a. Low ratios in certain samples of the core sediments indicate presence of higher amount of Al; similar low ratios were also re-ported in the Sulu Sea and in the shallow sediments of South China Sea, and were attributed to variations in texture of the sediments and opal silica (Calvert et al., 1993). The lower Si/Al ratio and higher sand content in many samples indicate poor concentration of quartz and other silica rich minerals. In the core Si/Al ratios are very much lower than the CCV. The Na/Al average in the core samples shows a higher of value of 0.41 than the CCV of (0.39), and the ratios of Na record a variation of 0.20-0.81[Figure - 3]b. To-wards bottom of the core from 32.5 cm to 45 cm depth, the Na/Al ratios are higher than the CCV. Estimated K/ Al ratios in the core samples indicate low values of 0.24 [Figure - 3]c. At the surface of the core, up to a depth of 20 cm and from 37.5 to 42.5 cm depth, the Cu/Al ratios are higher than CCV. The ratios for Ca/Al vary from 0.46-1.58 with 0.85 as average which is higher than the conti-nental constant values [Figure - 4]a. Mg/Al ratios indicate an average of 0.01 in the core. [Figure - 4]b. Fe/Al ratios in core sample reveal moderate values, which fall within the continental crustal values [Figure - 4]c. The P/Al ratios vary from 0.03-0.12 with an overall average of 0.07. For the core retrieved, P/Al ratios and their variations in the sub samples are presented in [Figure - 4]d. The lower ratios of P/Al in the core samples reveal low concentrations of P in the analyzed sedi-ments, which are controlled by the detrital phase and are mostly attributed to the absence of low organic carbon and oxygen minimum condition. In the core P/ Al ratios are higher than the CCV at all depths. The explanations put forward by Rao and Murthy (1990) in their studies on the west coast of India and Purnachandra Rao et al. (1998) on the east coast are applicable in the present study. The concentration of various major elements in the core can be summarized as Si > Al > Ca > Na > K > Fe > P > Mg. Core sediments in the study area record an aver-age of 436.13 mg/kg of nondetrital Mn in the core. It varies from 243.21 to 730.40 mg/kg [Table - 4]. The low-est is recorded at the surface of the core. The Mn pro-files described above can be represented qualitatively as a two-layer system, where the boundary between the upper and lower units corresponds to the observed minimum in the profile, a depth where maximal Mn remobilization occurs (Li et al., 1969; Calvert and Price 1972, Elderfield 1979). The upward increase in Mn con-centration above the boundary is related to the verti-cal migration of Mn by diffusion and advection, re-sulting from the concentration gradient and burial com-paction of solid Mn phases, such as oxides, carbon-ates, and sulphides (Calvert and Price 1972; Elderfield 1979). In areas of high sedimentation rate, the core sediment is less. As sedimentation proceeds, the sur-face sediment containing both Fe and Mn oxide phases is buried and microbial oxidation of sedimentary or-ganic matter results in the reduction and dissolution of the oxide phases at depth. With compaction, the dissolved Mn migrates toward the sediment water in-terface (Heaton and Dayal 1985). The concentration of Cr varies from 3.75 to 19.20 mg/kg with a mean concentration of 14.16 mg/kg in the core. In the core at the surface up to 5.5 cm depth and from 32.5 to 37.5 cm depth, the Cr concentration is less than 10 mg/kg. From 7.5 - - 32.5 cm depth, the concen-tration lies between 13.5 and 18.15 mg/kg. Towards the bottommost portion, the concentration increases again from 11.25 to 19.2 mg/kg. Estimated concentration of Cu record an average of 46.68 mg/kg and it varies from 30.10 to 75.80 mg/kg. Analytical results of Ni in the core from the study area vary from 7.20 to 68.30mg/kg, with an average of 38.55 mg/kg. Ni concentration is between 7.2 and 68.3 mg/kg, the highest is at the sur-face and the lowest is at a depth of 20-22.5 cm. The bottom portion shows higher concentration of Ni com-pared to middle and top portions. Even though the values of Ni show lithogenic origin and low concen-tration in the present study, they are still rich enough to suggest anthropogenic contribution. This is con-firmed by comparison of the present data with the Adyar estuary (Achyuthan et al., 2002), where Ni con-centration of 18 to 38 mg/kg had been reported. They had also suggested that Adyar estuary had been highly contaminated with respect to Ni due to anthropogenic activity. The values observed in the creek are more than those of Adyar estuary, indicating that near shore sediments of Vedaranyam is also contaminated by Ni. Estimated Co concentration ranges from 7.50 to 19.80 mg/kg, and an average of 13.66 mg/kg, for the core. The Co concentration in the core varies from 7.5 mg/kg at a depth of 20-22.5 cm to 19.8 mg/kg at 30-32.5 cm depth.The middle portion of the core from 15-17.5 cm depth, and from 27.5-30 cm depth with the exception of 7.5 mg/kg at 20-22.5 cm depth, the concentration is more compared to the top and bottom portions. Ana-lytical results of nondetrital Pb in the study area ranges from 33.13 to 53.79 mg/kg, with an average of 43.86 mg/ kg in the core [Table - 5]. In the core, the concentration of Pb varies from 33.13 to 53.79 mg/kg. The lowest is recorded at 25-27.5 cm depth in the middle portion of the core and the highest (53.79 mg/kg) is also recorded in the middle of the core at 15-17.5 cm depth. The zinc concentration varies from 41.10-86.60 mg/kg. The low and high values are recorded at 35-37.5 cm and 10-12.5cm depths respectively. The average concentra-tion of Zn is 70.66 mg/kg. The trace element content discussed above exhibit the following order for the core samples: Mn > Zn >Cu > Pb > Ni > Cr > Co. Normalization of trace elements with Al values was done for all samples taken from the core. The metal/Al ratios and enrichment factors for the analyzed trace metals are shown [Figure - 5] & [Figure - 6] with respect to CCV. Mn/Al ratios in the study area range from 30.67 to 97.32x10 -4 , with an average of 51.31x10 -4 . The down core profiles with variations for Mn/Al ratios are shown [Figure - 6]a. Enrichment factors for the core samples ranges from 0.32 to 1.01. The normalization values are very much above the CCV in the core.The EF values for Cr based on average shale do not show very high concentrations.Cr/Al ratios vary from 0.44 to 2.95x10 -4 with an average of 1.63x10 -4 , for the core. The Cu/Al ratios in the study area record an average of 5.66x10 -4 .Enrichment factor ranges from 0.51 to 2.27. Down core profile of Cu/Al are shown in [Figure - 5]c. The down core variations in Cu/Al ratios are almost the same. The values at the surface upto a depth of 15 cm are slightly higher than the CCV. Ni/Al ratios vary from 0.68 to 10.45x10 -4 , with an overall average of 4.84x10 -4 , for the core samples. Computed Ni/Al ratios as seen in the down core profile [Figure - 6]a. Enrichment factors vary from 0.09 to 1.36.The average for the core is 0.63. Esti-mated Co/Al values for the core samples ranges from 0.70 to 2.16x10 -4 , with an overall average of 1.58x10 -4 , [Figure - 6]b. Enrichment factors for Co are well below 1indicating low concentrations. The Enrichment fac-tors value ranges from 0.37 to 1.14; Co/Al ratios do not vary much down the core. Estimate of Pb/Al ratios for the core samples vary from 3.07 to 7.34x10 -4 , with an overall average of 5.18x10 -4 . The down core profile variations of Pb/Al ratios are represented in [Figure - 6]c. The Pb/Al ratios of the core are high, with minor varia-tion between samples which shows the periodical change in the input of this metal and its anthropo-genic nature. Enrichment factors record an average of 2.59, for the core samples. It varies from 1.53 to 3.67. Pb/Al ratios vary in a zigzag manner with increase and decrease down the core. The overall observation of Pb/Al ratios in the study area indicate that external atmospheric inputs has played a major part in the increase of Pb over the crustal average and it is also well supported by the very high EF values. The variations in EF values, which range from 1.0 to 4.9, also confirm this inference. Zn/Al ratio in the core samples ranges from 4.79 to 12.04x10 -4 , with average of 8.36x10¹⁰ -4 .The down core variation of Zn/Al ratio with reference to the crustal values is shown in [Figure - 6]d. Enrichment factor also shows an average of 0.77, with a variation of 0.44 to 1.11. The Al normalization values are very much higher (2-7 times) than the CCV. The mean EF values are above 1, which indicates that influence of anthropogenic in-put is very less. The element/Al ratios and the enrich-ment factors for majority of the analyzed sediments are more or less higher than the crustal average. Uni-versally, the Enrichment factors above 1 for many of the metal reveal enrichment and this is taken into con-sideration for the study area. By applying the above rule to the study area, the analyzed elements specify that except Mn, all the elements are above the crustal value demonstrating external input. Similar inferences had also been observed for many coastal regions like Neches estuary, Texas (Ravichandran et al., 1995), Gulf of Mannar (Jonathan et al., 2004), Kalpakkam, south east coast of India (Selvaraj et al., 2004) and Cuddalore, south east coast of India (Ayyamperumal et al., 2006). The higher enrichment factor of all the metals in the study area exhibits sediment contamination due to the anthropogenic activities around the mangrove region. This is also supported by Warren, 1981; Szefer and Skwarzec 1988; Mac Donald et al. 1991; Van Geen and Luoma 1999.It is interesting to note that the enhance-ment order of enrichment factor values over the crust in the study area decreases in the following order for toxic trace elements Pb > Cu > Co > Zn > Ni > Mn > Cr . The analyzed results correlate well with earlier stud-ies indicating that higher enrichment factor values show an external contamination in the study area. These elements dominating the study area suggest that various anthropogenic activities had taken place and the results also support the inference [Table - 6]. The major oxide data for surface sediments and core sediments are plotted in Al 2 O 3 -CaOFNx01 1 Na 2 O-K 2 O (A-CN-K) compositional space (molecular pro-portions) in all the sediments plot [Figure - 7] and [Figure - 8] on a trend parallel to the Al 2 O 3 -CaOFNx01+Na 2 O join, suggest-ing that the sediments represent the products from granite and charnockite sources (Fedo et al., 1995). The present study is compared to the CIA of granite, typical illite, montmorillonite, average shale and ka-olinite (Nesbitt and Young 1982). Note that CIA for kaolinite is 100.CIA values for the sediments of the core, shows a relatively very low degree of alteration in sediments [Figure - 9]. In this core sample CIA values show wide range from un-weathered to high degree of weathering. Conclusion The core samples are dominated by sand and have higher concentration of organic carbon and depleted CaCO 3 concentration. The samples with high Si/Al ra-tio are generally coarser grained and this is manifested by a higher ratio of quartz + feldspar relative to clays. The higher concentrations of Al and Fe in the sedi-ments are also due to the detrital mineral grains sup-plied through adjacent rivers. The behavior of Na and K indicates the dominance of K-feldspar over plagio-clase feldspar. The variation of high Mg/Al ratio in the sand fraction and top layers of the core samples indi-cates the presence of skeletal fragments, ooids and coral debris. In addition, the higher ratios of Mg/Al in the present study could be due to the precipitation of Mg with an increase in pH and the eddy currents in the coastal zone. The concentration of various elements in the core can be summarized as Si > Al > Ca > Na > K > Fe > P > Mg. The highly inconsistent Mn concentration in sur-face sediments of the present study upholds the idea that oxyhydroxide flocs of Mn are transported later-ally during saline bottom water inflow and deposited in quiescent parts of the estuary. When compared to the contamination in other parts of the world, the con-centration of trace metals in near shore sediments and core is not alarming. High rate of sedimentation and non-decomposition of OM are characterized by the core C1. The distribution pattern of various trace ele-ments in the core is shown as Pb > Cu > Co > Zn > Ni > Mn > Cr .Studies on provenance indicate the source for the sediments in the study area are charnockites and tonalitic gneises. Core samples show a relatively very low degree of alteration in sediments.[74] References
Copyright 2010 - International Journal of Environmental Research The following images related to this document are available:Photo images[er10042t5.jpg] [er10042f3.jpg] [er10042t3.jpg] [er10042f5.jpg] [er10042f9.jpg] [er10042f8.jpg] [er10042t6.jpg] [er10042t2.jpg] [er10042f2.jpg] [er10042f1.jpg] [er10042f6.jpg] [er10042t4.jpg] [er10042t1.jpg] [er10042f7.jpg] [er10042f4.jpg] |
| |||||||||
