 |
| About Bioline | All Journals | Testimonials | Membership | News |
|
||||||
|
||||||
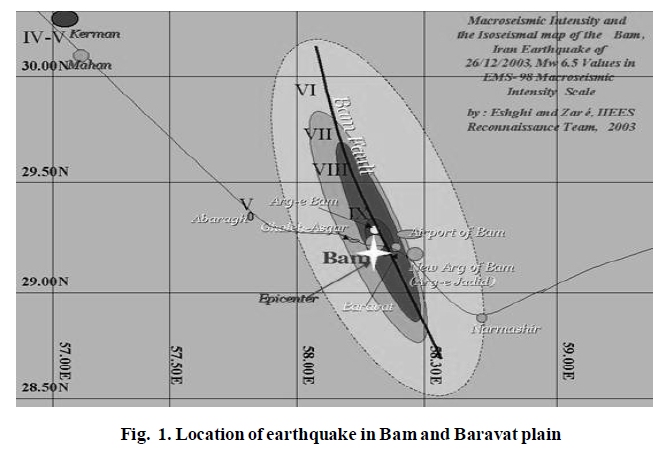
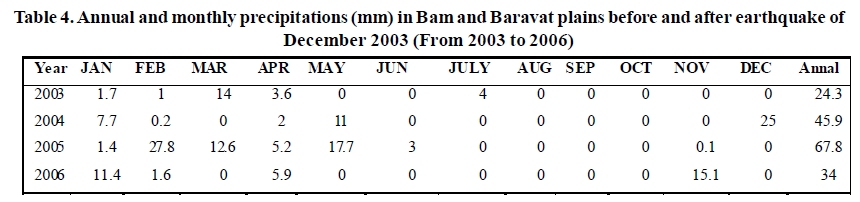
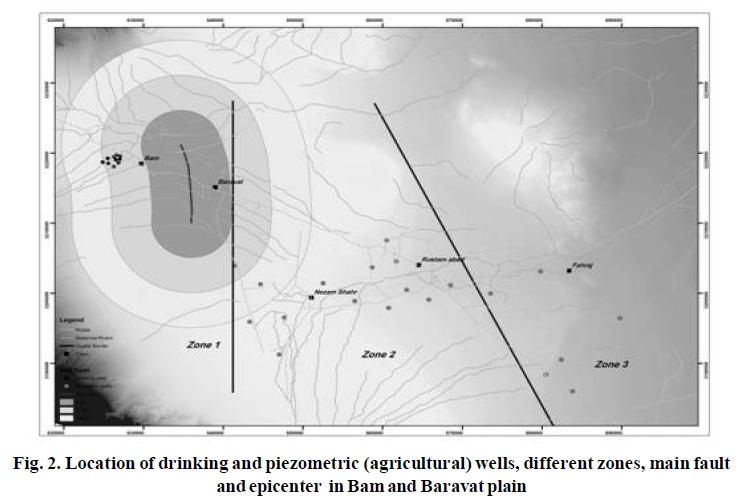
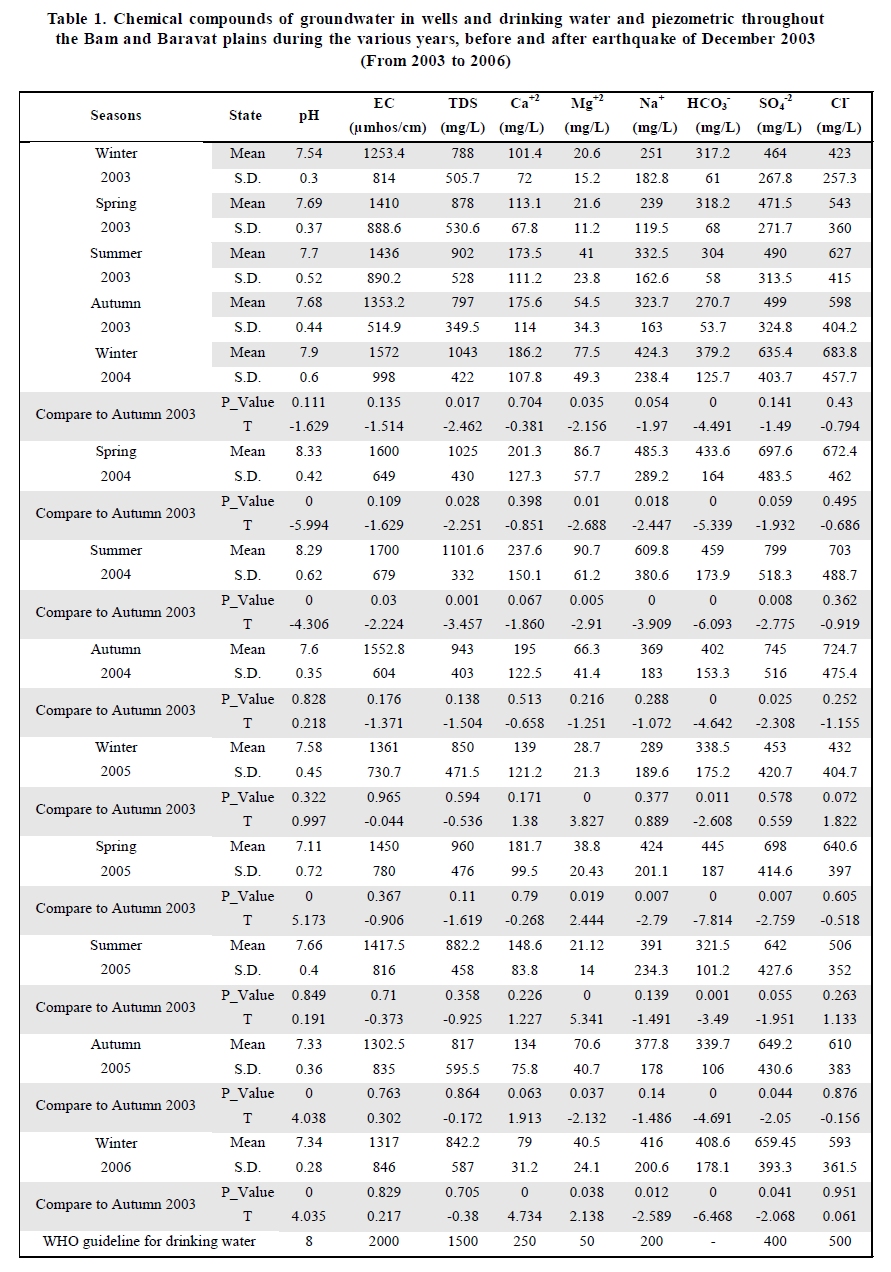
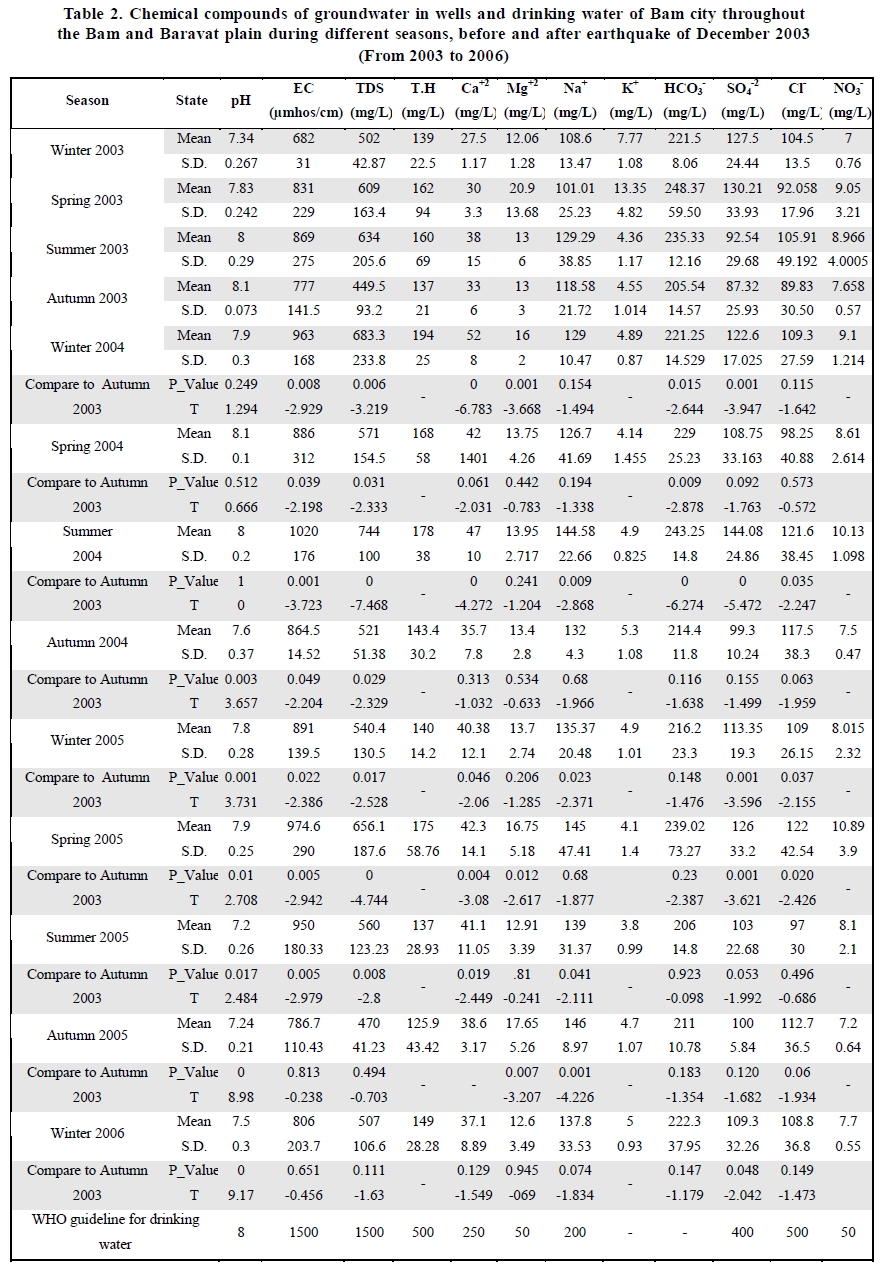
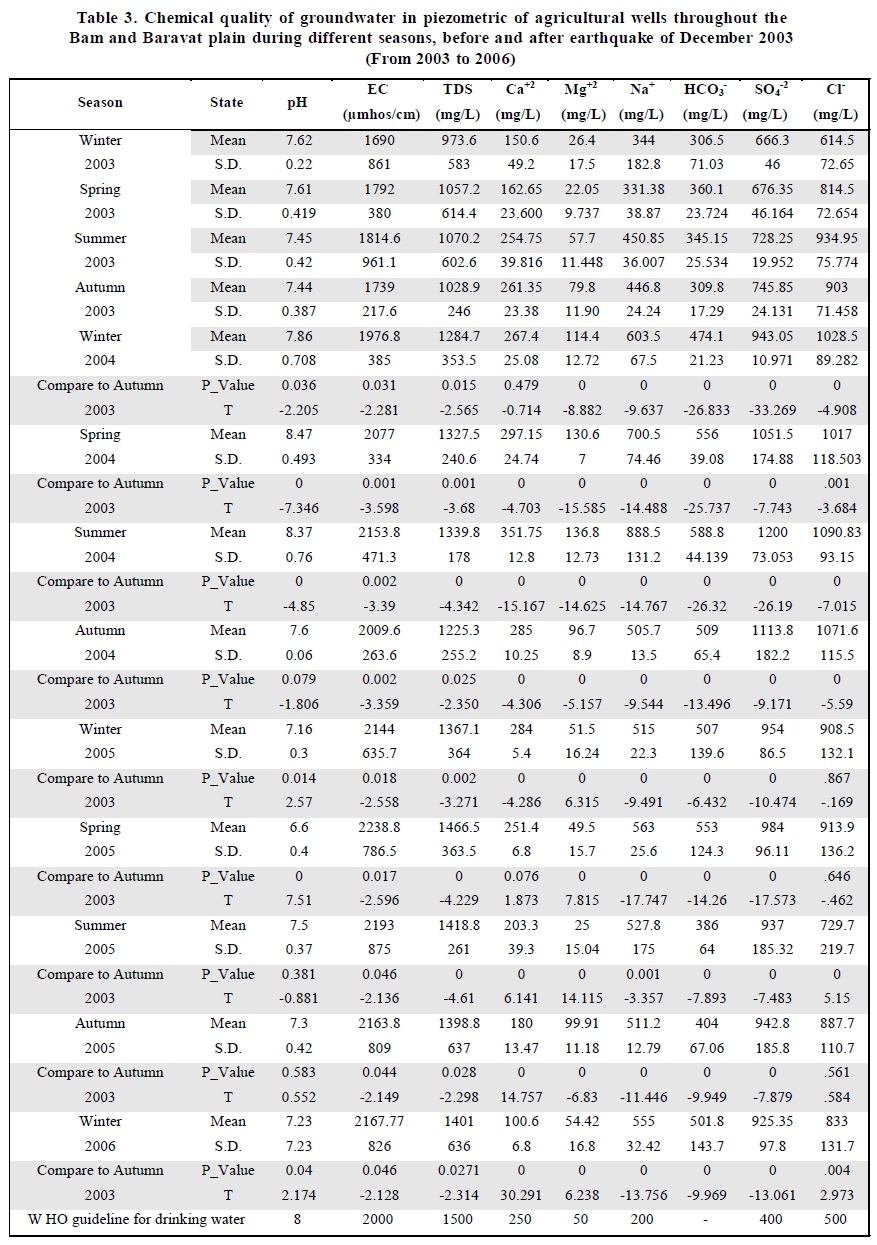
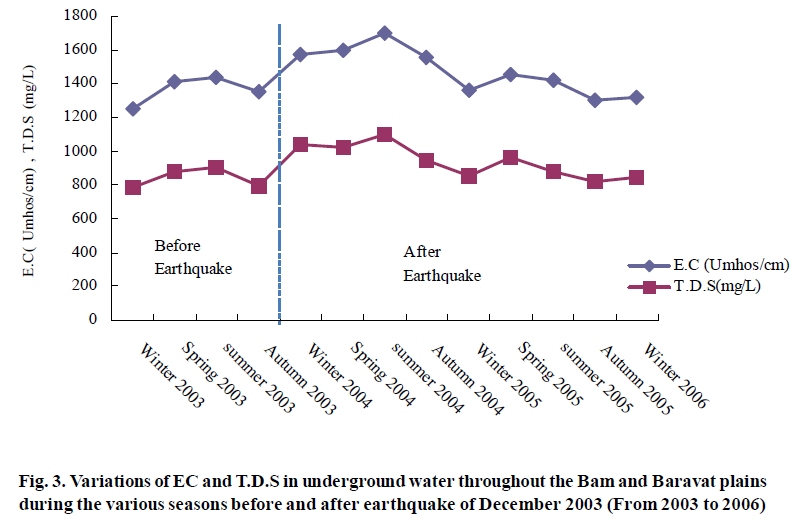
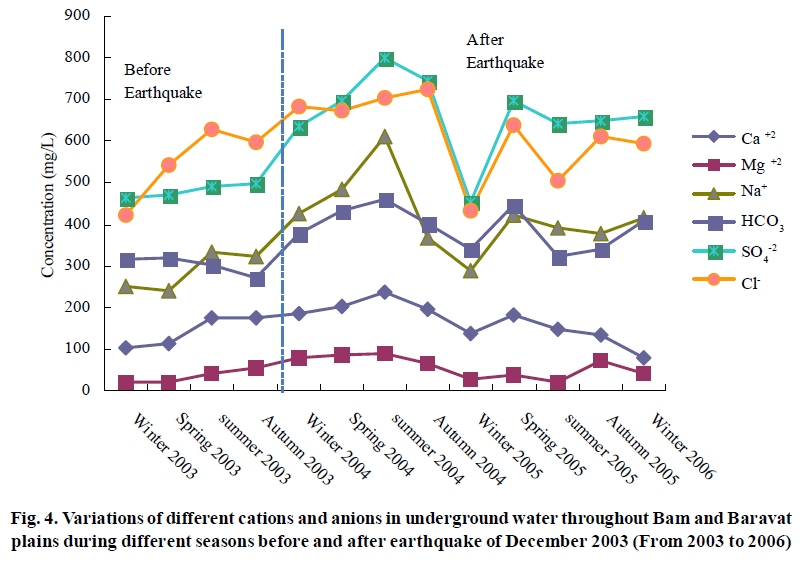
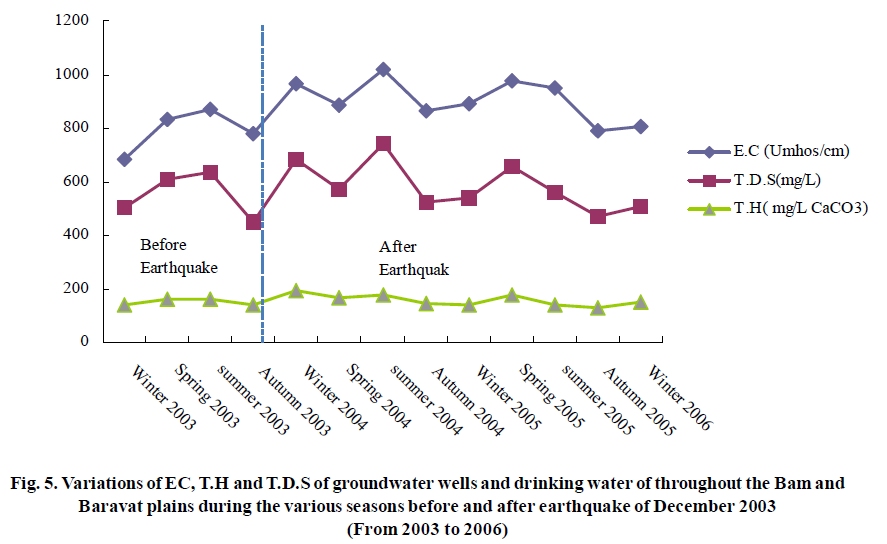
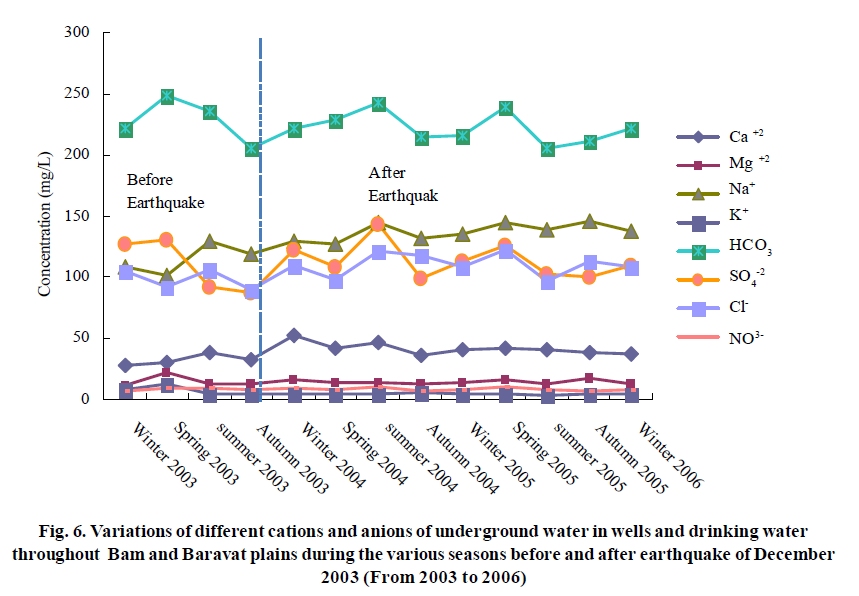
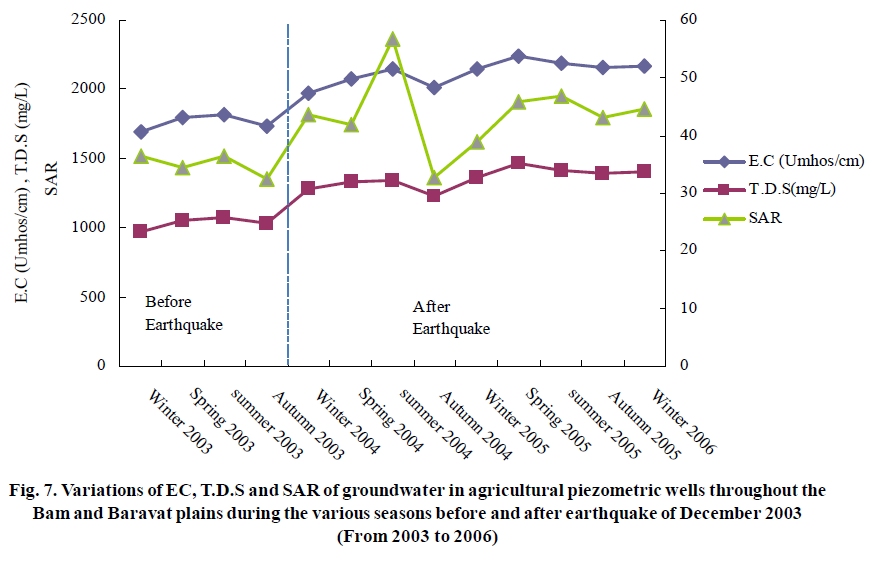
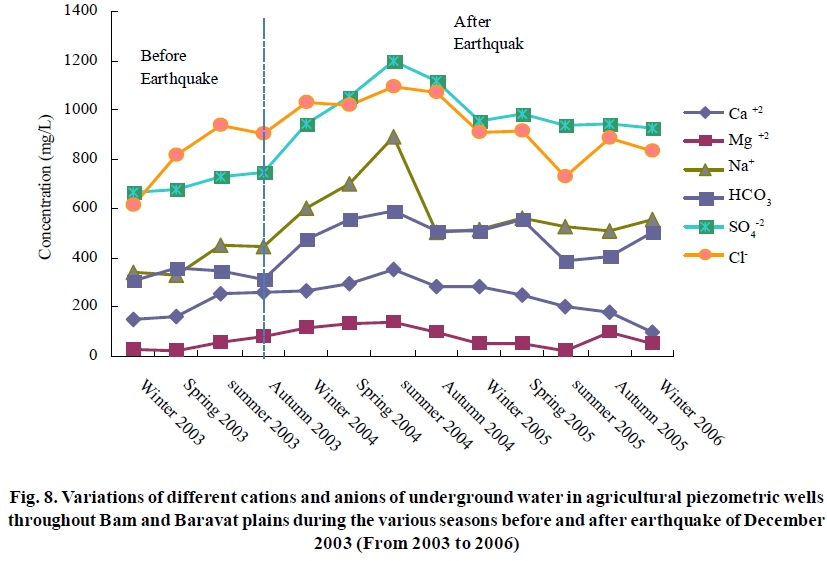
International Journal of Environmental Research, Vol. 4, No. 3, July-September, 2010, pp. 443-454 Article Chemical variations of ground water affected by the earthquake in Bam region Malakootian, M. 1* and Nouri, J. 2 1 Department of Environmental Health, School of Public Health, Kerman University of Medical Sciences, Kerman, Iran Date of Submission: 12-Sep-2009 Code Number: er10049 Abstract An earthquake with magnitude Ms = 6.5 on the Richter scale occurred in December 26 th , 2003 in Bam Region in southeastern part of Iran. This study investigates the chemical variations of the groundwater resources in the effected region. For this purpose, 30 wells were selected and chemical compounds, in terms of cations (Ca+2, Mg+2, Na+, K+); anions (HCO 3 , SO 4 , Cl, NO 2 ), as well as EC, TDS and pH were analysed from Winter 2004 to Spring 2006. Results were compared with the ones obtained from winter 2003 to winter 2004. Then, using T-test, results of before and after the earthquake was investigated. The experiments were carried out according to the Standard Method of water and wastewater which showed during the after earthquake most chemical parameters considerably increased rather than before the earthquake date. These changes reached their peak in the first year and Summer 2004 after the earthquake. The rate of variations was estimated about 17.5 - 88.3 % throughout the Bam and Baravat plains and 7-65.5% in wells water. It can also be considered that the fluctuation of underground waters chemical characteristics after the earthquake could be mainly due to different factors as follows: A) change in water levels as a result of earthquake, B) change in water temperature that will cause more solubility, C) change in water pressure trapped in rocks and aquifers and D) mixing with water of neighboring aquifers. The rate of fluctuations of different parameters in selected wells also showed a negative trend after the earthquake.Keywords: Bam and Baravat plains, Bam earthquake, Groundwater variations, Well Introduction Earthquake can severely affect groundwater (Stephens 2006). Ground layers movement influence quality and quantity of groundwater aquifers (Nitcheva et al. 2000; Wang et al. 2004; Babel and Opiso, 2007). On the other hand, earthquake may cause very small cracks in rocks which lead to separation of electrons from atoms and movement of groundwater aquifers. Changes in ground topography after earthquake can cause ground layers to move to a similar level with polluted aquifers which may change chemical compo-sition of groundwater's (Nitcheva et al. 2000; Maxwell et al. 2001; Kirimizitas et al. 2003; Nwuche and Ugoji, 2008; Igbinosa and Okoh, 2009; Ziari and Gharakhlou , 2009). Immediately, before and after earthquake, there are some hydrological indicators such as color, tem-perature and odor change, as well as changes in chemi-cal composition and level of surface and groundwater's (Esposito et al. 2001; Chjeng et al. 2003; Sato et al. 2004; Hsu et al , 2005; Zhu-Zhuan et al. 2007; Mahvi, 2008; Vafaeinezhad et al., 2010). For example, radon produced due to radioactive decay of trace amount of uranium present in rocks increases in groundwater resources (springs and wells) before earthquake (Singh et al. 1999; Rafee et al., 2007; Malakootian et al., 2009; Shah et al., 2009; Gharakhlou et al., 2010). Thus, when cracks are made in rocks and water pen-etrates into them, radon transportation increases in flowing water which can be a pre-indicator of earth-quake (Kuo et al. 2006). Also, changes in amount and level of groundwater, as well as hydrological changes in ground level and appearance or disappearance of springs have been reported over 2000 years earlier (Kitagawa et al.1996; Chia et al. 2001; Manga 2001; Matsumoto et al. 2003; Panjeshahi and Ataei, 2008) An earthquake of magnitude Ms = 6.5 on the Richter scale and a focal point of about 8 km occurred on 26 th December 2003 at 1:56'GMT and 5:26' local time in Bam City, along Bam Fault located in southeastern of Iran [Figure - 1]. Any major earthquake, at least in past 2500 years was not recorded (Ashtiany 2004; Nadim et al. 2004). Many aftershocks were recorded after this earthquake from 26th December 2003 to the 22 th Novem-ber 2004. Besides, earthquake and geotechnical phe-nomena such as land slides and earth recession were observed (Eeri 2004; Elmay et al. 2009; Nouri et al., 2010). This study was carried out to investigate the effect of earthquake on chemical quality of groundwa-ter resources in Bam and Baravat plains. Materials and Methods Bam earthquake occurred in the margin of Lut desert in the south- eastern of Iran [Figure - 1] (Nadim et al. 2004; Kerman Regional Water Company 2003). Aver-age altitude of the study area from sea level is 960 m and total area is 9927 km 2 with a 4357 km 2 plain. (Kerman Regional Water Company 2003). This area has hot and arid climate. The plain is comprised of alluvial depos-its related to the fourth geological era and the main groundwater resources(Eeri, 2004; KRWC, 2002). The topographical feature of the city is the volcanic hills located at the north and south west of Bam. Total amount of annual rainfall is not considerable (60 mm/ y) especially during the years of 2003 to 2006 [Table - 4] (Lashkaripour et al. 2007). Underground water was extracted mainly using deep wells and Qanats. Before Bam earthquake, there were about 126 active Qanats at the area that supply 50 % of the city water demand (Amini, et al. 2004; KRWC, 2002). The rest of the re-quired water was supplied by deep wells (150-200 m depth) (Amini, et al. 2004). Firstly, regarding the re-gion condition, 20 piezometric wells, drilled by Kerman regional water company to study the water table con-dition and chemical quality, were selected. These wells were located in center (Zone 2) and east (Zone 3) of plain [Figure - 2]. Most of the underground waters in this area are used for agriculture purposes. Also, 10 wells used for drinking water supply of Bam city were cho-sen. These wells were located in west part of plain (Zone 1) and near main fault and an epicenter location of 29.00 N, 58.34 E [Figure - 2] (Nadim et al. 2004). Field investigations, geographical, geological and topogra-phy maps showed that well sites are proper to reveal the groundwater conditions of plain. In order to study the changes of drinking and piezometric water wells located in the plain after the earthquake, one sample was taken 5 th day of each month from winter 2004 to spring 2006 and following parameters were determined: K + , Na +, Mg +2, Ca +2 , SO 4 -2 NO3 - ,HOC3 - , TH (total hardness) and total dissolved solids (TDS). The data has been extracted from winter 2003 to winter 2004 that samples also has taken 5 th day of each month from the previous study (Malakootian et al., 2004). Then, maxi-mum, minimum and mean of these parameters were cal-culated for any of the drinking and piezometric water wells to compare the average amounts in the different seasons after the earthquake until 2006. Meanwhile, the average chemical quality of water wells was stud-ied in different seasons till spring 2006 after the earth-quake and compared with autumn 2003 (before the earthquake). Then, the maximum, minimum and aver-age rate of each parameter in the drinking water wells was compared to Iranian standard for drinking water which is based on WHO guidelines ( ISIRI, 1997; Malakootian et al. 2007). The same comparison was made for agricultural wells. All the experiments were performed according to Standard Methods for exami-nation of water and wastewater (APHA, 1998). Using SPSS Software and T-test, a comparison was made between concentration of different water chemical qual-ity in autumn 2003, before the earthquake and differ-ent seasons till spring 2006 (after the earthquake). Results and Discussion Results of maximum, minimum means and stan-dard deviation of chemical quality of groundwater in all wells throughout the Bam and Baravat plain, drink-ing and piezometric wells before and after earthquake from 2003 to 2006 are shown in [Table - 1],[Table - 2] and [Table - 3]. The trends of mean concentration of measured parameters in different season of all years before and after earth-quake are shown in [Figure - 3],[Figure - 4],[Figure - 5],[Figure - 6],[Figure - 7] and [Figure - 8]. Concen-tration changes in different parameters show that chemical quality follows a negative and unsuitable trend both for drinking and agriculture purposes from west to east [Figure - 2]. EC and T.D.S mean change curve [Figure - 3] and average concentration of different cations and anions in underground water throughout Bam and Baravat plain [Figure - 4] point to meaningful and consid-erable fluctuations in underground water chemical quality after the earthquake [Table - 1]. All the mentioned changes can be considered as the consequences of earthquake in December 2003. Moreover, aftershocks of the earthquake which caused an increase in the water level and fluctuations (Hsu et al., 2005; Lashkaripour et al., 2007; Maxwell et al., 2001; Zhu-Zhuan et al., 2007) resulted in more minerals solved in water. Comparing mean season parameters of different chemicals in underground water in Bam and Baravat plain in autumn 2003 (before the earthquake) with the scales recorded in winter, spring, summer and autumn of 2004 represented a considerable increase in many parameters. This increase comes to peak rank during the first year and summer of 2004 after earthquake. In other words, the range of increase was 17.5 % to 88.3 % in different parameters throughout the plain. Water quality showed various fluctuations that can be considered mainly due to continuous occurrence of aftershocks (93 aftershocks from 26th December 2003 until 22 th November 2004); (Woith et al., 1999). Statistical study and analyzing the data represent a meaningful change in different parameters such as concentration of cations and anions and EC and T.D.S measured in autumn 2003 (before the earthquake) with the ones recorded after earthquake in different seasons until spring 2006. Since then, as the number of aftershocks decreased, the rate of such changes and fluctuations in water chemical quality followed a natural routine. But, water source showed a useless and negative trend because of drought and lack of water feeding sources mismanagement in planting and harvesting and soil abuse. To find out the earthquake effects on underground water chemical quality in Bam and Baravat plain, used for drinking, especially those which mainly located near the main fault and epicenter and in west part (Zone 1), some parameters such as mean change curve of EC, TH and T.D.S have been considered in different seasons [Figure - 5]. In addition, other mean parameters of chemical quality of these ten water wells [Figure - 6] located in a distance of 10 km from main fault and epicenter [Figure - 2] was studied during different seasons. The findings point to an identical change in chemical quality of water in wells throughout the plain. On this basis, all parameters reached their highest rank ranged between 7-65.5% in the first year after the earthquake. The maximum scale of chemical quality of mentioned water wells and their average concentration were compared in different seasons after the earthquake till spring 2006 according to Iranian Standard and WHO guideline. Results showed that none of the recorded chemical parameters did exceed the scale approved for drinking water. However there were meaningful increases and concentration changes in different parameters between autumn 2003, before the earthquake, and autumn 2005 (Institute of Standard and Industrial Research of Iran 1997; WHO 2003). It is worth to mention that Iran is located on earthquake belt and the chemical quality of underground waters is severely affected. Analysis of underground waters saved as potable water is highly crucial to find out the chemical changes and purifying the water, if necessary. Although the wells in west part are much closer to main fault and epicenter, but it receives the least chemical quality changes compared to central and east part because of soil specific context (Amini et al. 2004). The chemical quality variations were analyzed for piezometric wells to find out their quality for agriculture purposes. The selected wells were mostly located around Rostam Abad City, north east of plain stretches toward Shureh Gaz River and far from earthquake epicenter (Zones 2 and 3). The mean change curve of T.D.S, EC and SAR [Figure - 7] and different parameters [Figure - 8] in different seasons after earthquake showed a negative and useless trend in the water of these wells during the study period. The water of these wells was not of good quality due to sodium absorption rate (SAR), electricity conductivity and T.D.S [Figure - 7] and it was not suitable for agriculture purpose according to Wilcox category scale. These negative chemical changes in parameters can infer bad quality of crust layers in central and east part of the plain that caused a fluctuation in water level and more minerals solve in water. The negative character of plain can worsen this condition. Generally, the chemical changes in underground water parameters are considered as the consequences of different factors after an earthquake as follows: A) Water level fluctuations affected by an earthquake that will lead to more contacts with rocks of higher layers, B) Water temperature fluctuations and as a result more solubility, C) Change in pressure on water reservoirs surrounded with water ponds and D) Mixing with the water of neighboring aquifers as the consequences of an earthquake. Although the precipitation rate is considered as an effective factor on underground water quality, the evaluation of the precipitation rate variations in preearthquake season (Fall 2003), as well as season with the most negative water quality variations (summer of 2004) indicated zero precipitation rate in both seasons. Thus precipitation has not had any effect on the water quality variations [Table - 4]. In the second year of the earthquake, however, when quality of water started to improve, the precipitation rate also increased significantly (67.8mm), so its positive effect on the water quality improvement can not be ignored. In an investigation about geo-chemical changes happened in Tjornes earthquake in Northern Ireland in December 2002, it was found that there was a %14 to %19 increase in different parameters such as Ba, Ca, K, Li, Mo, Na, Rb, S, Si, Sr, Cl - and SO4 2- during second to 9th weeks after the earthquake (Claesson et al. 2004). Chloride (Cl - ) and sulfate (SO4 2- ) ion concentrations underground issued from two wells near the epicenter of the Kobe earthquake in Japan (17th January 1993) increased substantially after earthquake (Tsunogai et al. 1995). These results are identical and consistent with ones found in Bam and Baravat plain after the earthquake. Sheng-Rong Song et al. (2003) showed groundwater chemical anomaly before and after Chi-Chi earthquake occurred on 21 th September 1999 in central of Taiwan. The data shows that the concentration of sulfate and nitrate have increased steadily after March to July 1999 before earthquake and they decreased to about 10% - 20%, respectively till after the earthquake due to underground water dilution while getting mixed with surface and underground water sources (Shenrong et al,. 2003; Nakane and Haidary, 2010). Conclusion The main reason of this inconsistency in param-eters with the ones found in Bam and Baravat plain can be considered as shortage in annual precipitation, lack of surface waters in the region, inadequate variety in aquifers and a continuous drought before and even af-ter the earthquake. These factors can be probably named as the main reasons of underground water dilution. In a physiochemical investigation of underground waters in an earthquake happened in southwest of Turkey in 1995, a considerable electrical conductivity was ob-served, particularly in water close to earthquake cen-ter. The study of chemical changes occurred after earth-quakes in 1976 and 1980 in the US, close to Hayward Fault, showed some changes in electrical conductivity of underground waters (King et al. 1994). Remarkable consistency has been observed between the results of this study and the Bam and Baravat plain earth-quake, regarding the changes happened in different parameters. Acknowledgements The authors would like to express their apprecia-tion to the postgraduate students of Kerman Univer-sity of Medical Sciences, School of Public Health as well as the Department of Environmental Health dur-ing 2003 to 2006. The authors also thank Mr. Nekonam, Mr. Ahmadian and Ms. Mohammadi Nezhad Environ-mental health chief officers for their great technical supports and Ms. Nakhaee, the statistical professor of Kerman University of Medical Sciences who played an important role in taking advantage of SPSS and other mathematical software's throughout the data analysis and Mr. Ekhlasspour for his great support in locating the wells locations applying the GIS system.[48] References
Copyright 2010 - International Journal of Environmental Research The following images related to this document are available:Photo images[er10049f8.jpg] [er10049f5.jpg] [er10049f1.jpg] [er10049t1.jpg] [er10049t3.jpg] [er10049f2.jpg] [er10049f3.jpg] [er10049f7.jpg] [er10049f4.jpg] [er10049t2.jpg] [er10049t4.jpg] [er10049f6.jpg] |
| |||||||||
