 |
| About Bioline | All Journals | Testimonials | Membership | News |
|
||||||
|
||||||
International Journal of Environmental Research, Vol. 4, No. 3, July-September, 2010, pp. 463-470 Article Prediction of ionic Cr (VI) extraction efficiency in flat sheet supported liquid membrane using artificial neural networks (ANNs) Eyupoglu, V . 1* , Eren, B. 2 and Dogan, E . 3 1 Sakarya University, Department of Chemistry, Esentepe Campus, 54187 Sakarya, Turkey Date of Submission: 04-Nov-2009 Code Number: er10051 Abstract Artificial neural networks (ANNs) are computer techniques that attempt to simulate the functionality and decision-making processes of the human brain. In the past few decades, artificial neural networks (ANNs) have been extensively used in a wide range of engineering applications. There are only a few applications in liquid membrane process. The objective of this research was to develop artificial neural networks (ANNs) model to estimate Cr (VI) extraction efficiency in feed phase.Data set (413 experiment records) were obtained from a laboratory scale experimental study. Various combinations of experimental data, namely % (w/w) extractant Alamine 336 concentration in membrane phase, stirring speed in feed and stripping phase, flat sheet support type, stripping phase NaOH concentration, feed phase pH, diluents type, % (w/w) diluents concentration, polymer support type, extractant type, and time are used as inputs into the ANN so as to evaluate the degree of effect of each of these variables on Cr (VI) extraction efficiency in feed phase. The results of the ANN model is compared with multiple linear regression model (MLR). Mean square error (MSE), average absolute relative error (AARE) and coefficient of determination (R 2 ) statistics are used as comparison criteria for the evaluation of the model performances. Based on the comparisons, it was found that the ANN model could be employed successfully in estimating the Cr (VI) extraction efficiency.Keywords: Artificial neural networks, multiple linear regression models, supported liquid membrane, chromium (VI) extraction, solvent extraction Introduction The extensive use of chromium in leather tanning, metallurgy, electroplating spraying anticorrosion coat-ings, dying in textile, welding and cutting stainless steel, and other industries has resulted in the release of aqueous chromium to the subsurface at numerous sites. While chromium oxidation states range from - 2 to +6 (Cotton, et al., 1988), the + 3 and + 6 states are most prevalent in the environment. The hexavalent chromium anions chromate (CrO 4 2- ), bichromate (HCrO 4 - ) and dichromate (Cr 2 O 7 2- ) are not strongly sorbed in many soils under alkaline condition to slightly acidic condi-tions (Kabir and Ogbeide, 2008; Abdullahi et al., 2009). Chromium (VI) is recognized to be much more toxic than Cr (III), and is found to be toxic to bacteria, plants, animals and people. Human toxicity includes lung can-cer, as well as kidney, liver, and gastric damage. There-fore, the level of chromium in discharged wastewater should be reduced. Its concentrations in industrial wastewaters range from 0.5 to 270,000 mg L -1 . Many countries have regulations of the maximum permissible concentration of Cr (VI) in natural or drinking water. The tolerance limit for Cr (VI) for discharge into inland surface waters is 0.1mg/L and in potable water is 0.05 mg/L. Thus, the removal of Cr (VI) from industrial ef-fluents is important before discharging them into aquatic environments or onto land (Kumbasar, 2009). Various methods have been developed for the removal of chromium (VI) from industrial waste waters. It in-cludes chemical precipitation, ion exchange, solvent extraction, reverse osmosis, diffusion dialysis, adsorp-tion, etc. (Palmer et al., 1988). The conventional and the most commonly used method for chromium (VI) removal is chemical precipitation (Young et al., 1986). In this method, the Cr (VI) is first reduced to Cr (III) which is then precipitated for removal. But the pro-cess is very tedious requiring a large amount of chemi-cals (Sahmoune et al., 2009; Biati et al., 2010). In recent years, a remarkable increase of the appli-cations of liquid membranes in separation processes is observed. These membranes include bulk liquid membranes (BLMs), emulsion liquid membranes (ELMs), and flat sheet supported liquid membranes (FSSLMs). Two papers (Zouhri et al., 1995; Zouhri et al., 1999) deal with applications of BLMs for Cr (VI) removal using dicyclohexane-18-crown-6 as ion car-rier. Several results of the concentration and separa-tion of chromium (VI) with ELM process have been also reported. Tertiary amines, such as tri-n-dodecylamine (Mori et al., 1999), and Alamine 336 (Kumar et al., 1994) were used as the ion carriers. Qua-ternary ammonium salt, such as Aliquot 336 was also applied as an ion carrier in ELMs (Salazar et al, 1992; Banerjea et al, 2000). The applications of FSSLMs for chromium (VI) concentration and separation with ter-tiary amines and quaternary ammonium salts as the most widely used ionic carriers have been shown in two papers (Chiarizia, 1991; Wang et al., 1998). Re-cently, in this papers reported the use of the commer-cially available phosphine oxide [Cyanex 923] (Alguacil et al., 2000). A common problem for FSSLMs is the loss of membrane, diluents and/or carrier to the both aqueous phases, and as the result the FSSLM-based processes have not been exploited industrially due to their poor durability. Recently, published papers, which deal with chromium (VI) transport across ELMs (Bhowal and Datta, 2001) and FSSLMs (Alguacil et al., 2001; Park et al., 2001). The FSSLM technology offers an attractive alternative to the conventional liq-uid-liquid (L-L) extraction by combining the extraction and stripping in a single step operation. An FSSLM usually consists of an organic solution immobilized in the pores of a hydrophobic macro porous membrane that contains an extractant agent (carrier) that selec-tively binds one of the components from the feed so-lution. The FSSLM separates, by means of two inter-faces, the aqueous solution containing the species that diffuse (feed) and the solution into which the species will diffuse (strip). The species are accumulated in the strip phase at a concentration generally greater than that in the feed phase. The permeation of the species is due to a chemical potential gradient (the driving force of the process) that exists between the opposite sides of the FSSLM. High enrichment factors (EFs) can be achieved when using FSSLM in hollow fiber (HF) con-figuration which has several additional advantages like the high feed to stripping volume ratio leading to higher enrichment of the analyte and easy coupling to the sensitive analytical techniques (Cezary and Walkowiak, 2002; Asraf and Mian, 2006). The present work has been undertaken in an at-tempt to simulate the Cr (VI) extraction efficiency in feed phase using artificial neural network model. ANN has a vast range of applications in fields of agricul-ture, weather forecasting, finance and economics, medi-cine, robotics, material science, chemistry and chemi-cal engineering, etc(Naik and Manjapp, 2010). Appli-cations of ANNs to the chemical engineering have in-creased significantly since 1988. One of the first appli-cations was by Hoskins and Himmelblau (Hoskins and Himmelblau, 1988; Jalili Ghazi Zade and Noori, 2008), who applied ANN to fault diagnosis. Since then the number of research publications on ANN applications in chemical engineering has risen astronomically. Re-cently artificial neural networks have been used for modeling of liquid-liquid extraction column (Chouai et al., 2000), vapor-liquid equilibrium data analysis for mixed solvent (Iliuta et al., 2000) and for modeling of transportation and dispersion of tracers in complex terrain (Podnar et al., 2002). The objective of the present study is to develop and train a network of suitable architecture for simula-tion of Cr (VI) extraction efficiency in feed phase. Ex-perimental data from laboratory analysis have been used to train the network employing the back-propa-gation learning algorithm. The predicted values of Cr (VI) extraction efficiency in feed phase are found to be in good agreement with the experimental results. Materials and Methods Artificial Neural Networks (ANNs) consist of large number of processing elements with their intercon-nections. ANNs are basically parallel computing sys-tems similar to biological neural networks. They can be characterized by three components:
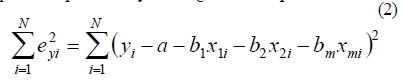
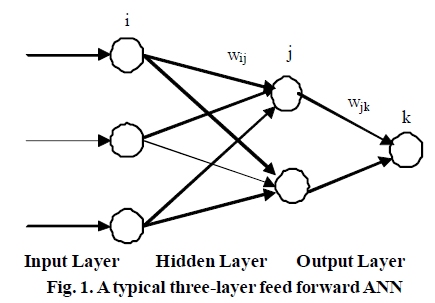
ANN modeling is a nonlinear statistical technique. It can be used to solve problems that are not amenable to conventional statistical and mathematical methods. In the past few years there has been constantly in-creasing interest in neural networks modeling in dif-ferent fields of chemical engineering (Abilov and Zehra, 2000; Rajasimman et al., 2009).The basic unit in the artificial neural network is the node. Nodes are con-nected to each other by links known as synapses, as-sociated with each synapse there is a weight factor. Usually neural networks are trained so that a particu-lar set of inputs produces, as nearly as possible, a specific set of target outputs. The most commonly used ANN is the three-layer feed-forward ANN. In feed-for-ward neural networks architecture, there are layers and nodes at each layer. Each node at input and inner lay-ers receives input values, processes and passes to the next layer. This process is conducted by weights. Weight is the connection strength between two nodes. The numbers of neurons in the input layer and the output layer are determined by the numbers of input and output parameters, respectively. In the present feed-forward artificial neural networks are used. The model is shown in [Figure - 1]. In the [Figure - 1], i, j, k denote nodes input layer, hid-den layer and output layer, respectively. w is the weight of the nodes. Subscripts specify the connections be-tween the nodes. For example, wij is the weight be-tween nodes i and j. The term "feed-forward" means that a node connection only exists from a node in the input layer to other nodes in the hidden layer or from a node in the hidden layer to nodes in the output layer; and the nodes within a layer are not interconnected to each other.Commonly, neural network modeling follows these steps: database collection; analysis and prepro-cessing of the data; training of the neural network. The latter includes the choice of architecture, training functions, training algorithms and parameters of the network; testing of the trained network; and using the trained neural network for simulation and prediction. The model developed here has adopted these steps. Multiple linear regression attempts to model the rela-tionship between two or more explanatory variables and a response variable by fitting a linear equation to observed data. Every value of the independent vari-able X is associated with a value of the dependent variable Y. If it is assumed that the dependent variable Y is affected by m independent variables X 1 , X 2 , ..., X m and a linear equation is selected for the relation among them, the regression equation of Y can be written as:
y in this equation shows the expected value of the variable Y when the independent variables take the values X 1 = x 1 , X 2 = x 2 , ..., X m = x m . The regression coefficients a, b1 , b2 , ..., bm are evalu-ated, similar to simple regression, by minimizing the sum of the eyi distances of observation points from the plane expressed by the regression equation.
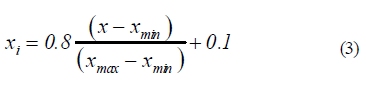
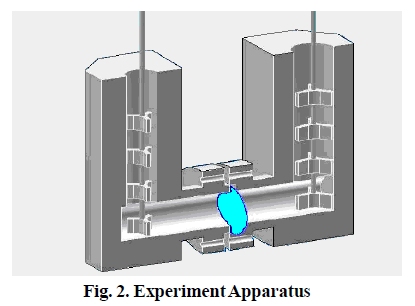
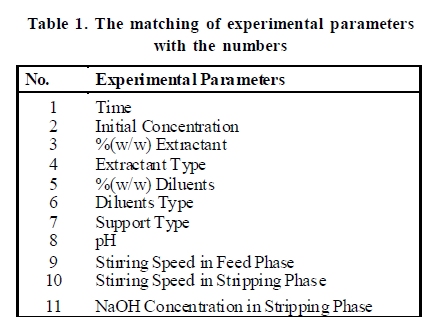
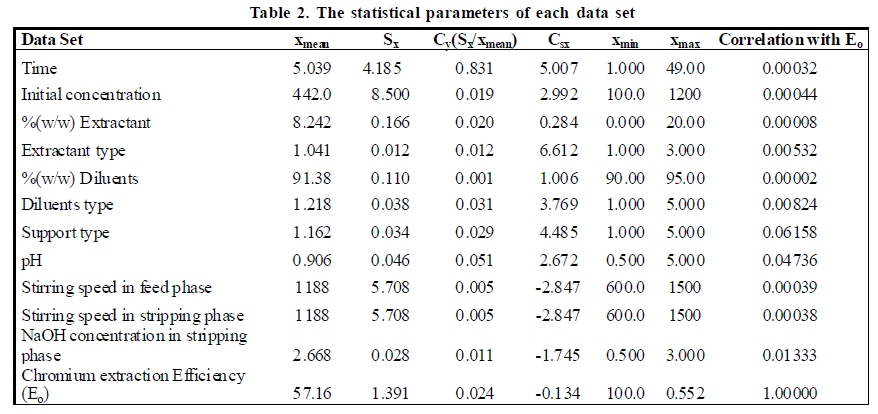
In this study, the coefficients of the regressions were determined using least square method.The FSSLM were impregnated with carrier (Alamine 336) solu-tions containing the extractant dissolved in chloroform, car-bon tetrachloride, n-decanol, toluene, cycloheksan and immersed for 12 hour and then leaving it to drip for a few seconds before being placed in the transport cell. Batch FSSLM measurements were performed in a two-compartment permeation cell was showed [Figure - 2] which consisted of a feed phase (250 mL) separated from a stripping phase chamber (200 mL) by a FSSLM having an effective membrane area of 19.63 cm 2 . The feed and stripping phases were mechanically stirred at various rpm. Samples were taken each an hour while phases were being stirring. Membrane permeabilities were determined by monitoring Cr (VI) concentration by AAS (Shimadzu AA-6701GF spectrophotometer) in the feed and strip-ping phase as a function of time. The chromium con-centration in the various phases was found to be re-producible within ±4%. Cr (VI) extraction efficiency in feed phase (E o ), time, initial concentration, % (w/w) extractant, extractant type , % (w/w) diluents, diluents type, support type, pH, stirring speed in feed phase, stirring speed in strip-ping phase, NaOH concentration in stripping phase data sets obtained from the laboratory experiments were used in the study. The matching of experimental parameters with number is given below [Table - 1]. The statistical parameters of each data are given in [Table - 2]. In this table, X mean ,S x ,C v ,C sx ,x min and x max denote the mean, standard deviation, variation, skewness coeffi-cient, minimum and maximum of the data, respectively. It is clearly seen from [Table - 2] the mostly varied (C v =0.831) data is time. Its minimum value is 1.00 while its mean and maximum values are 5.039 and 49.00, re-spectively. The highest correlation coefficient with the E o (0.0616) belongs to the support type. Results and Discussion In this study, before the training of the model both input and output variables were normalized within the range 0.1 to 0.9 as follows:
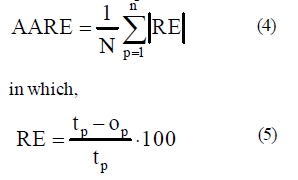
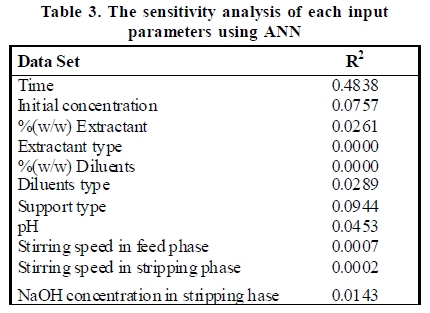
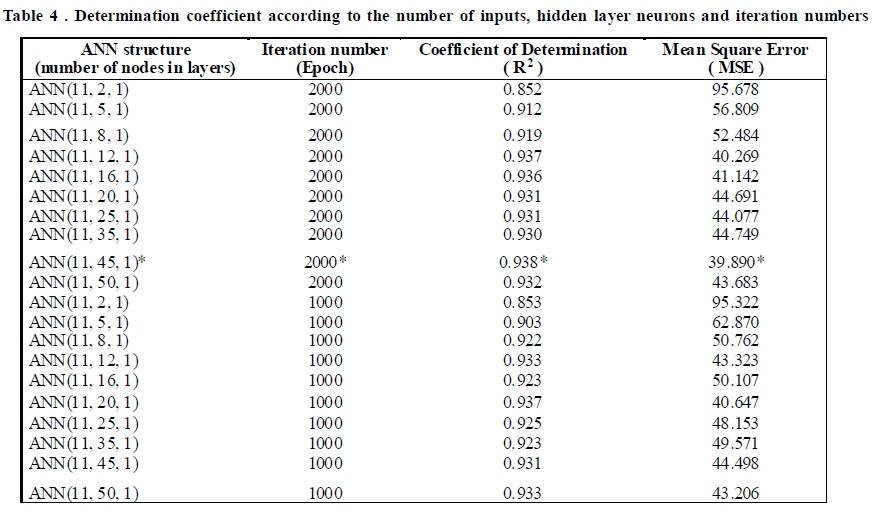
where x i is the normalized value of a certain parameter, x is the measured value for this parameter; x min and x max are the minimum and maximum values in the database for this parameter, respectively. To develop an ANN model for estimating R o , the avail-able data set was partitioned into a training set and a test set according to station. About 63% (261 labora-tory data set) of the available record was selected for training while the remaining 37% (152 for laboratory data set) was used for testing. For all created neural networks the general structure of input, one hidden and one output layer was used. In order to determine the optimal architecture, several neural networks were trained with different iteration number (epoch) and number of nodes in the hidden layer. For all cases a "log sigmoid transfer function (logsig)" was used in the hidden and output layers. When the logsig was applied, the inputs and the outputs were normalized to within the range 0-1. The most accurate estimations of the ANN's were obtained with log sigmoid transfer function. The selection of the input parameters is a very impor-tant aspect for the neural network modeling. In order to use ANN structures effectively, input variables in the phenomenon must be selected with a great care. This highly depends on the better understanding of the problem. In a firm ANN architecture, in order not to confuse training process key variables must be intro-duced and unnecessary variables must be avoided. For this purpose, a sensitivity analysis can be used to find out the key parameters. Also sensitivity analysis can be useful to determine the relative importance of the parameters when sufficient data are available. The sensitivity analysis is used to determine the effect of changes and to determine relative importance or effec-tiveness of a variable on the output. The input vari-ables that do not have a significant effect on the per-formance of an ANN can be excluded from the input variables, resulting in a more compact network. Then, it becomes necessary to work on methods like sensi-tivity analysis to make ANN work effectively. E o de-pends on the some independent parameters and those can be given in this form: E o =f(time, initial concentra-tion, % (w/w) extractant, extractant type , % (w/w) diluents, diluents type, support type, pH, stirring speed in feed phase, stirring speed in stripping phase, NaOH concentration in stripping phase). The eleven ANN models were established using each independent pa-rameter separately. Sensitivity analysis applied for find-ing the most effective input parameters. Sensitivity analysis determination coefficient (R 2 ) of the param-eters involved in the phenomenon is given in [Table - 3]. It is clearly seen from [Table - 3] that the most effective parameter is determined as time. One of the problems that occur during neural net-work training is called over fitting. Over fitting is suggested when the error on the training set is driven to a very small value, while for the test data presented to the network the error is large. That means the network has memorized the training examples, but it has not learned to generalize to new situations. In order not to over fit training data, appreciate epoch number, num-ber of hidden layers and node number of hidden layer must be chosen by trial and error process. Networks are sensitive to the number of nodes in their hidden layers. Too few nodes can lead to under fitting and too many nodes can result in over fitting. In order to reach an optimum amount of hidden layer nodes 2, 5, 8, 12, 16, 20, 25, 35, 45 and 50 nodes are tested. The results are shown in [Table - 4]. The first column in this table denotes the nodes of each layer for the ANN models. Accordingly, an ANN structure like ANN (i,j,k) indi-cates a network architecture with i, j and k nodes in input, hidden and output layers, respectively. In this case the input layer covers time, initial concentration, % (w/w) extractant, extractant type , % (w/w) diluents, diluents type, support type, pH, stirring speed in feed phase, stirring speed in stripping phase, NaOH con-centration in stripping phase and the output layer con-sists of the Cr (VI) extraction efficiency in feed phase (E o ). It can be seen from the [Table - 4] that the ANN (11,45,1) model with 2000 iterations has the R2 value of 0.938 and MSE value of 39.890 is the best model. It appears that while assessing the performance of any model for its applicability in estimating E o , it is not only important to evaluate the average prediction error but also the distribution of prediction errors. The statistical performance evaluation criteria employed so far in this study are global statistics (R 2 and MSE) and do not provide any information on the distribution of errors. Therefore, in order to test the robustness of the model developed, it is important to test the model us-ing some other performance evaluation criteria such as average absolute relative error (AARE). The AARE not only gives the performance index in terms of pre-dicting E o but also shows the distribution of the pre-diction errors. These criteria can be computed as:
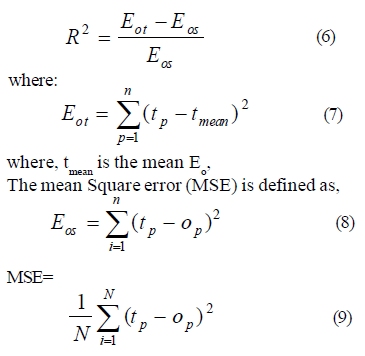
where RE is the relative error in forecast expressed as percentage, t p is the observed E o for the p th pattern; and o p is the computed E o for the p th pattern which is produced by ANN; and N is the total number of the testing patterns. Clearly the smaller the value of AARE is the better performance. The performance control of the ANN output was evaluated by estimating the de-termination coefficient (R 2 ) which is defined as:
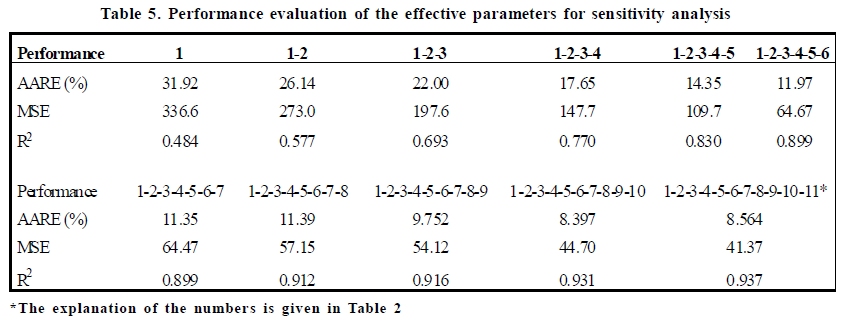
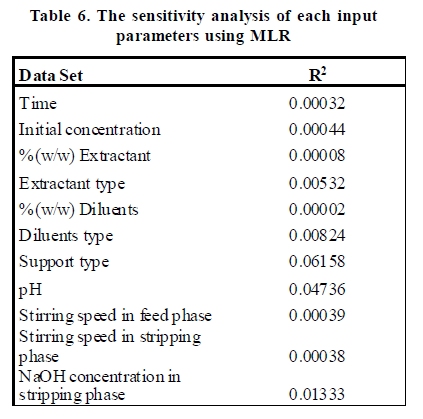
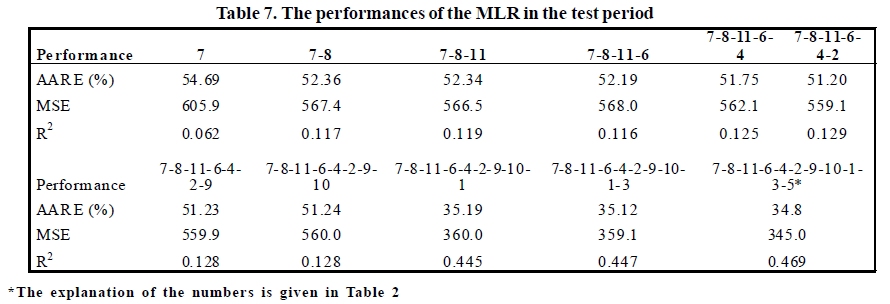
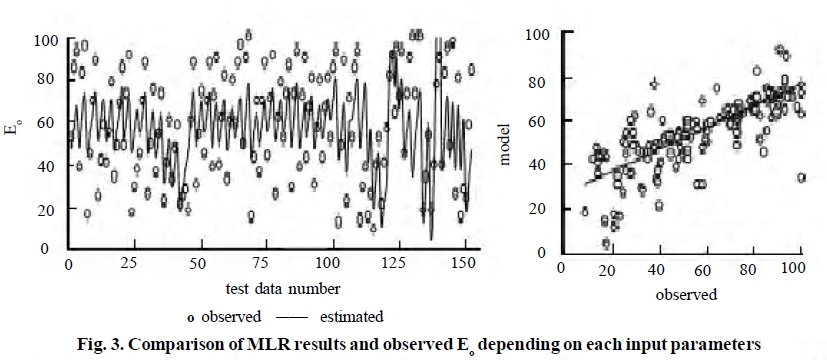
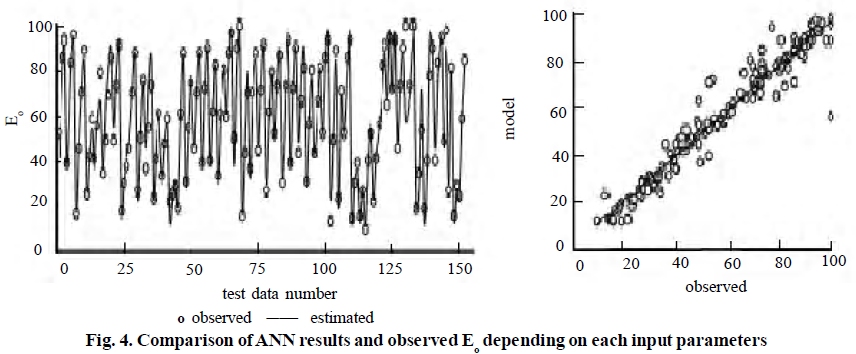
Time is used as the common parameter for the rest of the sensitivity analysis. Performance evaluation of all possible combination of variables such that each and every combination includes time, was also inves-tigated. The findings are listed in [Table - 5]. As can be seen from [Table - 3], the most effective parameter is deter-mined as time. However, it is clearly seen from [Table - 5] adding other parameters into model increases the mod-els' performances. Based on the findings, as depicted in [Table - 5] the ANN model has eleven inputs (time, initial concentration, % (w/w) extractant, extractant type , % (w/w) diluents, diluents type, support type, pH, stirring speed in feed phase, stirring speed in stripping phase, NaOH concentration in stripping phase) gives the best estimation.Sensitivity analysis determination coefficient (R 2 ) of the parameters involved in the phenomenon is given in [Table - 6]. It is clearly seen from [Table - 6] that the most effective parameter is determined as support type. The performance criterion for the test results of the MLR model is given in [Table - 7]. The MLR estimates are demonstrated in [Figure - 3]. As can be seen from [Table - 7], the most effective parameter is determined as support type. However, it is clearly seen from [Table - 7] adding other parameters into model increases the models' performances. Based on the findings, as depicted in [Table - 7] the MLR model has eleven inputs (time, initial concentration, % (w/w) ex-tractant, extractant type , % (w/w) diluents, diluents type, support type, pH, stirring speed in feed phase, stirring speed in stripping phase, NaOH concentration in strip-ping phase) gives the best estimation.The performance of the MLR and selected neural network model in pre-dicting of E o is demonstrated in [Figure - 3] and [Figure - 4] for the test data set, respectively. The MLR has poor estimates. It is a drawback for the MLR. The comparison of the [Table - 5] and [Table - 6] also showed that the phenomenon is a non-linear problem. As can be seen from [Figure - 4]. the ANN estimates follow the corresponding experimental measured data with a significantly high R 2 value of 0.938. Furthermore ANN significantly outperforms MLR model in terms of E o estimation. Conclussion The present study demonstrates the capabilities of artificial neural network model (ANN) for E o model-ing, however the choice of ANN architecture and in-put parameters are crucial for obtaining good estimate accuracy. Thus, sensitivity analysis had been con-ducted to determine the degree of effectiveness of the variables by using various performance statistics. From the results, an ANN model appears to be a useful tool for prediction of the E o . The results showed that the input variable time was found to be more effective on E o estimation by using ANN. Remaining parameters were used one by one in estimating Eo . The models whose inputs are the time, initial concentration, % (w/ w) extractant, extractant type, % (w/w) diluents, diluents type, support type, pH, stirring speed in feed phase, stirring speed in stripping phase, NaOH con-centration in stripping phase have the best perfor-mance criteria among the input combinations tried in the study. This indicates that all these variables are needed for better Eo modeling. The MLR is also used for Eo estimation. However, MLR has poor estimates. It is a drawback for the MLR. Based on the comparison results, the ANN technique was found to be signifi-cantly superior to the MLR technique. Acknowledgement The authors wish to express their gratitude for the support extended by the authorities of Sakarya Uni-versity, Adapazari, Turkey in carrying out the research work in chemistry research laboratory, Department of Chemistry.[30] References
Copyright 2010 - International Journal of Environmental Research The following images related to this document are available:Photo images[er10051t1.jpg] [er10051t6.jpg] [er10051t5.jpg] [er10051t4.jpg] [er10051t3.jpg] [er10051f4.jpg] [er10051t2.jpg] [er10051t7.jpg] [er10051f1.jpg] [er10051f2.jpg] [er10051f3.jpg] |
| |||||||||
