 |
| About Bioline | All Journals | Testimonials | Membership | News |
|
||||||
|
||||||
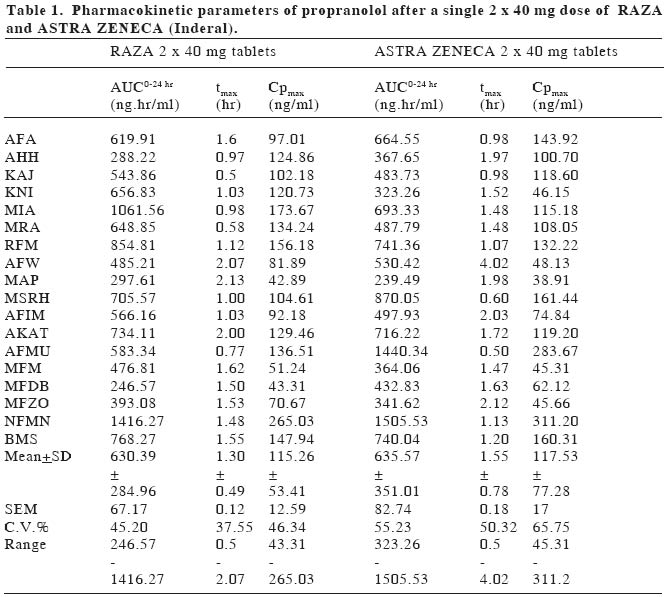
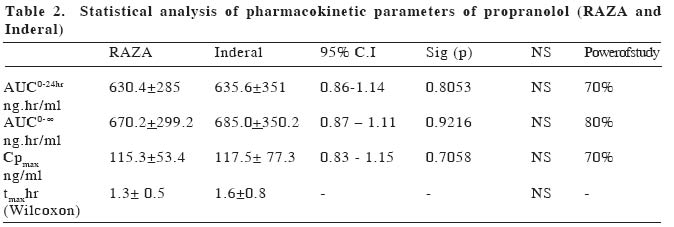
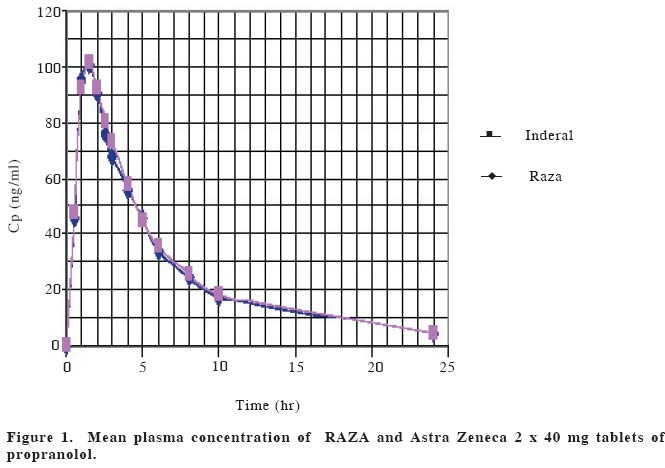
European Journal of General Medicine, Vol. 1, No. 4, 2004, pp. 42-47 ORIGINAL ARTICLE BIOEQUIVALENCE STUDY OF PROPRANOLOL TABLETS Zabidah Ismail, Mohd Suhaimi Abdul Wahab, Abdul Rashid Abdul Rahman University Sains Malaysia, The School of Medical Sciences, Department of Pharmacology The purpose of this study is to compare the bioavailability of a test tablet of propranolol (RAZA propranolol, Pharmaniaga) against an innovator product (Inderal, Astra Zeneca). The study was performed in eighteen healthy male volunteers for a single 2 x 40 mg dose of propranolol tablets. The study design used was a randomized, double blind two-period crossover design. Blood samples were collected before and within 24 hours after drug administration and plasma propranolol concentration was determined using HPLC method. Statistical analysis of the propranolol data indicated that none of the accepted parameters for drug bioavailability (AUC0 to 24hr, AUC0 to ∞ ,tmax and Cp max ) were significantly different between treatments for the single dose data. Parameters of AUC0 to 24hrof 630.4±285.0 ng.hr/ml vs 635.6±351.0 ng.hr/ml, AUC0 to ∞, 670.2±299.2 ng.hr/ml vs 685.0±350.2 ng.hr/ml, tmax1.3±0.5 hr vs 1.6±0.8 hr and Cpmax115.3±53.4 ng/ml vs 117.5±77.3 ng/ml were obtained with test and reference formulations respectively. The 95% confidence interval of the log of ratio of AUC0 to 24hr, AUC0 to ∞ and Cp max were within the range of 0.80-1.25. It can be indicated that the two tablet dosage forms (i.e. RAZA and Inderal) showed similar bioavailability and are therefore considered bioequivalent. Keywords: propranolol, bioequivalence, bioavailability, pharmacokinetics INTRODUCTIONThe Ministry of Health is constantly emphasizing the quality, efficacy and safety of pharmaceutical products to safeguard the Malaysians public1. The Drug Control Authority at its 92nd meeting has decided to review the registration of generic products to include bioequivelent studies requirement for certain categories of oral immediate release products2 Bioavailability testing of drug products in humans provides the most appropriate method available for determining bioquivalence. Bioavailability means the rate and extent to which the active substance or therapeutic moiety is absorbed from a pharmaceutical form and becomes available at the site of action. Two medicinal products are bioequivalence if they are pharmaceutical equivalents or alternatives and if their bioavailabilities after administration in the same molar dose are similar to such degree that their effects, with respect to both efficacy and safety, are essentially the same3,4,5. The generic drug preparation that needs this bioequivalent study is the propranolol tablet manufactured by RAZA Manufacturing Berhad. Propranolol (1-(isopropylamino)-3-(1-naphthyloxy)-2-propanol) is a nonselective beta-adrenergic blocker that interacts with b1 and b2 receptors of the autonomic nervous system with equal affinity. It lacks intrinsic symphatomimetic activity (negative inotrophic effect) and does not block a-adrenergic receptors. Propranolol is a white solid with pKa value of 9.4. It is not readily soluble in water except alcohol (methanol), practically insoluble in ether, benzene, and ethyl acetate6,7. Propranolol is a highly lipophilic substance and is almost completely absorbed following oral administration. However, most of the drug is metabolized in the liver during its first passage through the portal circulation; on average, about 25% reach the systemic circulation. The mean peak plasma concentrations of between 15 -180 ng/ml are reached in 2-3 hours after a 80 mg dose9. There is great interindividual variation in the presystemic clearance of propranolol by the liver. This contributes to enormous variability in plasma concentrations (approximately 20fold) after oral administration of the drug and in a way contributes to the wide range of doses required to produce clinical efficacy8. Propranolol is extensively metabolized to 4-hydroxyl-propranolol followed by conjugation with glucoronic acid9. The elimination half life (t1/2) of propranolol has been reported to range from between 3 hours to 6 hours or approximately 3.9 hours3. Propranolol has a large volume of distribution (4 L/kg) and readily enters the CNS. Approximately, 90% of the drug is bound to plasma proteins. The drug is used in the treatment of hypertension, hyperthyroidism, cirrhosis, angina pectoris, migraine and glaucoma. The adverse effects of propranolol are bronchoconstriction and disturbance in metabolism9. RAZA wishes to market propranolol tablets in Malaysia and overseas. It is a standard Ministry of Health, Malaysia submission requirement for them to compare the bioavailability of their generic preparation to the most commonly prescribed brand product or innovator (Inderal by Astra Zeneca). The objective of this study is to compare the bioavailability of RAZA product with Inderal according to the Ministry of Health requirement as set out in the Malaysian Guidelines for the Conduct of Bioavailability and Bioequivalence studies, 20002. MATERIAL AND METHODSThis bioequivalence study was approved by the Research and Ethical Committee of the School of Medical Sciences, Universiti Sains Malaysia on 5th February 2002 (USM/ PPSP®/EthicsCom./2002(74.3[6]). The study was based on a randomized, double blind, two period crossover design. Blood sampling was performed at the Clinical Trial Unit, Universiti Sains Malaysia and the analytical work was done at the Pharmacology Laboratory, The School of Medical Sciences, Universiti Sains Malaysia. SubjectsThe subjects/volunteers for bioequivalence studies were selected with the aim to minimize variability and permit the detection of differences between pharmaceutical products2. Eighteen (18) healthy male subjects were recruited for this study, aged between 19 and 25 years (22.8+2.2 yrs), of normal weight (63.8+6.8 kg), height (169.8+6.2 cm) and BMI (22.0+1.8) were included in the study. Each subject underwent a medical examination as well as clinical and routine laboratory evaluation tests including hematology, blood chemistry and urinalysis. One subject (AFW) smoked around five cigarettes per day. Individuals with any significant disease history were excluded from the study. Any subjects with laboratory results more than two standard deviations from the mean value (of each test) for laboratory performing the test (Chemical Pathology Dept., Microbiology Dept. and Hematology Dept., The School of Medical Sciences, Universiti Sains Malaysia) were excluded from the study11. Alcoholics, drug addicts and obese individuals were excluded from the study. Before joining the study, all subjects were briefed on the details of the bioequivalence study, agreed and signed a consent form. All volunteers were free to leave the study at any time. Study DesignA crossover design was used whereby equal number of subjects were taking the test preparation and reference preparation during each phase of the study. On the first dosing day each subject took on a randomized basis either two propranolol tablets (40 mg each) of Astra Zeneca (batch no. LOT OM943B, expiry date, June 2004) or two of the RAZA (batch no. 1P0378, expiry date, December 2004) propranolol tablets (40 mg each) orally with 150 ml water. After a 2 weeks wash-out period, each subject took two tablets of the other products. All subjects, physicians and drug analysts were blinded. Subjects received formulations following an overnight fast and further food or drink was withheld for at least three hours after the drug administration. After 3 hours, subjects were given a standard breakfast (of 2 slices of cheese sandwiches and a Milo drink), lunch at 6 hours (of chicken rice and orange juice) and at 10 hours post-dose, dinner (of mee soup and orange juice). Subjects were not taking any other concurrent medications12. Ten mililitre blood samples were collected from an indwelling venous canula or by repeated venipuncture, at predose, and at 30 minutes, 1.0, 1.5, 2.0, 2.5, 3.0, 3.5, 4.0, 5.0, 6.0, 8.0, 10.0 and 24.0 hours after drug administration. Each blood sample was centrifuged immediately, plasma separated and kept frozen at -200C until analysis. Each plasma sample was analysed using high-pressure liquid chromatography (HPLC) method. The plasma concentration-time data were tabulated and the parameters derived from the profiles were analysed statistically in order that the comparative bioavailability of the two dosage forms can be determined. Propranolol analysis and method validationOne ml of plasma and 70 µl oxprenolol, (10 µg/ml) as internal standard, was placed in a screw-capped glass tube. To each tube, 100 µl water and 50 µl 5N NaOH were added, followed by vortexing for 30 seconds. The drugs were extracted with 3.5 ml of the extraction solvent (isoamyl-alcohol [1.5 ml]: n-heptane [98.5 ml]) and shaken on a rotator mixer for twenty minutes. This was followed by centrifugation (3000 rpm) for 10 minutes. The organic phase was then transferred by aspiration to a clean glass tubes. The extraction procedure was repeated with the remaining samples. A gentle flow of nitrogen (10 ml/min) was used to dry the organic phase. The residue was reconstituted in 70 µl of mobile phase and vortex-mixed for 20 sec. Twenty microlitres of the sample was injected directly onto Lichrosorb C18 HPLC (12.5 cm) column and detection was done by ultraviolet detector set at 254 nm13. The HPLC system comprised of a Gilson 307 peristaltic pump, a Gilson 115 variable wavelength UV detector, a Gilson 234 Autoinjector, and a DELL-Optiplex GX1 computer as integrator using Unipoint software. The mobile phase consisted of a mixture of water, methanol, acetonitrile, acetic acid and triethylamine in the proportion of 160ml: 80ml: 70ml: 2.5ml: 125µl, respectively13. The pH was adjusted to 3.4 using 1N NaOH before the addition of triethylamine. The mobile phase was filtered off of all residues and that filtration also removed dissolved gas. The mobile phase flow rate was 0.5ml/min14. The main objective of method validation is to demonstrate the reliability of a particular method for the quantitative determination of an analyte concentration in a specific biological matrix2. This procedure took 3-6 months prior to clinical studies. The characteristic of a bioanalytical method essential to ensure the acceptability of the performance and reliability of analytical results are:
Under these conditions, the retention times for propranolol and oxprenolol were 9.67 and 6.86 minutes, respectively. Calibration was linear in the concentration range of 15-180 ng/ml, the regression line can be described by y:0.0028x-0.006 and the coefficient of correlation was 0.9949. The inter-day calibration curve showed consistent linearity, as seen by consistency of intercept, slope and coefficient of correlation. Intra-day precision was determined at five concentrations (15, 30, 60, 120 and 180 ng/ml) in plasma, each repeated five times (in duplicate) using the area ratio technique. Intra-day precision in this study expressed, as means of percent of coefficient of variation (CV) were 8.24%. The plot of propranolol (PRN) area ratio to concentrations (15-180 ng/ml) is linear with R2:0.9948. Inter-day precision was determined singly at five concentrations (15-180 ng/ml) in plasma, in seven replicate runs (7 days). Inter-day precision in this study expressed, as means of percent of coefficient of variation (CV) were 9.8%. The plot of area ratio to concentrations (15-180 ng/ml) is linear with R2:0.9906. Under optimal conditions, the limit of quantification based on 3 times noise level using 1 ml plasma sample and 20 µl injection volume was 9 ng/ml. Three concentrations of propranolol (20, 100 and 160 ng/ml) were used for stability studies showed consistent linearity (intercept, slope, and coefficient of correlation) over a six week period (CV:8.16%). Standard curves were performed daily with each volunteer's plasma samples. Data analysisAn Excel (Microsoft) programme was used to plot the plasma concentration-time curve. Actual sampling time was used and later rounded up for easy tabulation. Pharmacokinetic parameters determined in this study were AUC 0 to 24hr, AUC 0 to ∞, tmax, CPmax. AUCs are area under the plasma concentration curve from administration to 24 hours and 0 hour to infinity, respectively. The AUC reflects the total amount of active drug that reaches the systemic circulation4. Parameter tmax is the time passed since administration at which the maximum plasma concentration occurs. At tmax, absorption is maximum and the rate of drug absorption exactly equals the rate of drug elimination. When comparing drug products, tmax can be used as an approximate indication of drug absorption rate. The value for tmax will become smaller as the absorption rate for the drug becomes more rapid4. Maximal plasma concentration (Cpmax) provides an indication that the drug is sufficiently systemically absorbed to provide a therapeutic response. In addition, CPmaxprovides warning of possibly toxic levels of drug. The following parameters were calculated for each subject and treatment phase: a.Maximum plasma concentration (Cpmax) isthe observed maximum plasma concentration.b. Time of maximum plasma concentration (tmax) is the time of the maximum plasma concentration. c. Area under the plasma concentration-time curve (AUC) -AUC from zero time to the last data point was calculated by the trapeizoidal method (using Excel programme). It should be noted that actual sampling times rather than nominal sampling times were used in the calculation of AUC (and other relevant parameters). (Table 1, 2) (Fig. 1) Statistical methodDifferences between study phases in the calculated parameters were tested for statistical significance by an analysis of variance (ANOVA for a crossover study; taking account of treatment and period effects) and confidence intervals (90%) were calculated for each of the comparisons using the following equation: A 90% confidence interval: -t√MSerror /N/2-( XR -XT) <ln (mT/mR)< t√MSerror /N/2-( XR -XT) where MSerror is mean square error from ANOVA table, XR is mean of reference product, XT is mean of test product and N is the number of subjects15. Data for AUCs and Cpmax were log transformed prior to analysis. The formula was used to calculate the CV% which was then used to estimate the power of study using the tables provided by Diletti et al15,16. For bioequivalence, the test and reference products required that a 90% confidence interval of the ratio of means of pharmacokinetic parameters i.e. AUCs and Cpmax must be in the range of 0.80 -1.25. Differences between study phases in tmax were tested for statistical significance max by the Wilcoxon Signed Rank non-parametric analysis17. RESULTSAll volunteers satisfied the inclusion criteria and signed the consent forms prior to the screening tests. The study involved a 2 weeks washout period before the next crossover and each individual volunteers plasma samples (test vs reference) were assayed on the same day batch to avoid laboratory/analyst error. No adverse effects were reported and there was a decline in blood pressure observed Drugs with significant first pass effect like propranolol show high interindividual variation in plasma drug concentrations8. There was no statistically significant difference in the mean of the four parameters (AUC 0 to 24hr, AUC0-∞, Cp max and tmax ) between the test (RAZA) and the reference product (Inderal). The level of significant (p value) obtained by ANOVA table was greater than 0.05. DISCUSSIONIn the context of bioavailability study, the "power of study" is to detect a significant of 20% difference between treatment mean, if a 20% difference or less actually existed between the two products with the specified number of subjects in the study. In the present study, the power of study for both AUC0 to 24 and Cp max was70% and that of AUC0-∞ was 80%. While the 95% Confidence Interval of the ratio of AUC0 to 24, AUC0-∞and Cp max between RAZA and Inderal tablets were in the range of 0.80-1.25 as recommended by USP24NF 19 guidelines for bioequivalence study7. Therefore, bioequivalence can be indicated RAZA and Inderal propranolol tablets. Statistical analysis of the propranolol data indicated that none of the accepted parameters for drug bioavailability (AUC0 to 24, AUC0-∞, Cpmax and tmax ) were significantly different between treatments for the single dose data. Such a finding indicates that under the same experimental protocol described, the two tablet dosage forms (i.e. RAZA and Inderal, Astra Zeneca) have been shown to have similar bioavailability and are therefore considered bioequivalent with regard to extent and rate of absorption. Acknowledgement This work was supported by RAZA Grant No. 334/ PPSP/6150047/R102. We are grateful to En. Mohd Radzi Dzulkhairi b Mohd Ali, Puan Norma Musa, En. Tengku Zulkhairuazahar Tuan Yahaya, En Abdul Razak Ahmad, Bioequivalence of propranolol En Rosliza Harun, Puan Maria Yohanis Abdullah and Cik Ang Pay Kim for their technical assistance. The above project has been approved by the Research and Ethics Committee, Universiti Sains Malaysia, number: USM/ PPSP®/EthicsCom./2002(74.3[6]. REFERENCES
Copyright 2004 - Medical Investigations Society The following images related to this document are available:Photo images[gm04043t2.jpg] [gm04043f1.jpg] [gm04043t1.jpg] |
| |||||||||