 |
| About Bioline | All Journals | Testimonials | Membership | News |
|
||||||
|
||||||
European Journal of General Medicine, Vol. 2, No. 1, 2005, pp. 10-13 THE LOAD FOR THE WINGATE TEST: ACCORDING TO THE BODY WEIGHT OR LEAN BODY MASS Kağan Üçok1, Hakkı Gökbel2, Nilsel Okudan2 Afyon Kocatepe University, Faculty of Medicine, Department of Physiology1,
Afyon Code Number: gm05003 Aim: The purpose of this study was to determine if it was more appropriate
assignment of the load of the Wingate test according to the lean body mass
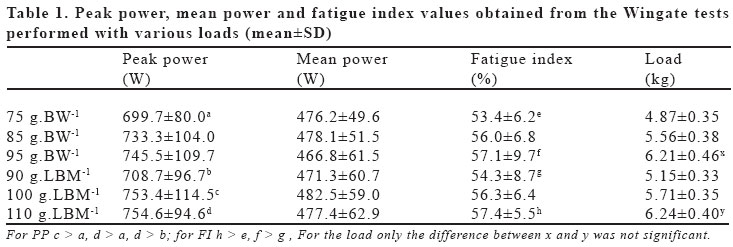
in young males. Key words: Anaerobic performance, body fat percent, load optimization, supramaximal exercise, Wingate test, lean body mass. INTRODUCTION Wingate test as a supramaximal exercise test involves pedaling a cycle ergometer for 30 seconds at a maximal speed against a resistance which is determined according to the subject's body weight (1,2). The Wingate test is proven to be valid and reliable (3) and the most popular anaerobic performance test since it does not require complicated equipment, and has a simple and non-invasive method (4,5). These advantages make it possible to use the Wingate test for the sedentary (6), athletes (7,8), children (9), elderly (10), disabled (11) and patients with the chronic diseases (12,13). The issue of optimal force in the Wingate anaerobic test is not fully resolved. Wingate Institute where Inbar et al. (14) applied 75 g.kg-1 load to the sedentary adolescent males and developed the test, recommended that the load should be 75 g.kg-1(4.41 Joule.rev-1.kg body weight-1) when Monark ergometer was used (1,4). Various studies (4,15,16) reported that the load commonly used for the Wingate test was low and that different load applications were required to obtain the highest power outputs. Vandewalle et al. (17) stated that loads of 95 g.kg-1 for men, 86 g.kg-1 for women, and 75 g.kg-1 for children were optimum, Bar-Or (4) recommended a force of 90 g.kg-1 for adult nonathletes and 100 g.kg-1 for adult athletes. Various studies (8,15,18,19) indicates the relations between the lean body mass (LBM) and power outputs of the Wingate test. The purpose of this study was to determine if it was more appropriate assignment of the load of the Wingate test according to the lean body mass in young males. MATERIAL AND METHODS Twenty-four healthy and untrained male university students volunteered to take part in this study. They were informed about the test before their consents were obtained. Their heights in bare feed were measured with a tape-measure, and their body weight (BW) and body fat percent were measured with Tanita body impedance meter. Mean (± SD) age, height, body weight and lean body mass was 20.1±1.0 yrs, 173.9±5.9 cm, 65.3±4.6 kg and 56.8±3.6 kg, respectively. The subjects were instructed to avoid food intake two hours before the test, and taking beverages or foods containing caffeine or alcohol and doing exercises on the test day. The Wingate test was performed on a Monark 818E cycle ergometer. Pedal revolutions for every 5-second were counted by an electronic counter with resolutions of 1/12. The order of 75, 85 and 95 g.kg-1 loads for BW and 90, 100 and 110 g.kg-1 loads for LBM was determined randomly. Subjects were taken to the laboratory in convenient clothes with at least a 24-hour interval between the two tests. The tests were carried out at the same hour (1000) of the day in the same order and conditions by the same person. The optimal seat height was adjusted for each subject and the same seat height was used for six tests. The subjects were allowed unloaded pedaling of 5-s to reach maximum cadence and were instructed to maintain maximal pedal speed throughout the 30-s period once the appropriate resistance was applied. The subjects were motivated verbally during the test. Pedal revolutions were recorded for each 5-second. The mean power (MP) performed during 30-second, the highest mechanical peak power (PP) obtained in any 5-second and the fatigue index (FI) determined by subtracting the lowest power output in the 5 second from the highest output and by comparing it with the peak power in percentage were calculated. The results are presented as mean (± SD). The difference between the re-measurements was evaluated with one-way analysis of variance. When there was a difference, Student's t test with Bonferroni correction was applied in order to show which value was different, and the significance level was determined as P < 0.05. RESULTS Peak power values obtained from 100 and 110 g.LBM-1 were significantly higher than PP of 75 g.BW-1 and PP of 110 g.LBM-1 was significantly greater than PP of 90 g.LBM-1. The FI values of 110 g.LBM-1 were greater than FI of 75 g.BW-1 and FI of 95 g.BW-1 was greater than FI of 90 g.LBM-1 (Table 1). None of MP value obtained from the each load were different from the others. DISCUSSION Evans and Quinney (20) developed a formula depending on the body weight and leg volume to determine optimum load in Wingate test. By applying this formula, La Voie et al. (21) found higher PP, MP and FI values. Patton et al. (16) determined that the validity of this formula for the sedentary military personnel was low. This method is not common as it is hard to measure the leg volume. On the other hand, Armstrong et al. (22) showed that skinfold thickness had significant influences on PP and MP. Murphy et al. (19) established that PP and MP in men were 35% and 40% higher than those in the women and these differences decreased to 10% and 17% for PP and MP when expressed relative to LBM. Blimkie et al. (18) found that arm PP and MP values of 50 boys aged 14-19 yrs had relations with lean arm volume and LBM. Van Praagh et al. (23) established relationships between MP and PP and leg volume determined with anthropometric methods in the boys and girls aged 12 yrs. De Ste Croix et al. (9) found that leg muscle volume determined with magnetic resonance imaging in boys and girls aged 12 yrs had positive influence on MP and PP. In Wingate test, not only the leg muscles but also trunk and arm muscles contribute significantly to the power output, so the active muscle mass was assumed to be 60-85% of the total muscle mass (24). We suggest that more accurate results can be obtained when the loads according to the LBM are used because the greater part of LBM is made up of body muscle mass. Consequently, when 100 and 110 g.LBM-1 loads were applied in the present study, PP outputs were higher than those of 75 g.BW-1. Dotan and Bar-Or (15) found that a deviation of ± 0.5 Joule.rev-1.kg BW-1 from optimum affects the MP less than 1.4% and concluded that Wingate test was insensitive to moderate load variations. In our study, differences between the MP outputs of the Wingate tests performed with different loads were not significant and this supports the suggestion mentioned. In the present study, the MP outputs, indicator of anaerobic capacity (25), were not different but differences in PP outputs were important for the athletes involving in throwing, sprint, high jumping, three-step jumping which require maximal anaerobic power (26). In this study the fact that FI in 110 g. LBM-1 was greater than that in 75 g.BW-1 might result from the fact that PP and the load in 110 g.LBM-1 was greater than that in 75 g.BW-1, and FI in 95 g.BW-1 was greater than that in 90 g.LBM-1 may result from the fact that the load in 95 g.BW-1 was greater than that in 90 g.LBM-1. We concluded that assignment of the load of the Wingate test according to the lean body mass would be more appropriate in young males. 100 or 110 g.kg-1 loads for the lean body mass can be used as they result in significantly higher peak power outputs. It is also concluded that further studies should be carried out for the elderly, children and athletes whose body fat percent might be considerably different. REFERENCES
Copyright 2005 - Medical Investigations Society The following images related to this document are available:Photo images[gm05003t1.jpg] |
| |||||||||