 |
| About Bioline | All Journals | Testimonials | Membership | News |
|
||||||
|
||||||
European Journal of General Medicine, Vol. 5, No. 2, 2008, pp. 64-73 Study On Proteomics Expression Profile Of Sera From Patients With Uremia Dai Yong1, Wang Jianqing2, Deng Anguo2, Liu Jian-jun3, He Jian-fan3 Jinan University, Shenzhen People’s Hospital, Second Clinical Medical College, Department of Nephrology1, Shenzhen, Huazhong University of Science and Technology, Union Hospital, Tongji Medical College, Department of Nephrology2, Wuhan, Center for Disease Control and Prevention of Shenzhen, Department of Microorganism Test, Shenzhen3, China. Code Number: gm08013 Aim: To establish and optimize two-dimensional electrophoresis (2DE) and relevant techniques for the study of serum proteome of the patients with uremia, and compare serum protein 2DE pattern between the uremia patients and the normal.
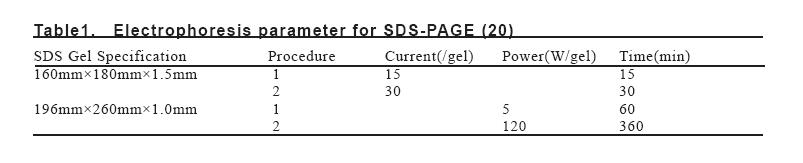
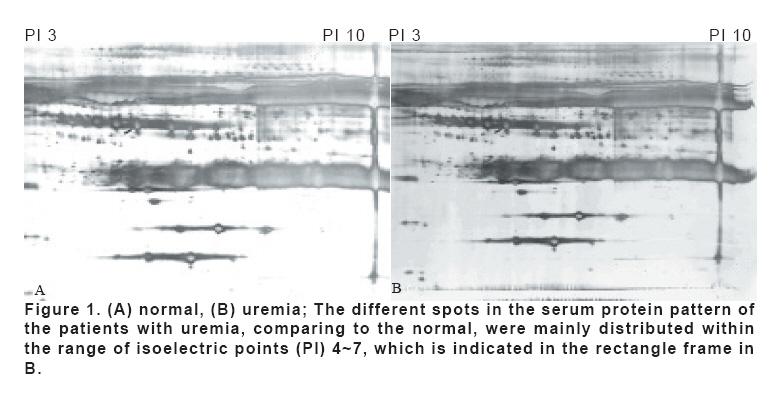
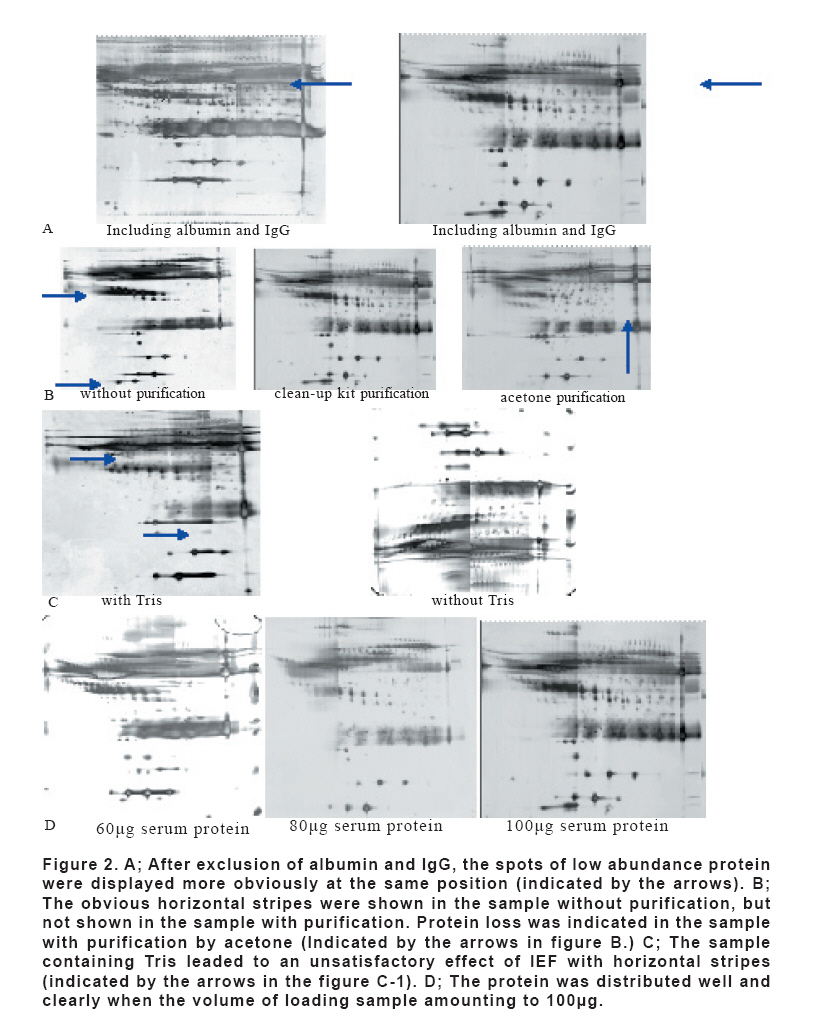
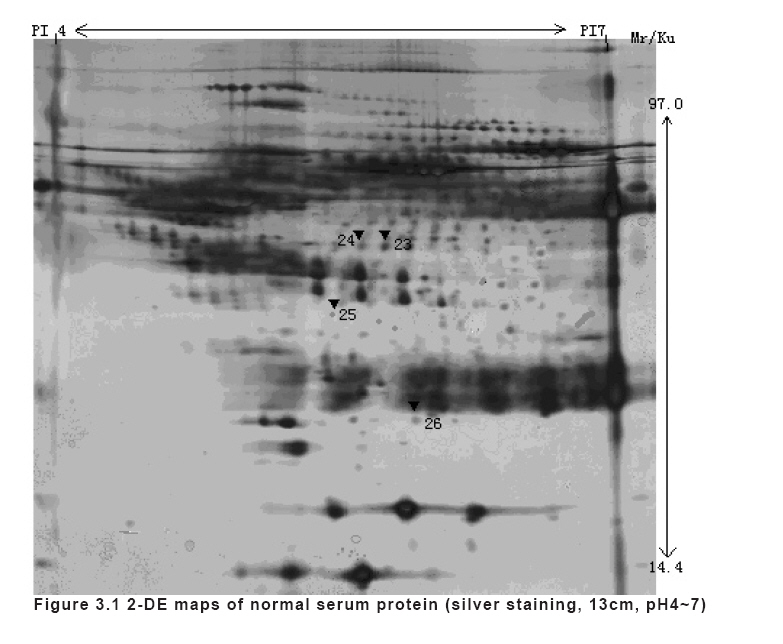
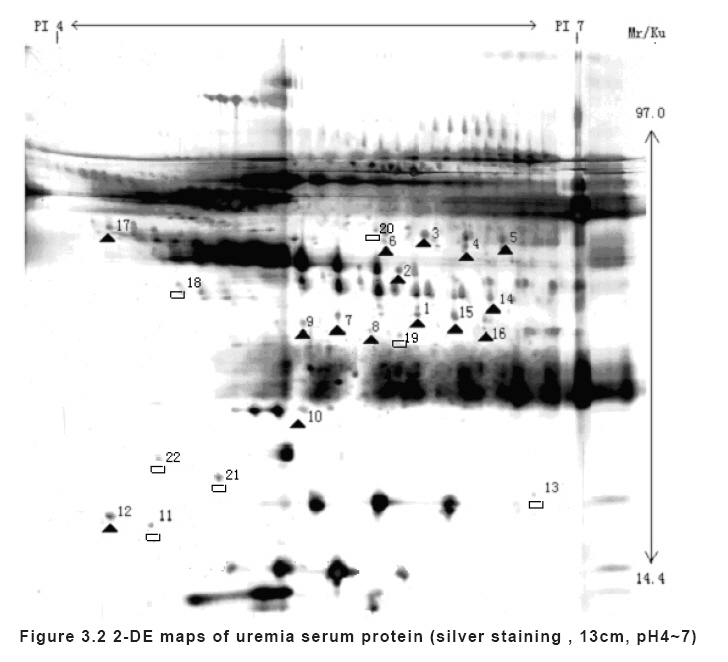
Key words: Uremia, proteome, MALDI-TOF-TOF-MS, two-dimensional gel electrophoresis INTRODUCTION It is shown in recent study that the quantitative or qualitative changes of some proteins in blood plasma, besides molecular peptides, with low or even high molecular weight occur in uremia, due to the blockage of metabolism or clearance, which can result in various pathophysiological changes related to uremia. The finding, of the involvement of ß2-MG into the occurrence of dialysis-related amyloid degeneration, suggested that protein might become a special kind of uremia toxin (1), according to which, some uremia toxins, pertaining to the protein category, were consecutively found and tens kinds of protein toxins have been so far separated and identified. However, the complicated symptoms and complications of the patients with uremia, which are found in different systems, cannot be completely explained only by tens kinds of proteins and other medium or low molecular weight toxins. Considering the extremely limited amount of proteins, previously identified by each study in individual laboratory, the study of uremia protein toxins was thus delayed in the past few years. Given the comparison of the serum protein mass spectrum of the patients with uremia and that of the normal, a preliminary experimental base will be provided for the separation and identification of the proteins with abnormal expression, the relevant experiments in vivo or vitro, and the final determination of uremia protein toxins. Now, the development of proteome provides a good technique platform for searching uremia protein toxins. The technique of 2DE, with most practical value, is thought of the key to the proteome study. The resolution of 2DE is related to the techniques, including protein sample processing, IEF, SDS polyacrylamide gel electrophoresis (SDS-PAGE) and staining. We observed the different proteins expressing between uremia and normal with the methods of optimum the experimental condition of 2DE combining with MALDI-TOF-TOF-MS. MATERIAL AND METHODS Grouping The Uremia Group 10 male patients from Department of Nephrology of Shenzhen People’s Hospital, China were included, with stable condition by conservative treatment, for all of which pathogeny was chronic glomerulonephritis. The range of their ages was 41~60years, 51.3±8.1years on average. The range of their urine output volume was 800~1000ml per day. Written informed consent was obtained from all subjects or their guardians. Use of samples for further studies beyond routine diagnosis was approved by the local ethics committee. This study was also performed according to the guidelines of Chongqing Medical University, which abides by the Helsinki Declaration on ethical principles for medical research involving human subjects. The Control Group 8 men without acute or chronic disease were included, they were normal in physical examination and tests were carried out to guarantee normal kidney and liver function. The range of their ages was 40~60years, 52.8±7.6years on average. Agents:13cm (pH4~7), 13cm (pH3~10L), 24cm IPG (immobilized pH gradient) dry gel strip (pH3~10L), IPG buffer, urea, thiourea, Tris, CHAPS,sodium dodecyl sulfate (SDS), bromophenol blue, 1,4-dithiothreitol (DTT), agarose, glycerin, covering oil 2D; Clean-up Kit and AurumTM Serum Protein Mini Kit, all bought from Amersham Biociences Company; Acrylamide, methylene-bis-acrylamide, ammonium persulfate, glycine, TEMED (from BBI Company), other agents (analytical reagents, made in China), the solution all formulated by Milli Q Water. Main devices: IPGPhor Isoelectrofocusing Electrophoresis Device, SE600 Vertical Gel Units, Ettan DALT Vertical Gel System, Imagescanner High-accuracy Scanner, all bought from Amersham Biociences Company. Solution ingredients Sample dissolving solution: 7M urea, 2M thiourea, 4% CHAPS. IPG swelling solution: urea of 7M, thiourea of 2M, CHAPS of 2%. In advance, the separate addition, of DTT of 7mg, IPG buffer of 0.5% and small amount of bromophenol blue, into the IPG dissolving-expanding liquid of 25ml. Equilibrium liquid: Tris-HCL (PH 8.8) of 50mM, urea of 6M, glycerin of 30%, SDS of 2%, small amount of bromophenol blue. In advance, the separate addition of DTT of 0.1g and IAA of 0.25g into the equilibrium liquid of 10ml. Acrylamide stock solution of 30%: Acrylamide of 30%, methylene-bis-acrylamide of 0.8%, filtered by micro porous membrane of 0.45μm. SDS gel buffer stock solution: Tris-HCL(PH 8.8) of 1.5M, filtered by micro porous membrane of 0.45μm. SDS electrophoresis buffer: Tris of 25mM, glycin of 192mM, SDS of 0.1%. Silver staining solution and stock solution: the formula referred to “Experimental Techniquies of Protein Electrophoress” by Guo Rao-jun (2). Methods Preparation of serum protein sample: The venous blood in fasting was withdrawn and placed at room temperature for 30 minutes, and then was centrifuged by 3000g x 10min. The serum was then collected, 60μl of which was taken for the removal of serum albumin and IgG by AurumTM Serum Protein Mini Kit. Additionally, the purification by 2D clean-up kit or acetone was performed, and then the protein was dissolved by the sample dissolving solution. Lowry Method was taken for quantitative analysis. Gel preparation: The well-distributed 12.5% SDS gel (used for SE600 Vertical Electrophoresis Unit), with the volume of 160mm×180mm×1.5mm, was formulated. The ingredients in each of gel strips include: 30% acrylamide stock solution of 16.68ml, SDS gel buffer stock solution of 10ml, 10� SDS of 0.4ml, 10% ammonium persulfate of 0.25ml, TEMED of 16.5ml and ex-ion water of 17.72ml. The well-distributed 12.5% SDS gel (used for Ettan DALII Vertical Electrophoresis Unit); with the volume of 196mm×250mm×1mm, was formulated. The amount of the ingredients in each of the gel strips is two times of those in the gel strip mentioned above. Isoelectrofocusing Electrophoresis: it was performed in the Center for Disease Control and Prevention of Shenzhen by the technique, which was described by Grog, and others (3,4); the technique also referred to the instruction for isoelectrofocusing system. Dry IPG gel strips were in equilibrium at room temperature for 10 minutes. Certain amount of total protein was mixed into the IPG dissolving-expanding solution, which was then well distributed into the IPG gel-stocking unit, and 250μl and 450μl of which were specifically loaded into the gel strips of 13cm and 24cm, respectively. The gel surface of the strip was placed down into the gel-stocking unit, covered by a layer of mineral oil, and then removed onto the electrode plate of IPGPhor Isoelectrofocusing Electrophoresis Device. The isoelectrofocusing was executed after swelling of the strip. The procedure of isoelectrofocusing as well as swelling was performed at 20, under the condition: 30V, 12h; 500V, 1h; 1000V, 1h; 8000V, until the product of total voltage and time amounted to 40~50kVhrs(13cm gel strip)/80~90kVhrs (24cm gel strip). After the procedure of IEF, the IPG gel strips with the sample was removed into the equilibrium liquid, and was vibrated slowly twice, 15 minutes a time; extra equilibrium liquid was removed by filter papers. 2nd dimensional vertical SDS-PAGE: The IPG gel strip in equilibrium was removed onto the top of the SDS gel, which was sealed by 0.5% agarose. SDS-PAGE was performed in SE600 Vertical Electrophoresis Unit (13cm gel strip) and Ettan DALIi Vertical Electrophoresis Unit (24cm gel strip), respectively, (The parameters of electrophoresis are indicated in Table 1.) until bromophenol blue reached the base line of the gel. Gel staining: The technique of silver staining, indicated in “Experimental Techniques of Protein Electrophoresis” by Guo Rao-jun (2), was executed and also revised to proper extent (5). The fixation of SDS-PAGE gel was completed, for two hours, by the fixation solution containing 25% ethanol and 10% glacial acetic acid. Then sensitization, silver staining, imaging and ending were performed consecutively; after each of these procedures, the treated gel was washed by milli Q water. After staining, using Imagescanner High-accuracy Scanner the transmission scanning of the gel was carried out, with the resolution of 300dpi. The gel was then placed into 1% acetic acid for preservation. Acquisition and analysis of 2DE views The improved protocol of silver staining, compatible with mass spectrum, was introduced into silver staining performance (5). An analysis by ImageMaster 2D 5.0 software was followed by the post-staining transmission scanning by the gel scanner. The examinations of protein spots involved quantification, background deduction, quantitative unification and matching of spots. MALDI-TOF-TOF-MS and database searching It’s performed in Huazhong University of Science and Technology. The protein spots, differentially expressed, were removed and collected, representing satisfactory repetition in the gels from different groups; washed by ex-ion water and decolored through acid ammonium carbonate of 50mmol plus 50% acetonitrile; treated through enzymolysis by pancreatin at 37 and maintained overnight after the gels were dried by pure CAN. The peptide segments were drawn through 0.1% trifluoroacetic acid plus 50% acetonitrile and dried by nitrogen gas. The loading samples were covered by 5mg/ml substrate solution (the solution of 0.1% TFA and 50% acetonitrile) of 0.8ul. After air-dried, the samples were analyzed by peptide mapping fingerprint (PMF) and MALDI-TOF-TOF-MS, which was rectified by the inner markers, including the base peak and the inscribed pancreatin peak. The PMF maps were obtained through searching by GPS software and the search engine MASCOT in IPI human database. RESULTS Using IPG IEF as the 1st dimension and SDS Vertical Electrophoresis System the 2nd dimension, we performed 2DE of the serum proteins of the patients with uremia and the normal, respectively, and observed and established satisfactory 2DE patterns of the proteins. 1. Serum protein pattern by 24cm IPG gel strip (pH 3~10L) with the SDS gel volume of 196mm×260mm×1mm ( see Figure 1.A-B) 2. Serum protein pattern by 13cm IPG gel strip (pH 4~7) with the SDS gel volume of 160mm×80mm×1.5mm, under different condition. 2.1 Influence by high abundance protein(see Figure 2) 2.2 Purification method (Figure 2) 2.3 Sample dissolving solution (Figure 2) 2.4 Difference in the volume of loading protein sample (Figure 2) 3. Establishment and comparison of serum protein pattern under optimized condition between uremia group and the control group (see Figure 3.1, Figure 3.2) The 2DE patterns, in the uremia group and in the control group, were shown in Figure 3.1 and Figure 3.2 (only the identified spots by mass spectrum indicated). In the two groups, the serum protein samples were separated by IPG-2D-PAGE. The analysis on the high-resolution areas suggested that under the same conditions the 2DE patterns, with high-resolution and satisfactory-repetition, were obtained after 2DE performance 3 times in one of the samples; that (305±20) protein spots were identified in the control, including 271 matching protein spots on average, representing the average matching rate of 88.85%; (349±27) protein spots were identified in the uremia group, including 317 matching protein spots on average, representing the average matching rate of 90.83. Variation of proteome expression in the uremia group and in the control group .An analysis by software suggested that the spots, differentially expressed between the two groups, were mainly distributed within the range of isoelectric points 4.5~6.5 as well as molecular weight 97.0~25.0. The protein spots were then identified, commonly in all the subjects of the groups, prior to a comparison between the two groups. The amount of protein expression of 26 spots varied up to more than 4 times in the two groups, among which only 7 spots were identified in the control group; in the uremia group, an increase of more than 4 times was shown in 15 spots in terms of the amount of protein expression, a decrease of more than 4 times was in 4 spots. An analysis by MALDI-TOF-TOF-MS was performed after the enzymolysis of the protein spots in the gels. 16 protein spots were identified by PMF, and 4 spots by PMF and MALDI-TOF-TOF-MS. 6 additional spots failed to be identified because the results with high-reliability could not be obtained due to no satisfactory PMF or searching database. DISCUSSION Blood acts as the location for the exchange and transportation of all the substances in the body. The blood proteins play an important role in diagnosis of diseases, studies of mechanisms, and therapies. The research on blood proteome is now developed greatly by the techniques and approaches with the capacity of high flux analysis. In order to carry out the study of proteome, it is firstly required that according to the complicated system of proteome the 2DE technological system, characterized by high sensitiveness, resolution and accuracy as well as satisfactory repetition, is established for simultaneous separation of thousands, or even tens of thousands, kinds of proteins (6). In the study, using the serum proteins of the ESRD patients and the normal as the samples, Immobiline pH gradients (IPG) IEF as the 1st dimension and Vertical SDS-PAGE as the 2nd dimension, we established and optimized the study and experimental condition, for the factors including the preparation of serum protein sample, the technique of loading sample, the influence of the loading amount on electrophoresis, IEF electrophoresis, the procedures and parameters of IEF and SDS-PAGE and the methods of staining the gels, and obtained satisfactory 2DE patterns of the serum proteins. The desirable patterns, established by the optimized procedures, are shown in Figure 3.1 and Figure 3.2. Abundant proteins are contained in serum. In the study, we firstly observed the distribution maps of serum proteins, of the uremia patients and the normal, using 24cm (pH 3~10L) IPG gel strip, and found that the ingredients of serum proteins were complicated and distributed widely within PI 3~10. The preliminary analysis, by ImageMaster 2D 5.0 Gel Analysis Software, leaded to the finding that the proteins, differentially expressed in the uremia patients comparing to the normal, were mainly distributed within pH 4~7 (indicated by the rectangle frame in Figure 1.1 and 1.2). Therefore, the application of 13cm (pH 4~7)IPG gel strip was involved into the following study, in order that the more visible distribution map of the proteins, differentially expressed in the uremia patients, would be obtained. Sample preparation or pretreatment has become a bottleneck in the study of proteome, so we took the following procedures of sample processing, in order to obtain satisfactory 2DE patterns: Among abundant proteins contained in serum, most are categorized into a few kinds of high abundance proteins including albumin and immune globulin, which would extremely influence on the assay of dominant kinds of low abundance proteins without any treatment (6). (2) Besides abundant proteins, many low molecular weight substances, including salts and carbohydrates, are contained in the samples; these substances are thought of impurities that result in an influence on IEF and an increase in electroendoosmosis of the samples, which therefore explains to a difficulty in the provision of enough voltage required by IEF, then the prolonged IEF time and an extreme influence on the 2DE patterns (7). Among many techniques of slats exclusion, the selected 2D clean-up kit and acetone were used for the precipitation and purification of the samples. We took IPG IEF as the 1st dimension, because of its high resolution, and desirable repetition of IPF preparation gel strips, convenience in the procedure and simultaneous performance of 12 gel strips once, which facilitated the comparison study of proteome. We performed the comparison study on the different procedures of IEF electrophoresis as well as IEF time in this experiment, which came to the optimized conditions of electrophoresis (shown in Table 1). 2nd Dimension SDS-PAGE and staining The vertical SDS-PAGE was taken as the 2nd dimension, in which multi-gels could be performed simultaneously. In particular, 12 gels of 24cm were allowed to work simultaneously in Ettan DALII Vertical Electrophoresis Unit, which leaded to high resolution and thus facilitated the comparison study of proteome; which also contributed to an increase of the volume of the loading samples and thus made sure that the amount of proteins, left after electrophoresis, was enough for the further analysis. It was revealed in analysis by the software that an increase of more than 2 times of the amount of protein expression was indicated in a large number of protein spots in the two groups. This study involved the identification of 26 protein spots with an increase of more than 4 times of the amount of protein expression. Some kinds of the identified proteins by mass spectrum should be noted: 1. Proteins related to neurological changes (1) SET protein: An inhibitor of Phosphatase 2A, with multiple functions, involved into apoptosis, transcription and nuclesome assembly. Some studies showed that neural degeneration diseases were related to Phosphatase 2A. In this study the expression of SET protein of the patients with uremia declined remarkably and the activity of the phosphatase was then stimulated, which therefore might play a corresponding effect in neurological changes induced by uremia (8). Transthyretin: A thyroxine-binding globulin. For the patients with uremia its amount in serum was increased, which is related to a reduced clearance of retinol-binding protein from renal tubule (9). Sousa found that the abnormal expression of transthyretin might result in neurological changes (10). 2. Proteins related to amyloid degeneration: It is well known now that ß2-MG pertains to uremia protein toxin and is involved in amyloid degeneration, the amount of which is notably increased in the patients with uremia. An obviously increase in the production of amyloid fibril protein, a protein closely related to amyloid degeneration, was indicated in this study. But it is still unclear if it has the induced effect on amyloid degeneration as ß2-MG do. In addition, Sousa (10) suggested that transthyretin was involved in, besides neurological changes, amyloid degeneration. 3. Proteins related to dermatosis: U3snoRPN protein pertains to nucleoprotein. It acts as an immunogen, resulting in the production of corresponding antibodies, in scleroderma. It leads to an excessive expression of the collagen in fibroblast and thus an occurrence of dermatosis. A greatly enhanced expression of U3snoRPN protein was shown in the uremia group in this study, but its effects on the body are still unknown. 4. Proteins related to immun deficiency and infection: (1) lymphoid limitation membrane protein: it is expressed in lymphocytes and is related to immunological function of the body (11). A significant upgrade of its expression was indicated in serum in the patients with uremia, which might be related to their immun deficiency. (2) HSPC123: A protein that was identified recently. According to Sukotjol, HSPC123 was related to immunity deficiency and a susceptibility to infection (12). (3) Peptidyl-prolyl cis-trans isomerase: It pertains to foldase and helps regulate the balance of protein folding and accumulating and enhance the folding renaturation of proteins in vitro (13). Some study showed that Peptidyl-prolyl cis-trans isomerase was an immunosuppressive conjugated protein. This study revealed the production, for the first time, of such protein. It was supposed that its enhanced expression could inhibit immunological function of the body. 5. Proteins related to apoptosis (1) Rho GDP dissociation inhibitor: It pertains to G-protein regulatory protein and links to GDP in Rho small G-protein and thus inhibits the activation of Rho small G-protein. It was shown in study that Rho protein was related to apoptosis and induced the activation of Ca2+ and protein kinase C. Additionally Rho sub-family may be involved in lymphocyte polarization and antigen presenting. Some signaling proteins contribute to the connection, by SH-3 function area, of the tyrosine kinase pathway and some pathways controlled by small G-protein, which consequently influences on cellular shape (14). (2) Some data suggested that RNA binding motif protein 4 and WD protein IR10 were also involved in apoptosis (15). It has been clear that abnormal apoptosis occurs in the lymphocytes of the patents with uremia, in which the abnormal expression of the above proteins is probably involved. In addition, some of other identified proteins in this study, including MAP3K14, LOC129285, PRO2004, KIAA1627 protein, have been found in recent two years, which specific functions are not reported till now. Through an analysis by the software, this study suggested a large number of proteins indicated a differential expression in the uremia group, but only the protein spots, with the expression variation up to more than 4 times, were involved in the identification by mass spectrum. Because of this or being covered by high-abundance proteins, some given uremia protein toxin, related to uremia, therefore failed to be identified. In this study the assay technique of proteome was utilized for the identification of the differential proteins in serum, in the patients with uremia and in the normal, which provided useful data for the establishment of the reference map of uremia serum proteome and the enlargement of the database. REFERENCES
Copyright 2008 - Medical Investigations Society The following images related to this document are available:Photo images[gm08013f3b.jpg] [gm08013f1.jpg] [gm08013f3a.jpg] [gm08013f2.jpg] [gm08013t2.jpg] [gm08013t3.jpg] [gm08013f3c.jpg] [gm08013t1.jpg] |
| |||||||||