 |
| About Bioline | All Journals | Testimonials | Membership | News |
|
||||||
|
||||||
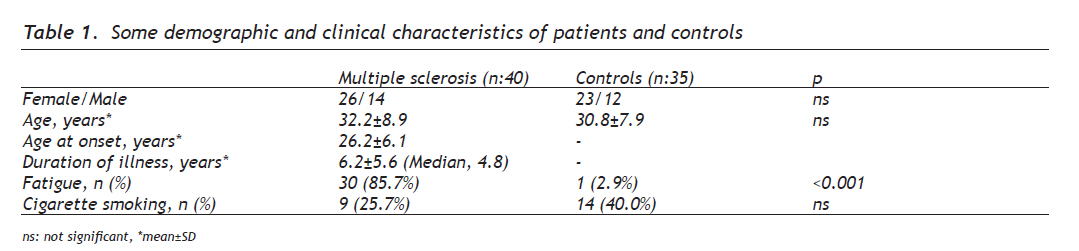
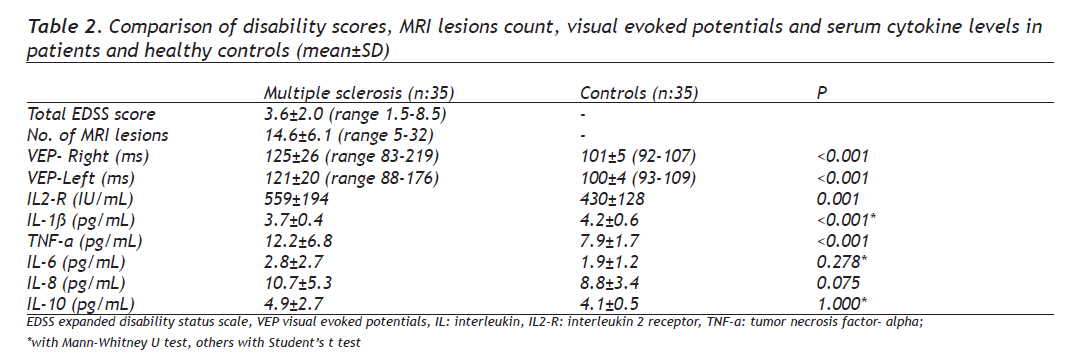
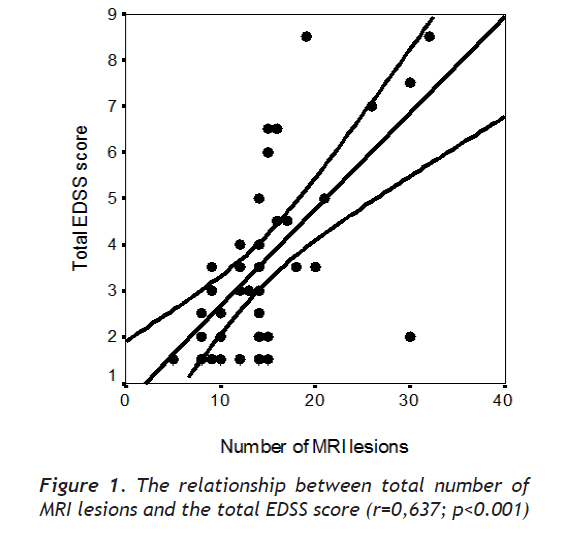
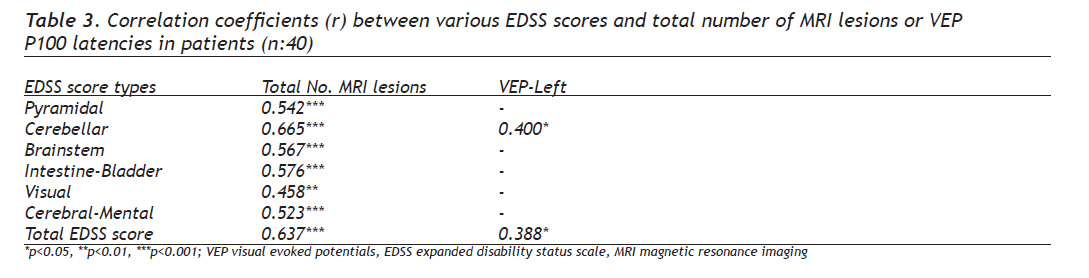
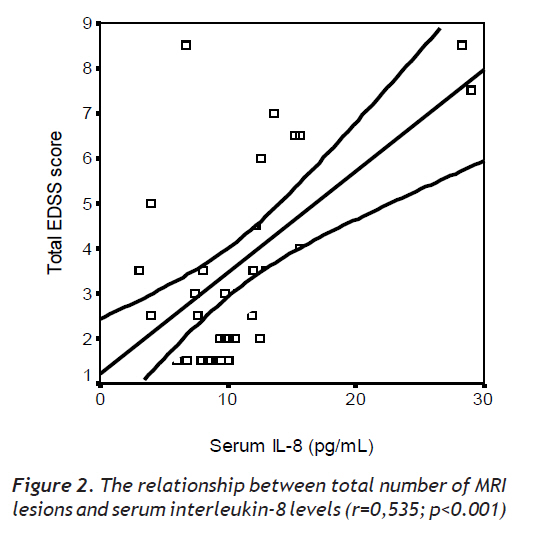
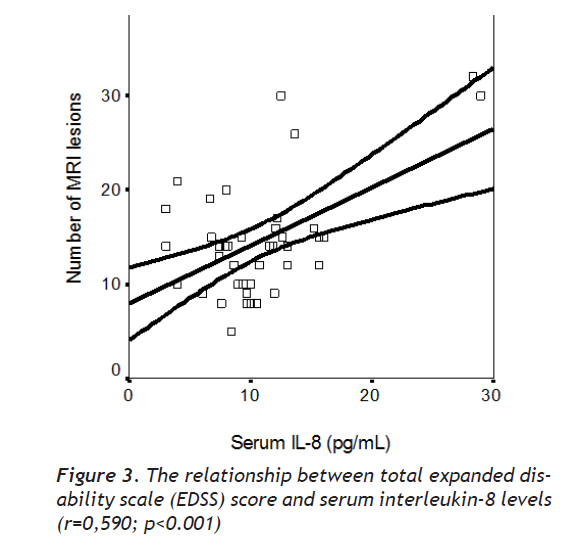
European Journal of General Medicine, Vol. 7, No. 2, April-June, 2010, pp. 167-173 Original Article Multiple Sclerosis: Relationships Between Cytokines, MRI Lesion Burden, Visual Evoked Potentials and Disability Scores Multipl skleroz: Sitokinler, MR lezyon yükü, görsel uyarılmış potensiyeller ve sakatlık puanları arasındaki ilişkiler Nebahat Taşdemir1, Erdal Eren Karaca1, Aydın Ece2, Yavuz Yücel1, Süber Dikici3, Mehmet Serhan Taşdemir4 Dicle University, Medical School, Departments of Neurology1, Pediatrics2 and Histology4, Diyarbakır, 3State Hospital, Department of Neurology, Diyarbakır, Turkey Received: 15.06.2009 Accepted: 29.12.2009 Correspondence: Prof. Dr. Nebahat Taşdemir, Dicle University Hospital, Department of Neurology 21100-Diyarbakır-Turkey, Telephone: +90412248 80 01 Fax: +90412248 80 74 E-mail: nebahat@dicle.edu.tr Code Number: gm10032 ABSTRACT Aim: The aim of this study was to investigate the relationships between the disability (EDSS) scores, magnetic resonance imaging (MRI) lesion burden, the visual evoked potential (VEP) latencies and the cytokine levels in patients with multiple sclerosis (MS) that previously not studied. Key words: Multiple sclerosis, cytokines, disability, MRI, visual evoked potentials Amaç: Bu çalışmanın amacı multipl sklerozlu (MS) hastalarda sakatlık puanları (EDSS), magnetik rezonans görüntülemedeki (MRI) lezyon yükü, görsel uyarılmış potansiyel (VEP) gecikmeleri ve sitokin düzeyleri ilişkisini incelemektir. Anahtar kelimeler: Multipl skleroz, sitokinler, sakatlık, MR, uyarılmış görsel potansiyeller INTRODUCTION Multiple sclerosis (MS) is an autoimmune-mediated disease of the central nervous system (CNS). Electrophysiological and imaging studies are used in clinical practice to diagnose and follow-up MS by demonstrating demyelinating lesions (1). Various studies investigating relationships between the evoked potential latencies and the disability scores in MS gave opposite results. Some studies demonstrated that the expanded disability status scale (EDSS) scores increased parallel to delays in visual evoked potentials (VEP) (2,3), however others found no correlation between disability scores and change in the VEP latencies (4, 5). Magnetic resonance imaging (MRI) often demonstrates new lesions independent of clinical status (6). Measurements of both the evoked potential latencies and the plaque burden on MRI scans often provide additional information to the disability-based primary evaluations (7). If these laboratory studies correlated well with the clinical severity of MS, a more complete assessment of treatment efficacy could be achieved. One of the determinants in MS is thought to be the release of cytokines by T cells (8). An imbalance between T helper (Th) 1 and Th2 lymphocytes is thought to be one of the hallmarks in MS. T helper 1 cells produce pro-inflammatory cytokines such as IFN-γ, TNF-а and IL-2 and Th2 cells produce anti-inflammatory cytokines such as IL-4 and IL-10 (9). Although the EDSS, VEP and the MRI findings were previously investigated (1,7,10,11), we could not find any study investigating these three variables together with cytokine profile in MS. Thus this is the first report to investigate these three parameters together with simultaneous cytokine levels. The aim of this study was to investigate relationships between the VEP P100 latencies, disability scores, brain MRI lesions and cytokine levels in clinically inactive phase of MS. MATERIALS AND METHODS Patients A total of 45 patients with definite MS were enrolled and prospectively evaluated throughout six months. Thirty-five age and sex-matched healthy subjects were recruited as control group. All subjects gave informed consent to participate in the study. Demographic characteristics (gender and age), clinical (onset characteristics, disease duration, disability scale score) and paraclinical characteristics, cerebrospinal fluid (CSF), visual evoked potentials and MRI findings were recorded. The inclusion criteria were: 1) Clinically definite MS according to McDonald’s criteria (12) that followed a relapsing-remitting course (with at least two relapses and incomplete remission in the last 2 years, 29 patients), or a secondary progressive course (11 patients), an MRI scan of the brain during last 6 months consisted with diagnosis of MS (at least three lesions, at least 2 mm in diameter, or two lesions, one of which had to be located in the periventricular area, and the other had to have a diameter of at least 5 mm), at least one gadolinium, enhancing lesion on brain MRI obtained within the last four months, 2) without active disease e.g. showing no deterioration of any point on Kurtzke’s EDSS score (3) at the enrollment. Exclusion criteria were; 1) Moderate or severe diseases other than MS, such as compressive spinal cord lesions, vascular malformations, systemic vasculitidis affecting CNS, antiphospholipid syndrome, subacute combined degeneration, amyotrophic lateral sclerosis, adrenomyeloneuropathy, neurosyphilis, neuro AIDS, neurosarcoidosis and paraneoplastic syndromes, 2) Inability undergo MRI scanning or laboratory investigations, 3) Receiving steroids or immune suppressive drugs. Five patients were excluded due to primary progressive course and/ or treatment with immunosuppressive drugs, thus data belonging to remaining 40 patients (29 relapsing-remitting MS, 11 secondary progressive MS) were analyzed. The VEPs and serum levels of cytokines, including interleukin1-beta (IL-1ß), interleukin 2-receptor (IL2-R), tumor necrosis factor-alpha (TNF-а), IL-6, IL-8 and IL-10 were measured in a clinical case-control study. Neurological examination was assessed using the EDDS score (3) and MRI scans at the time of study entry. The same neurologist assessed disability based on the Kurtzke’s EDSS (3). Thirteen of our patients received glatiramer acetate, 17 interferon-1 beta and 10 of them received no medication for MS management. Radiological studies Magnetic resonance imaging of the brain was performed on a Siemens Magneton Expert (Magneton Expert, Siemens, Germany) operating at 1.0 Tesla. Five-mm axial slices were obtained repositioning based on standardized anatomic landmarks, proton density and T2-weighted fast spin-echo sequence before contrast, axial T1-weighted spin-echo sequence after injection of gadolinium (obtained 10 min after intravenous gadolinium-DTPA). Scans were analyzed by the same blinded radiologist. The numbers of hyper-intense lesions at T2-weigthed scans and the number of enhancing lesions at T1-weighed scans were counted. Visual evoked potentials (VEPs) The VEPs were recorded from an active electrode placed 3 cm above Oz and a reference electrode at F2 with a Neuropack (Nihon Kohden, Tokyo, Japan). The stimulus rate was 2 Hz, sweep speed was 200 ms, and 200 repetitions were averaged. The amplitude and latency of the major positive component (P100) were measured in all subjects. Each patient provided two data points (left and right) for each VEP time point. Responses were considered delayed when the latency of the P100 was more than 110 ms. A single blinded neurologist read all VEPs. Cytokines Cytokines were measured by two-site sequential chemiluminescent immunometric assay at the day as the MRI scans (Immulite, EURO/DPC Ltd, UK). The intra-assay coefficient of variation was 5.7-6.6% (n=8) at 6.8 pg/ml and 3.1-4.4% (n=8) at 21.12 pg/ml. Statistical analysis The values were expressed as meanstandard deviation. Comparison between MS and control groups were done by Student’s t test or Mann-Whitney U test based on the distribution pattern of the data. Differences in categorical variables were determined by 2- test. The correlations between various variables were estimated by Pearson’s or Spearman’s correlation analyses according to whether the data normally distributed or not. All statistical analyses were performed using the Statistical Package for Social Sciences (SPPS Inc., Ill, version 12.0 for Windows. Statistical significance was defined as a P value less than 0.05. RESULTS The mean age of the patients at the onset of MS was 26.2 years (range, 14.0-37.0) and the mean disease duration at study entry was 6.2 years (Median, 4.7; range, 1.0-20.0) (Table 1). The female/male ratio and the mean ages of the patients and the controls were similar (P>0.05) (Table 1). Although the frequency of fatigue was significantly higher in MS group compared with control group (P<0.001), the frequency of cigarette smoking was similar in patients and healthy controls (p>0.05) (Table 1). Although the mean serum levels of IL-6, IL-8 and IL-10 were found to be similar in MS patients and the controls (p>0.05); serum levels of IL2-R, IL-1ß and TNF-а were significantly higher in MS patients compared with control subjects (p<0.05) (Table 2). There were no significant differences in cytokine levels between male and female patients (data not shown) (p>0.05). In the total patient group of our study, the EDSS score varied from 1.5 to 8.5 with a mean of 3.6. About 17.1% (6 patients) were severely impaired, as expressed through EDSS score ≥6.0. All 40 had abnormal T2 plaque burden and the mean total MRI lesion count was 14.6 (range, 5-32) (Table 2). The mean right VEP P100 latency was 125 (range, 83-219) and the mean left VEP P100 latency was 121 (range, 88-176) in MS patients. Twenty-six of the 40 patients (65.0%) had delayed VEP P100 latencies (20 bilateral, 10 unilateral). Both the mean right and left VEP P100 latencies of MS patients were significantly longer than those of healthy controls (p<0.001) (Table 2). Correlations We investigated relationships of the entry disability scores with the VEP P100 latencies and MRI T2 plaque burdens. The number of T2-weighted total MRI lesion count significantly correlated with the total EDSS score (r=0.637, p<0.001) (Figure 1). Total MRI lesion count also significantly correlated with pyramidal, cerebellar, brainstem, intestinal-bladder, visual and cerebral-mental EDSS scores (p<0.05) (Table 3). Significant correlation was also found between the left eye VEP P100 latency and the total EDSS score (p<0.05) (Table 3). However, no correlations were found between MRI lesion count and the VEP P100 latencies (p>0.05). There were significant correlations between IL-8 and the total EDSS score (r=0.590, p<0.001) (Figure 2) and the total MRI lesion burden (r=0.535, p<0.001) (Figure 3). The serum TNF-а (r=0.341, P=0.032) and IL-2R (r=0.342, P=0.031) levels were significantly correlated with the disease duration. No correlation were found between other cytokines (IL-6, IL-1ß and IL-10) and total EDSS scores, total MRI T2 lesion burden or the VEPs latencies (data nor shown) (p>0.05). Relapsing-remitting MS vs. secondary progressive MS While MS patients were divided into two subgroups based on clinical MS course as relapsing-remitting MS (RRMS, n:27) and secondary- progressive MS (SPMS, n:8); it was foun that patients with SPMS had higher mean total EDSS score (6.4±1.6 vs. 2.3±0.8, respectively, P<0.001) and mean total MRI lesion count (20±6 vs. 13±5, respectively, P<0.001) compared with RRMS patients. There were no significant differences in cytokine levels and the VEPs latencies between RRMS and SPMS patients (data not shown) (p>0.05). DISCUSSION Multiple sclerosis is a chronic demyelinating disease of the CNS that supposed to be the result of chronic autoimmune reactions directed against mainly myelin (13). Cytokines are critical components of the immune inflammatory process and are implicated in oligodendrocyte cell death, axonal degeneration and neuronal dysfunction which are the main characteristics of MS pathology (14). In this study we found higher serum levels of TNF-а and IL2-R, and similar IL-6, IL-8 and IL-10 levels in MS patients compared with healthy controls (Table 2). MS is postulated to be a Th1 type cell-mediated autoimmune disease. Some pro-inflammatory cytokines such as IL-1, TNF-а, IL-2, IFN-γ are believed to contribute to the tissue injury in MS, while anti-inflammatory cytokines produced by Th2 cells (IL-4, IL-10) have been shown to down regulate the immune response (13, 14). It has been reported that increased levels of TNF-а were associated with the clinical activity in RRMS and the development of chronic progressive disease (15). Despite clinically inactive disease and immunomodulator therapy, higher TNF-а, IL-1ß and IL2-R of our patients suggested a continuous subclinical immune activity that could not be suppressed by treatment. Similar IL-10 levels in our patient and control groups also pointed out that these patients were not in full remission, since increased levels of IL-10 have been reported during remission phases of MS patients (16). Although, increased IL-6 production has been reported in relapse MS patients compared with in remission or control subjects (17), similarity of IL-6 and IL-8 levels of our patients and controls and even lower IL-1ß levels of MS patients may be due to the differential effects of immunomodulator therapy. It is possible that immunomodulator medication may be effective on different cytokine productions with distinct strength. Our results showed no difference between cytokine levels of male and female patients similar to results of Eikelenboom et al. (8). Unilaterally or, more frequently, bilaterally prolonged VEP P100 latencies were present in 65.0% of our patients, which was similar to results of previous studies (1,4,5). Evoked potentials are frequently used to confirm the diagnosis of MS. Measurement of VEP is the recording of the pattern reversal visual evoked potential and is used to evaluate nerve conduction which is often abnormal in MS (11). In this study, MS patients had significantly increased VEP P100 latencies compared with healthy controls. Magnetic resonance imaging has been suggested as a sensitive measure of the pathological processes in MS that plays a pivotal role in the diagnosis of MS and is being increasingly used as a paraclinical measure (18). Serial MRI studies have shown that asymptomatic disease activity occurs as evidenced by a much higher number of active lesions as revealed by MRI scans than clinical relapses (19). None of our patients had normal brain MRI. Normal brain MRI findings were suggested to be unusual in MS patients, so that nearly 90% of patients with MS have abnormal MRI scans (20,21). Currently MRI is superior to all other clinical and paraclinical tests for assessing disease activity in MS. Conventional MRI (T2-weighted and gadolinium-enhanced T1-weighted images) is currently used as the single most sensitive test for MS (20,22) and it also allows the exclusion of possible differential diagnoses. The change in the total lesion load, observed serially using T2-weighted MRI, is commonly used for monitoring disease progression. However the clinical significance of this measurement is not clear because T2 lesion load shows only a weak correlation with clinical disability scores (20). We found significant correlations between number of T2 lesions and total EDSS score (p<0.001) in our patient group. Previously, a more strong correlation was established between the extent of T1 lesions and the EDSS score, but only in patients with secondary progressive course (23). However, it has been reported that, the correlation between T2-lesion load and disability becomes modest while the diagnosis of MS has been established for over 5 years (24,25). The median disease duration of 4.75 years in our patients may explain the correlation between MRI lesion burden and the EDSS scores. Both MRI and evoked potantials provide valuable information that can not be obtained by clinical evaluation, especially for assessing disease activity (20,26). While evoked potentials can test the function of only a very limited number of central tracts, MRI examines the whole cerebrum at once (18). Despite, significant correlations of total EDSS score with the T2 lesion number in our study, we found no correlation between T2 plaque number and VEP P100 latencies (p>0.05). Fuhr et al. also found no correlation between VEPs and MRI T2 plaque burden (27). In conclusion, in this study we investigated cytokine levels, MRI T2 lesion burden, EDSS scores and VEP latencies in clinically inactive phase MS patients. We found increased serum TNF-а and IL2-R levels and similar IL-6 and IL-10 levels in MS patients compared with healthy controls. Significant relationships were found between IL-8 and disability scores, and between IL-8 and T2 lesion burden. Total EDSS score was significantly correlated with the MRI lesion count and the VEP P100 latencies. Our data indicate that the production of the different pro-inflammatory cytokines were not uniformly affected by the immunomodulator medication. New therapeutic strategies correcting cytokine balance may be useful in the treatment of MS patients. Further studies with more patients in their active phases are needed in order to verify relationships of cytokine levels with MRI lesions or VEP latencies in MS. Acknowledgements: We thank to Dr. Fuat Gürkan, M.D. for his contribution in editing the manuscript. REFERENCES
Copyright 2010 - European Journal of General Medicine The following images related to this document are available:Photo images[gm10032t3.jpg] [gm10032f1.jpg] [gm10032t2.jpg] [gm10032f2.jpg] [gm10032t1.jpg] [gm10032f3.jpg] |
| |||||||||