 |
| About Bioline | All Journals | Testimonials | Membership | News |
|
||||||
|
||||||
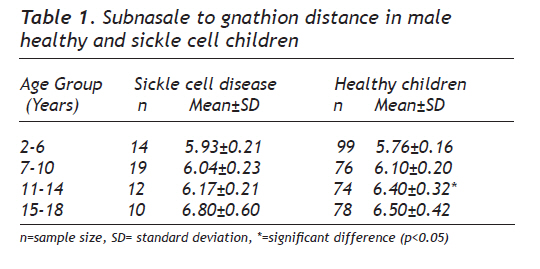
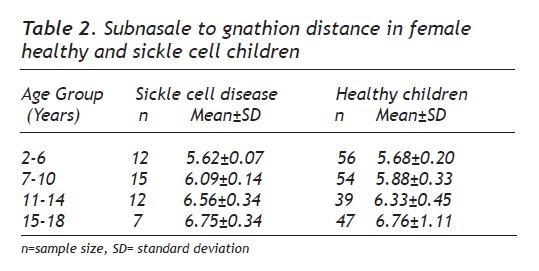
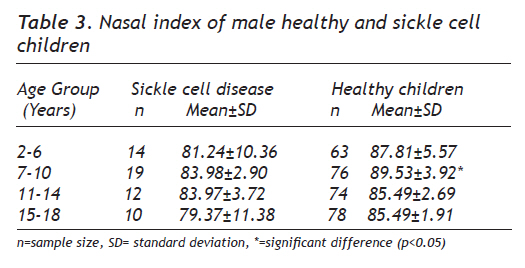
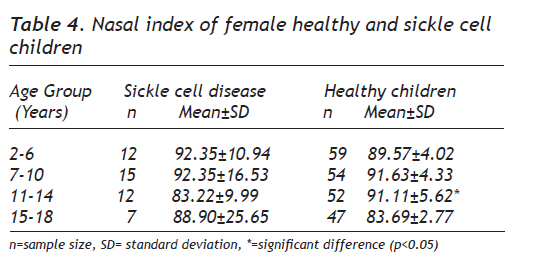
European Journal of General Medicine, Vol. 7, No. 2, April-June, 2010, pp. 197-202 Original Article Subnasale to Gnathion Distance and Nasal Index of Children with Homozygous Sickle Cell Disease in Port-Harcourt Hakeem Babatunde Fawehinmi1, Aloysius Ebi Ligha2 1University of Port-Harcourt, College of Health Sciences, Department of anatomy, Port-Harcourt, Nigeria. Correspondence: Dr. Ligha A.E, Department of Anatomy, College of Heath Sciences, Niger Delta University, Wilberforce Island, Bayelsa State, Nigeria. Phone: +2347063565026, E-mail:docligha@yahoo.com Received: 28.07.2009 Accepted: 26.01.2010 Code Number: gm10036 ABSTRACT Aim: This study is designed to determine changes in some of craniofacial parameters such as subnasale to gnathion distance and nasal index in sickle cell anaemia in comparison to the healthy children in Port-Harcourt. Key words: Normal growth, Sickle cell disease, subnasale to gnathion distance, nasal index. INTRODUCTION Sickle cell disease is caused by the inheritance of homozygous haemoglobin S (HbSS) or the compound heterozygosity for HbS and HbC (HbSC) or a beta thalassemia. Only homozygous (HbSS) inheritance of the gene is associated with most severe manifestation while heterozygous (HbAS) individuals or carriers of the trait show no apparent ill effects except under stressful conditions, but show an increased resistance to certain types of malaria. This selective advantage results in a higher occurrence of sickle cell anaemia in regions of malarial endemicity such as tropical Africa, India and the Mediterranean (1). The disease if left untreated usually results in death in childhood or early adulthood. Deoxygenated HbS red blood cells become distorted, more fragile and sickle-shaped and becomes harder and sticky. In many tropical African Countries including Nigeria, Sickle Cell Anaemia is a public health problem affecting 2% of all newborn babies. The prevalence of the disease in the United States is approximately 1 in 5,000, mostly affecting Americans of Sub-Saharan African descent (National Institutes of Health). Sickle cell trait is said to occur in 8% of black population in the United States (2). It is estimated that sickle cell anaemia is directly or indirectly responsible for 8 – 10 % of early childhood mortality in much of tropical Africa. Life expectancy is shortened, with studies reporting an average life expectancy of 42 and 48 years for males and females, respectively (3). It is a genetic disorder that results from a point mutation that changes the amino acid at position 6 of the B-globulin chain of the haemoglobin from glutamic acid to valine (4). The study of normal, abnormal growth and development of children has become an important part of practice (5). It has been reported that sickle cell anaemia produces stunted growth which usually begins in the second half of the first decade of life and that affected children present with subnormal weight and height for age measured values (6). Morphometric parameters such as head, chest and mid-thigh circumference are also useful in evaluating the effect of chronic multi-system diseases such as sickle cell anaemia on the growth pattern of children (7). Most of the physical signs of sickle cell anaemia are as a result of chronic haemolytic anaemia complicated by intercurrent infections resulting to sickle cell crises. Bone deformities such as kyphosis, scoliosis, saber shin and tower shaped skull may be encountered with abnormal roentgeno-graphic appearance such changes are more frequent in adolescents and adults than in children. Anthropologists developed racial classification based on skull shape and other observable craniofacial skeletal differences such as breadth of nasal aperture, nasal root height, head shape, sagittal crest appearance, jaw thickness, brow ridge size, forehead slope etc. In a holistic anthropological approach, other observable physical characteristics that can be used include nasal shape, eye colour, skin colour, lip shape and hair type. The purpose of the present article is to measure the subnasale to gnathion distance and the nasal index in homogenous sickle cell children and to compare these values with those in healthy normal Port-Harcourt children. MATERIALS AND METHODS Population Ethical clearance was sort and obtained from the relevant departments and units of the University of Port-Harcourt (UPTH) and other professionals involved in the management of sickle cell anaemia children. Most often, the measurements were carried out in the sickle cell clinic, paediatric ward or in a class room not in session. Craniofacial Anthropometric Measurements were taken from a total of 600 subjects aged 3-18 years in a longitudinal study that spanned 3 year (2004 to 2007). The Subjects were made up of 100 children who have been diagnosed as homozygous for Sickle Cell Anaemia by the Haematology, Immunology and Blood Transfusion Department of UPTH and who attend the Sickle Cell Clinic and 500 normal growing children who are pupils of the University Kindergarten, Demonstration Primary and Secondary Schools as well as First International Academy Secondary School, Rumuokoro, Port Harcourt. Children with craniofacial malformations or a history or signs of craniofacial syndromes were excluded from the study. The biodata of the children which include their names, sex, age, and fathers’ occupation (to determine socioeconomic status) was obtained and recorded from the school and hospital register and by direct oral questioning of their parents. The measuring techniques followed internationally accepted standards in anthropometry and were taken to the nearest 0.01 cm. Measurements (a.) Measurement of the subnasale-to-gnathion distance was carried out using a sliding caliper by using method previously described by Farkas and Lindsay (8). The subnasale (sn) is a frequently used reference point that is located at the junction of the columella and the upper lip while the gnathion (gn) is the most inferior midline point on the mandible, located where a line tangent to the pogonion intersects a line tangent to the mention. (b)The nasal measurements were also taken using a sliding caliper using method previously described by Farkas and Lindsay (8). To determine the nasal length, measurement was taken of the distance from a point approximately one-half centimeters above the area that is in the centre between the eyes or the point of intersection between the frontonasal suture and the midsagittal plane (nasion) to the point where the nasal septum merges with the skin of the upper lip (nasospinale). This is also called the nasion (n) – nasospinale (ns) height. The nasospinale is also the point where a line drawn between the inferior most points of the nasal (piriform) aperture crosses the midsagittal plane. This point is not necessarily located at the tip of the nasal spine. The maximum breadth of the nose was measured at a right angle to the nasal height from alare (al) to alare (al). The nose breadth is the distance between the two most lateral points on the wings of the nostrils. These measurements are taken in the absence of any form of facial expression which can alter the size and position of the nose. The nasal index was calculated using the formula: maximum breadth of the nose/ maximum length of nose x 100 Parallax was avoided in the visual read out of the values. To reduce inter-observer error an attempt was made for a particular research assistant to take the majority of measurement of a particular index even though each is able to do the task of the others. Statistical Analysis All data were analyzed statistically and separately for different ages and sex and their mean values obtained with standard deviation of mean and compared with normal growing children in Port Harcourt. RESULTS Tables 1, 2, 3 and 4 give the mean ± SD values of subnasale to gnathion distance and nasal index in both normal and sickle cell disease patients. All measurements were aged related (P < 0.05). On the average, no significant difference was found between the two sexes for the measurements. The mean subnasale to gnathion distance for the males varied from 6.19 cm for the normal group to 6.24 cm for the sickle cell disease group while that of the females varies from 6.16cm for the normal group to 6.26cm in the sickle cell disease group. Although average values for the subnasale to gnathion distance for the sickle disease groups in both sexes were higher in comparison to the normal growing children, there was no statistical significant difference in the overall average (P > 0.05). However, the subnasale to gnathion distance in the male, age group 11-14 showed a significant difference as in table 1. The mean nasal index of the sickle cell disease groups i.e., for males and females revealed a value of 85.67 as against 88.04 of normal growing children. The nasal index of male normal growing children in comparison to the male sickle cell disease children in age group 7-10 revealed a statistical significant difference as shown in table 3 while in the females, statistical difference was noted in age group 11-14 as shown in table 4. DISCUSSION Childhood and adolescence represent a rapid growth period in life and studies abound on the parameters of measuring growth and its relationship with wellbeing. Sickle cell disease affects growth due to its chronic effects on bones. This study which determines these effects on some of the bones of the face, correlate with reports of previous authors. (5, 7, 9-14). These parameters are quite useful in monitoring growth and wellbeing and are said to be affected in systemic diseases such as sickle aneamia. Sickle cell anaemia with its multi-system effects was found to have some influence on these parameters of monitoring in our study and this supports previous works (15,16,17,18). The higher value of the subnasale to gnathion distance recorded in sickle cell disease groups shows that prognathic maxillary profile is more prevalent in SCA subjects than control. Gupte and Suraj (19) had earlier documented that like other haemolytic anaemias, children with sickle cell anaemia develop a characteristic facial appearance which can be used to describe them in this environment. These characteristics include frontal bossing, prominent maxilla which exposes their teeth, depression of the bridge of the nose and malocclusion of the teeth. This profile is expected to be more prominent in the age group of 11-14 years as evidenced in this study as it revealed a statistical significant difference in comparison to the normal growing children. This finding does not correlate with that of Farkas and James (20). Sickle cell gnathopathy is often detected clinically which correlate with our study and that of Licciardello et al (21) study, but can also be evaluated radiographically (22). It is therefore, not surprising that this parameter; subnasale to gnathion distance is affected among the sickle cell disease patients in this study. In this research, the mean nasal indices of 85.67±11.43 for the sickle cell disease group and 88.04±3.85 for the healthy children does not reveal a significant difference between the compared groups (p>0.05). This is to say that there are no distinctive anatomical differences between the nose type of normal growing children which is the platyrrhine class of nose and that of sickle cell disease children as reported by previous studies (23, 24, 25). However, the results of this study correlates with work done by Farkas and Lindsay (8). Bone marrow hyperplasia is the cause of the maxillary overgrowth as previously stated and this might be the cause of the lower nasal index resulting from the greater nasal width in comparison to the normal growing children. The nasal index in this study is lower than Akpa’s et al (23) study among the Ibos in the Eastern part of Nigeria and higher in comparison to the Caucasians having a nasal index of 71.0 and below- leptorrhine (26). Many factors are known to influence the manifestations of sickle cell anaemia, among which are environmental factors like pollution, poor sanitary conditions, personal hygiene and other poor social circumstances (7). Determinants of disease severity include internal factors, external environmental influences, socio-cultural variables such as widespread poverty, poor state of health facilities, illiteracy, ignorance and the African view of disease causation (7). This is likely to be reasons why the severity of sickle cell disease in more in the Sub-Sahara Africa (3). The Niger Delta Area of Nigeria, though the source of mineral wealth, is about the least developed in terms of basic necessities and infrastructure, which include access to education and good health care. This is further compounded by environmental pollution accompanying oil exploration and exploitation in this region (27). The study therefore, determines some of the craniofacial changes in sickle cell anaemia in comparison to the healthy children in Port-Harcourt. This study could be subjected to further investigation due to its relevance in prediction/clinical anthropometry, maxillofacial surgery and Forensic Science. Acknowledgments We are grateful to all staff of the Department of Paediatrics in the University of Port-Harcourt for their co operation, understanding and support. REFERENCES
Copyright 2010 - European Journal of General Medicine The following images related to this document are available:Photo images[gm10036t2.jpg] [gm10036t3.jpg] [gm10036t4.jpg] [gm10036t1.jpg] |
| |||||||||