 |
search
for |
| About Bioline | All Journals | Testimonials | Membership | News |
|
||||||
|
||||||
Indian Journal of Human Genetics, Vol. 8, No. 1, Jan-Jun, 2002 pp. 15-19 Image Analysis System and its use in Cytogenetic Analysis
Md. Equebal Ahmad, Kiran Kucheria Division of Genetics, Department of Anatomy, All India
Institute of Medical Sciences, New Delhi-110029, India. Code Number: hg02004 Cytogenetic analysis is an important tool in the diagnosis of genetic disorders. It involves cell culture, metaphase arrest, hypotonic treatment, cell fixation, slide preparation and use of banding methods. Following the banding, analysis is done by taking photomicrographs of the metaphase spreads and developing and printing the film in the dark room. Individual chromosomes are then manually cut, paired, pasted and a karyotype is made. This whole procedure is time consuming, labour intensive and expensive. With the increasing workload of the cytogenetic laboratories and availability of improved computer capabilities for image processing, the Image Analysing System, with appropriate software, are being used for cytogenetic analysis. The system includes a high resolution research microscope with or without an automatic metaphase scanning stage, charged couple device (CCD) camera and computer with special software for image capturing, chromosome counting, automatic karyotyping etc. The system is connected to an ordinary inkjet/laser printer. The present paper deals with our experience of one year on use of image analysis system in routine cytogenetic analysis which has cut down the cost and time of karyotyping and analysis by non use of photographic film, developing, printing and dark room facilities. Hence provides reports to the patients with karyotypes using ordinary paper in one hour only. The most important is that this system has made storing and retrieval of data very easy.
Key Words: Image analysis system, cytogenetics, karyotyping Revolution in computer technology and its increasing application in image analysis has made the interpretation of chromosomal patterns an automated process. Computer image processing in cytogenetics offers several advantages over conventional method. Image analysis systems are rapidly replacing conventional method of photomicrography and dark room requirements. Improvements in microprocessors, video cameras, monitors, printers and computer technology have contributed to better image quality, resolutions and several other functions. In conventional method prepared slides are scanned under microscope and well-spread metaphases are subjected to photography. The film is developed manually and printed using the dark room facilities by the scientist. Dried prints are then assembled for cutting individual chromosomes and homologous pairs are pasted for making karyotype. Therefore a need was felt to have a computer-assisted system which can make the process of karyotyping simple, easier, rapid and cost effective. Although work in this direction started in early 1960s, the earlier systems developed were not so effective. In recent years few systems are being developed using which a metaphase can be captured, enhanced, karyotyped and printed in less than an hour. Thus reducing the turn around time significantly. The cost of laser black and white prints is considerably less than the cost of photographic prints. Besides these all the data and karyotypes can be stored using optical disks for long-term storage and retrieval. Use of image analysis system for karyotyping replaces the storage of traditional film negatives, require less storage space, and are more expedient in reproducing a print if needed.
Materials and Methods
Image analysis system has four components.
Steps involved in karyotyping by image analysis system: Slides were prepared as per the standard procedure for conventional cytogenetic analysis and were subjected to chromosome banding G, R, Q or C as per the requirement. Rest of the process was completed in the following way. (a) Slides were scanned, and well-banded and well-spread metaphases were selected and sharply focused. The metaphase spreads visualized under 100X and their images seen on the monitor were captured. The digitizing system within the computer takes the signal from the microscope's video camera and converts it to a numerical matrix. This matrix is composed of row and column indices that create a grid like system (Popescu et al., 1999). The intersecting points on this grid are called as pixels. Each pixel or picture is attributed a gray value. These gray values represent the entire field of view, including chromosomes, debris, cytoplasm and interphase nuclei. The gray levels or gray scale values represent whatever is being looked at through the objective. (b) To help the user in analysis of captured metaphases most of the softwares developed for karyotyping have following components (Josifek et al., 1971).
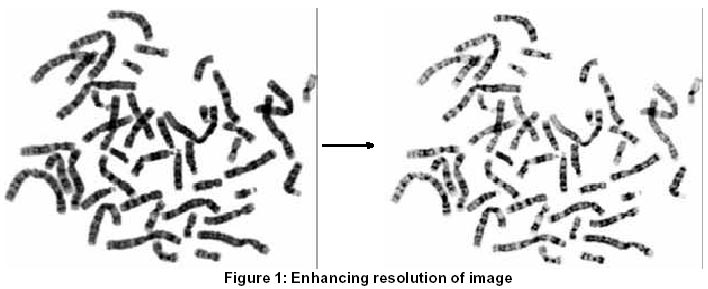
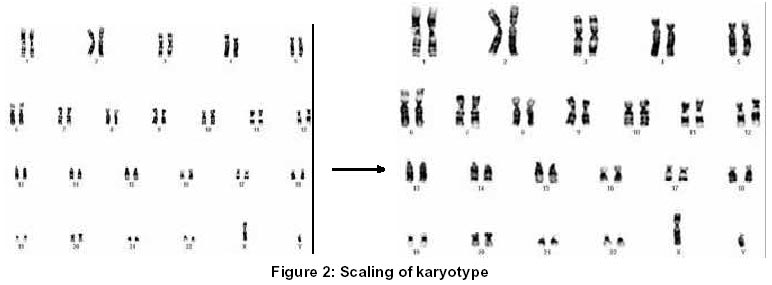
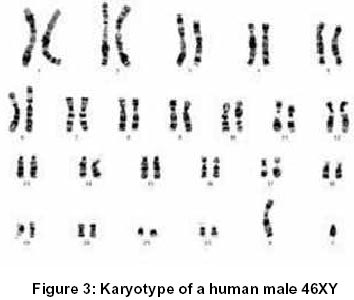
(c) The bands of the initial karyotype obtained were then improved using `contrast' and `enhancement' features of the system to get better resolution of the bands (Figure 1 & 2). (d) When optimal banding resolution was obtained and analysis was done, print was taken in just one click of the mouse within few seconds. Reports to the patients were given along with the karyotypes on different formats (Figure 3). (e) Description of Specific Features: The following features/capabilities are representative of image analysis system for cytogenetic analysis. 1. Metaphase Finders/Scanners aid the cytogeneticist to locate rapidly suitable metaphases for analysis. These instruments automatically scan the microscope slide to locate likely metaphase spreads. Metaphase finding/scanning instruments are not always accurate. In some cases their use is limited to specific types of staining and spreading. 2.Chromosome Counters determine the chromosome number by automatically counting the number of chromosomes in a given metaphase spread. 3.Photomicroscopy eliminates the need of photomicrography, photographic film, photographic dark room processes, printing paper and cutting and pasting of chromosomes when performing karyotyping. The process uses digital image processing to digitize the metaphase images by dividing the picture into a grid of pixels (Graham, 1987). The resolution and detail is determined by the number of pixels in the image and the range in the level of contrast (grayness). The level of grayness may theoretically range from 0 to 256 (Stanley et al., 1995). Optical information about each pixel as well as its location may be processed and stored in the computer database. 4. Image Analysis Systems exist with varying amounts of decision-making ability. The metaphase chromosomes are manipulated (cut) and arranged (pasted) in pairs on the karyotype card (projected onto the computer monitor). Chromosomes are classified on the basis of chromosome dimension (e.g., relative length of chromosomes, centromeric index i.e. ratio of short arm to long arm) and banding pattern profile. Assuming absorption imagery, bands are considered as dark regions of the chromosomes by the system. An optical density based threshold selects the dark parts as regions potentially bearing a band. In this way the vague connections between clearly separated bands are avoided. From this and some more information a subset of the bands is extracted and used for classification. Some of the systems use the central position of the following bands to get an initial karyotype (Martin et al., 1990) :
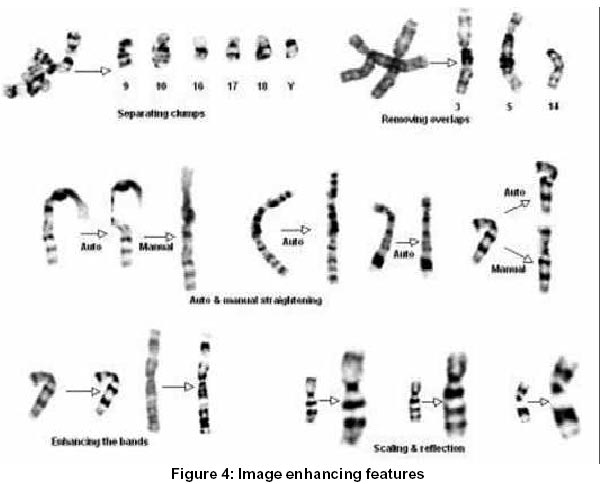
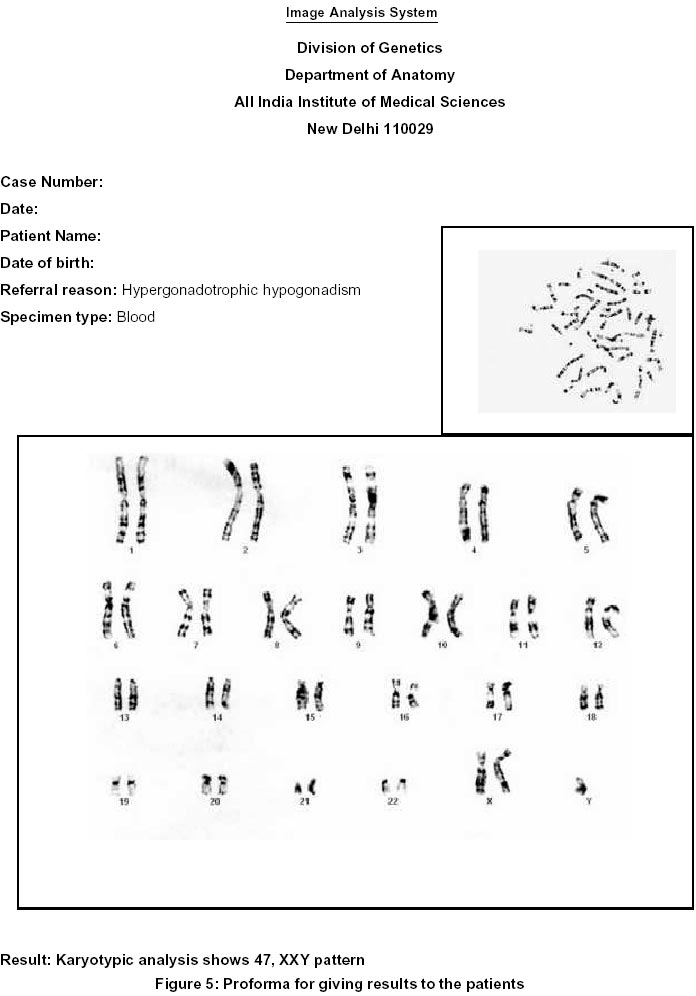
After computing the a posteriori of probabilities of each chromosome a context sensitive classifier assigns the chromosomes to the possible classes. It is assumed that the metaphase contains two copies of each autosome and two sex chromosomes, XX for females and XY for males. An exception is made when there is any numerical anomaly. For classification all chromosomes are ordered in decreasing length, building a list with longest chromosomes first. Chromosomes unidentified by the system are left unclassified which can be manually placed to its suitable position after analysis. 5. Enhancement, Alteration and Manipulative Features There are features to enhance or contrast chromosome images in metaphases and/or individual chromosomes to improve the banding characteristics of the chromosome (s). Other features alter or allow the operator to alter chromosome appearance to make analysis better e.g. straightening, enlarging, trimming, selectively altering staining pattern within a metaphase spread, and dodging/lifting the background (Figure 4). 6.Graphic presentations can also be done to observe any minor chromosomal rearrangement in the metaphase. Any deviation in the graph indicates deletion or addition in a particular chromosome. 7. Specialized Analysis. A few instruments have the ability to perform analysis of specialized studies such as Fluorescent in situ hybridization (FISH) and Comparative Genome Hybridization (CGH) analysis. Some chromosome analyzers automatically count the number of satellites or SCEs per metaphase cell or the number of hybridized probe sites per interphase or metaphase cell. 8.Hard Copy Prints. Most systems are capable of producing photographic quality; printer generated hard copy of the metaphase images and karyotypes. 9.Generating Reports. Many instruments have capabilities of generating (preparation & printing) a final report along with the karyotype in different formats (Figure 5). 10.Computerized Patient Data Storage, Retrieval and Archival Systems. A database includes metaphase images and karyotypes, patient identifying information etc. 11.Training Feature. This feature permits the operator to teach the system to recognize the chromosome preparations particular to a given laboratory. It allows the operator to "train" the instrument to recognize different staining preparations. Discussion
Although the image analysis system makes the process of cytogenetic analysis rapid, cost effective and eliminates labour involved in the conventional method, the system cannot itself detect any abnormality (structural or numerical) present in a metaphase. All its decision-making features are just to help in improving the resolution of the band and making the cytogenetic analysis correct and faster. Therefore a qualified, skilled and well-trained cytogeneticist is must for the purpose of cytogenetic analysis. Presently Image Analysis Systems are easily available in India and can be obtained from leading microscopes companies.
Acknowledgements
Authors are grateful to the Department of Biotechnology (DBT), New Delhi and All India Institute of Medical Sciences (AIIMS) for providing financial assistance and necessary facilities.
References
Copyright 2002 - the Indian Society of Human Genetics The following images related to this document are available:Photo images[hg02004f3.jpg] [hg02004f1.jpg] [hg02004f2.jpg] [hg02004f5.jpg] [hg02004f4.jpg] |
| |||||||||
