 |
| About Bioline | All Journals | Testimonials | Membership | News |
|
||||||
|
||||||
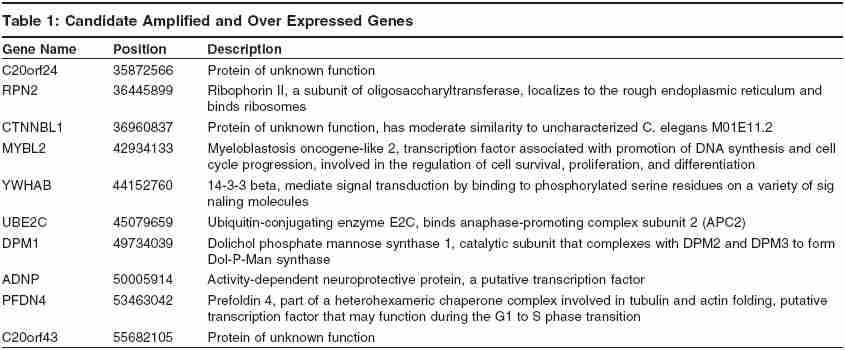
Indian Journal of Human Genetics, Vol. 11, No. 3, September-December, 2005, pp. 128-134 Original Communication Genomic and expression array profiling of chromosome 20q amplicon in human colon cancer cells Carter JenniferI, Jin1 Li, Sen Subrata University of Texas - M. D. Anderson Cancer Center, 1PD, University of Cincinnati Code Number: hg05025 Abstract BACKGROUND: Gain of the q arm of chromosome 20 in human colorectal cancer has been associated with poorer survival time and has been reported to increase in frequency from adenomas to metastasis. The increasing frequency of chromosome 20q amplification during colorectal cancer progression and the presence of this amplification in carcinomas of other tissue origin has lead us to hypothesize that 20q11-13 harbors one or more genes which, when over expressed promote tumor invasion and metastasis.AIMS: Generate genomic and expression profiles of the 20q amplicon in human cancer cell lines in order to identify genes with increased copy number and expression. MATERIALS AND METHODS: Utilizing genomic sequencing clones and amplification mapping data from our lab and other previous studies, BAC/ PAC tiling paths spanning the 20q amplicon and genomic microarrays were generated. Array-CGH on the custom array with human cancer cell line DNAs was performed to generate genomic profiles of the amplicon. Expression array analysis with RNA from these cell lines using commercial oligo microarrays generated expression profiles of the amplicon. The data were then combined in order to identify genes with increased copy number and expression. RESULTS: Over expressed genes in regions of increased copy number were identified and a list of potential novel genetic tumor markers was assembled based on biological functions of these genes CONCLUSIONS: Performing high-resolution genomic microarray profiling in conjunction with expression analysis is an effective approach to identify potential tumor markers. Keywords: Cancer, Array-CGH, Amplification, Genomic Profiling Cancer, a disease of impaired genomic stability, remains one of the greatest threats to human health and a challenge to medical science in the twenty-first century. Genomic instability has been implicated as providing cancer cells with the ability to undergo clonal evolution facilitating emergence of cells with uncontrolled capacity for proliferation, survival, angiogenesis, invasion and metastasis.[1],[2] Characterization of genomic rearrangements is, therefore, a major area of investigation being pursued by the cancer research community. Amplification of genomic DNA is one such form of rearrangement that leads to an increase in the copy number of specific genes frequently detected in a variety of human cancer cell types. Our laboratory has been interested in characterizing amplified genomic regions in cancer cells based on the hypothesis that these segments harbor critical genes associated with initiation and/or progression of cancer. Gain of chromosome 20q in human colorectal cancer has been associated with poorer survival time and has been reported to increase in frequency from around 50% in adenomas, to 60% in early carcinomas and to 83% in late carcinomas and liver metastasis.[3],[4],[5] The increasing frequency of chromosome 20q amplification during colorectal cancer progression and the presence of this amplification in carcinomas of diverse origins has lead us to hypothesize that the 20q11-13 amplicon harbors one or more amplified genes which, when over expressed promote tumor invasion and metastasis. In view of this hypothesis we were interested to generate high-resolution amplification profiles for human chromosome 20q in colorectal cancer cell lines by microarray comparative genomic hybridization (array-CGH) and correlate the results with expression microarray analysis to identify novel amplified and over expressed genes whose function suggest an association with tumor invasion/metastasis. Material and Methods Cell Lines and Culturing: The breast carcinoma cell lines MCF7 and SKBr3 were obtained from ATCC and cultured as follows. For MCF7, complete media was DMEM with 2 mM L-glutamine, 5 mM penicillin/streptomycin, fetal bovine serum, 10%. For SKBr3, complete media was McCoy′s 5a medium with 2 mM L-glutamine, 5 mM penicillin/streptomycin, fetal bovine serum, 10%. The colon carcinoma cell lines HT29 and Caco-2 cells were obtained from ATCC and cultured as follows. For HT-29 complete media was DMEM with 2 mM L-glutamine, 5 mM penicillin/streptomycin, fetal bovine serum, 10%. For CaCo-2, complete media was EMEM with 2 mM L-glutamine, 1.5 g/L sodium bicarbonate, 0.1 mM non-essential amino acids, 1.0 mM sodium pyruvate, 5 mM penicillin/streptomycin, fetal bovine serum, 20%. All cell lines were cultured in a humidified incubator at a temperature of 370C in 95% air and 5% CO2. Microarray Construction: The 20q amplicon has previously been defined based on FISH analysis in our lab and by others, as the region between STS markers D20S1076 and Z94462.[6] Chromosome 20 has been sequenced primarily by the Wellcome Trust Sanger Institute and the contigs used in the sequencing are available on the WEB at the National Center for Biotechnology Information (NCBI) site.[7] Based on the clones in the sequencing contig NT 011362.7, first a 12 Mb BAC/PAC contig comprising of 137 clones and then an approximately 22.8 Mb BAC/PAC contig comprising of 253 BAC and PAC clones were generated from the following human genomic libraries: RPCI-11, RPCI-5, RPCI-1, RPCI-3, RPCI-4, and CalTech D2. [Figure - 1]. is a graphical representation of both contigs and their boundaries. The array printing was done in collaboration with the laboratory of Dr. Li Jin at the University of Cincinnati. For array printing, DNA from clones were prepared using the Qiagen Midi Kit (Valencia, CA) and amplified by PCR using human specific degenerate primers designed to eliminate vector DNA, reduce amplification of repetitive sequences and incorporate amino-modified nucleotide. The amplified DNA was micro-spotted with an Omnigrid Microarrayer using the touch pin method onto aldehyde-coated slides. The slides were then cross-linked, washed, denatured and the unbound aldehyde groups blocked. Labeling Genomic DNA and Array-CGH: Genomic DNA was isolated using the Qiagen DNeasy DNA Extraction Kit according to the manufacturer′s protocols. Sample DNA and reference genomic DNA (Promega, Madison, WI) labeling was carried out similar to previous methods.[8] Genomic DNA was digested with the endonuclease aTaq I, quantitated and examined for complete digestion by agarose gel electrophoresis. Random priming reactions of DNA using BioPrime Random Labeling Kit (Invitrogen, Carlsbad, CA) were carried out according to manufacturer′s protocol with: 2nmol dATP, dGTP, dCTP, 0.6 nmol dTTP and 1.4 nmol of Cy3-dUTP or Cy5-dUTP used in the place of the dNTP mix provided. Labeled test and standard DNA were combined, COT-1 Human DNA and sheared Salmon sperm DNA were added to block non-specific binding and the mixture was ethanol precipitated. The pellet was resuspended in hybridization buffer and incubated for 1 hour at 42oC. Hybridization was carried out similarly to previously described methods.[8] The hybridization mixture was deposited on a 22mm X 22mm coverslip, placed on the arrayed area of the slide and incubated for 48-72 hours at 42oC in a high humidity and light protected environment. Following the incubation the slides were washed for 5 minutes in wash buffer I (2X SSC, 0.5% SDS), 5 minutes in was buffer II (1X SSC, 0.5% SDS), 2 minutes in wash buffer III (0.2X SSC, 0.3% SDS) and immediately dried by spinning in a centrifuge. Slides were then visualized by scanning with a GenePix 4000Bi scanner and initially analyzed using Axon GenePix Pro 3.0 software for fluorescence ratios. For each cell line, hybridizations were repeated with inverse labeled test and standard DNA (dye-swap hybridization). Expression Microarray Analysis: Expression Array analysis: Total cellular RNA was isolated from the cell lines using TRIZOL (Invitrogen, Carlsbad, CA) and further purified using the Qiagen RNeasy RNA Extraction Kit with an on column DNAse digestion. RNA from cell lines and commercially available normal colonic epithelial RNA (BD Biosciences Clonetech, Palo Alto, CA) was labeled using Agilent′s Low RNA Input Labeling Kit, which involves reverse transcribing the mRNA to produce cDNA and then transcribing in the presence of Cy3-CTP and Cy5-CTP to produce labeled cRNA. The labeled cell line cRNA was paired with the differentially labeled normal cRNA and, using the Agilent In situ Hybridization Kit, hybridized to the Agilent Human 1A oligo microarray (v1) or Human 1B oligo microarray according to the manufacturer′s protocol. The arrays were scanned on an Agilent DNA microarray scanner and analyzed using Agilent Feature Extraction Software. Microarray Data Analysis: For array-CGH, background subtracted fluorescence data generated with Genepix software was imported into Excel where replicates were combined and Log base2 ratios calculated. Any array spot with a signal to noise ratio greater than 3 was excluded from the analysis. Normalization was carried out as follows: the average fluorescence ratio across all clones was calculated, each clone′s ratio was multiplied by this number and ploidy correction values were added when necessary. Data was graphed in Excel and a moving average per 5 clones was plotted. A log2 ratio of >0.4 was considered gain and >0.8 considered amplification for this study. For expression arrays, Agilent′s Feature Extraction data treatment within the software was as follows: Linear/Lowess normalization was carried out, Log base 10 ratios were calculated and built in error models were used to calculate a p-value for each probe. Probes with a signal to noise ratio less than 3 were excluded. Results MCF7 and SKBr3 breast carcinoma cell lines have been extensively characterized in the 20q region and were used to validate the quality and accuracy of the custom genomic arrays.[9],[10] Array-CGH was performed on these cell lines using the initial 12 Mb BAC/PAC genomic array (array 1), the resulting genomic profiles are shown in [Figure - 2]. The cell line MCF7 showed no copy gain along the array′s contig while SKBr3 showed copy gain (log 2 ratio between 0.4 and 0.8) from 44-46 Mb and from 52-55 Mb with a region of amplification (log 2 ratio greater than 0.8) around 52 and 55Mb. A second 22.8 Mb BAC/PAC genomic array (array 2) was constructed to provide greater coverage of the 20q region. The profiles generated from array-CGH analysis agreed well with the profiles previously generated by array 1 [Figure - 2]. While MCF7 showed no copy gain over the extended contig, SKBr3′s profile from array 2 showed the same copy gains as that of array 1′s profile. In the extended amplicon region, SKBr3 showed copy gain extended from 42Mb to 46Mb and identified a high copy gain from 37Mb to 38Mb. Array-CGH was then carried out with DNA from the colorectal carcinoma cell lines HT29 and CaCo-2 DNA on the second array [Figure - 3]. The profiles generated reveal differential copy number variation across the 20q amplicon for both cell lines. Cell line HT29 showed an overall copy gain of 1(log 2 ratio = 0.5) with regions of amplification at 37-39 Mb, 42-45Mb, 50-53Mb and 54-56Mb. There is also a very distinct high-level amplification of +3 copies (total copy number =5) at 54Mb. CaCo-2′s genomic profile was very complex, showing an average copy gain of 2 (log 2 ratio = 1) with specific regions of amplification of +2.5 (log 2 ratio =1.25) at 49Mb, 51Mb, 54Mb and 55.5Mb. Amplifications of +3 copies (log 2 ratio= 1.5) were seen at 39Mb, 41Mb, 44Mb, 45Mb. One region of high amplification with a copy number of +4 (log 2 ratio =2) was observed at 43Mb. Regions along 20q that displayed copy gain in both the cell lines were identified as follows: 37-39 Mb, 42-45 Mb, 48-50 Mb, and 52-56 Mb. Subsequent expression analysis using the Agilent Human1A (v1) and Human 1B oligo arrays produced an expression profile for 20q that showed great variation in the expression of genes from significantly down-regulated to significantly up-regulated, although the majority of genes showed no variation in expression between cancer cell line, and normal colonic epithelium. A list of 23 genes for HT29 and 34 genes for CaCo-2 whose probes showed significant (p<0.01) increased expression levels from normal colonic epithelium [Figure - 3] in red was generated. Of these genes, 21 were commonly over expressed in both cell lines. Taking into account the genomic copy number profile as well as the known function of the gene product, a list of 10 candidate tumor marker genes was generated [Table 1]. Discussion
Using the BAC/PAC genomic microarray to scan for amplification has afforded an increased sensitivity necessary to provide a high-resolution map of the 20q amplicon detected in the colorectal cancer cell lines, we examined. The validation experiments with breast carcinoma cell lines MCF7 and SKBr3, when compared with previous studies, provided mixed results.[9],[10] For SKBr3, the genomic profile generated with both array 1 and array 2 were consistent and agreed with regions of amplification previously identified using FISH[9] and BAC array-CGH.[10] However, although MCF7′s genomic profile was consistent from array 1 to array 2 and agreed with the previous FISH study,[9] the profile was not consistent with that seen in the previous BAC array-CGH study.[10] The difference in the profiles generated could be due to the documented high variation in MCF7 cell lines from different sources.[17] Our source for MCF7 was ATCC, and based on their karyotype information as well as that previously published, MCF7 has been reported with a range of chromosome 20 copy number, from being nullisomic to polysomic.[17],[18] The profile generated with our genomic array is consistent with that reported in the SKY, FISH, CGH database on The University of Cambridge Cancer Genomics Program website.[19] The genomic profiles for HT29 and CaCo-2 revealed an overall increase of one and two copies of chromosome 20q respectively, which is in agreement with previous karyotyping and metaphase CGH studies.[20],[21] However, with the custom array-CGH we were able to detect further regional gains at the 37-39Mb, 42-45Mb, 48-50Mb, and 52-56Mb intervals. The HT29 profile also reveals a distinct copy gain at 53Mb, while CaCo-2 appears to have a distinct copy gain at 43Mb. Overall, HT29′s profile shows fewer distinct copy gains while CaCo-2 appears to have multiple distinct copy gains. When these genomic profiles were combined with expression array data for over 200 genes on 20q, candidate genes in amplified regions were identified. The fact that, of the 23 genes for HT29 and 34 genes for CaCo-2 whose probes showed significant (p<0.01) increased expression, 21 were common to both cell lines suggests a common expression signature for the cell lines. When both the location of the 21 genes with respect to the common intervals of copy gain and the function of the gene products was considered, 10 genes were identified for further examination as candidate genes associated with colorectal cancer. Of the 10 candidate genes, the open reading frames (C20orf24 and C20orf43) and CTNNBL1 are novel and uncharacterized genes whose possible role in cancer is, therefore, unknown. The gene RPN2 is located in the proximal region of the contig and its protein functions as a subunit of proteosomes regulatory complex 19S. This subunit has recently been reported to be the target of caspase cleavage upon induction of apoptosis, thus an over expression of the gene may function in increasing resistance to apoptosis in cancer cells.[22] The candidate genes MYBL2 and UBE2C are directly involved in cell cycle progression through the promotion of G1 to S phase and the degradation of cyclins as part of the APC2 complex respectively, thus their importance in cancer cells has been previously noted.[23],[24] According to a previous study, the protein encoded by ADNP may increase the viability of certain cell types through modulation of p53 activity, thus making it a very attractive oncogene candidate as well.[25] YWHAB coeds for the protein 14-3-3 beta, which is involved in mediating signal transduction as well as having been shown to promote cell spreading and migration through it′s interaction with beta-1 integrin.[26] Thus it is likely that over expression of YWHAB not only may perturb regulatory signal transduction pathways but also may promote tumor cell invasion and metastasis. While the general function of DPM1, as a subunit of the Dol-P Man synthase, is known to involve protein modification of N-glycans and the proper surface expression of GPI-anchored proteins, it′s possible role in cancer is unknown. One could suppose over expression of DPN1 may alter the number and type of GPI-anchored proteins on the cell surface, affecting cell cell interaction, adhesion and cellular transport. The gene prefoldin 4, PFDN4, resides on the distinct copy gain at 53Mb in HT-29, and also happens to be significantly over expressed in both cell lines. In one published study, the chaperonin protein coded for by PFDN4 showed cell cycle specific expression and was highly expressed in cells in crisis, suggesting that PFDN4 may play an important role in cell cycle regulation and overcoming senescence [27]. Interestingly, the highly amplified region at 43Mb in CaCo-2 did not contain a candidate gene, but MYBL2 and YWHAB flank this region and could be affected by this amplification. Utilizing both array-CGH and expression array analysis, a list of over 200 potential candidate genes represented on the arrays was efficiently reduced to 10 candidate genes for further examination. Other commonly amplified genomic regions in colon and breast tumors include 8p11-12, 17q23 and 12q13-14 [14],[28],[29]. In utilizing microarray technology, identification of amplicon genes contributing to tumor progression can be done in a genome wide, efficient manner. These genes could serve to identify the cellular pathways commonly altered in human cancer and signify which profiles are associated with certain tumor phenotypes. The genes identified could also be used as a panel of tumor markers for diagnosis, prognosis as well as identification of targets for drug therapy effective in the treatment of tumors. Acknowledgements The authors would like to acknowledge the collaborative efforts of Zhenyu Yuan PhD and Kun Zhang PhD in producing the custom microarrays. The authors would also like to acknowledge the contribution of technical expertise by Scott Vacha, PhD in standardizing hybridization procedures.References
Copyright 2005 - Indian Journal of Human Genetics The following images related to this document are available:Photo images[hg05025t1.jpg] [hg05025f1a.jpg] [hg05025f2.jpg] [hg05025f1.jpg] [hg05025f3.jpg] [hg05025f 2.jpg] |
| |||||||||

![[Figure - 1]](/showimage?hg/photo/hg05025f1.jpg)
![[Figure - 2]](/showimage?hg/photo/hg05025f2.jpg)
![[Figure - 3]](/showimage?hg/photo/hg05025f3.jpg)