 |
| About Bioline | All Journals | Testimonials | Membership | News |
|
||||||
|
||||||
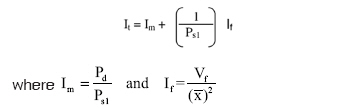
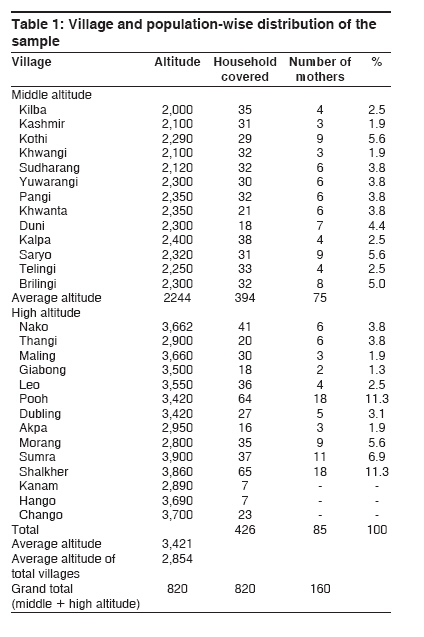
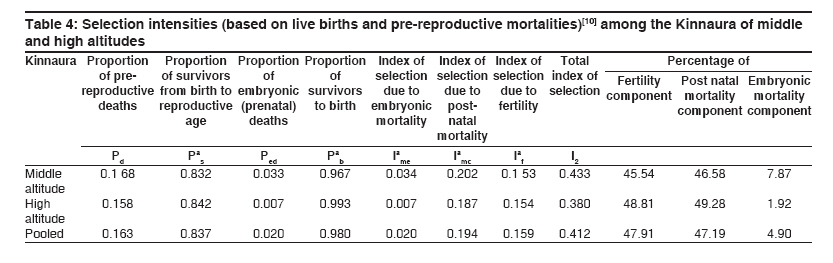
Indian Journal of Human Genetics, Vol. 15, No. 3, September-December, 2009, pp. 125-136 Original Article Natural selection among Kinnaura of the Himalayan highland: A comparative analysis with other Indian and Himalayan populations Gautam RajeshK, Kapoor AnupK, Kshatriya GK Department of Anthropology, Dr. HS Gour University, Sagar - 470 003, MPCorrespondence Address:Department of Anthropology, Dr. HS Gour University, Sagar - 470 003, MPgoutamraj@rediffmail.com Code Number: hg09028 DOI: 10.4103/0971-6866.60189 Abstract The present investigation on fertility and mortality differential among Kinnaura of the Himalayan highland is based on data collected from 160 post-menopausal women belonging to the middle and high altitude region of Kinnaur district of Himachal Pradesh (Indian Himalayas). Selection potential based on differential fertility and mortality was computed for middle- and high-altitude women. Irrespective of the methodology, the total index of selection was found to be highest among middle-altitude women (0.386) as compared with high-altitude (0.370) women, whereas for the total population it is estimated to be 0.384. It was found that the Kinnaura of the Himalayan highland showing moderate index of total selection and relative contribution of the mortality component (Im) to the index of total selection is higher than the corresponding fertility component (If). The analysis of embryonic and post-natal mortality components shows that the post-natal mortality components are higher in comparison with the embryonic mortality components among highlanders and needs special intervention and health care. The present findings are compared with other Indian tribes as well as non-tribes of the Himalayan region and other parts of the country. It reveals that this index among Kinnaura is moderate than the other population groups; among the Himalayan population, the highest was reported for Galong (It = 1.07) of Arunachal, whereas the lowest was reported from Ahom (It = 0.218) of Manipur. The correlation and regression analysis between total index of selection (It) and fertility (If) and mortality (Im) components for pooled data of populations of the Indian Himalayan states show that If and Im account for 21.6 and 29.1% variability, respectively. In Crow's total index of selection (It) along with strong association, which is significant at the 1% level, this indicates that mortality plays a greater role in natural selection in comparison with fertility among populations of the Indian Himalayas.Keywords: Ecology, Himalayas, Indian population, Polyandrous-Kinnaura, selection potential Introduction Natural selection is the process of preservation of genotypes among organisms, which increase chances of survival, procreation and multiplication from generation to generation at the expense of less-advantageous ones. Evolution often occurs as a consequence of this process. Natural selection may arise from differences in survival, fertility, rate of development, mating success or any other aspect of the life cycle. All such differences result in natural selection to the extent that they affect the number of progeny an organism leaves. It was difficult to measure the intensity of natural selection directly in human populations (Homo sapiens sapiens). The problem of measuring the selection intensity is solved by Crow. [1] He devised an index called the "index of opportunity for natural selection." This index enables the change in fitness to be measured from specific birth and death rates. Thus, "natural selection" is the relative probability of survival and reproduction of the genotype. Only when a certain variability of this fitness is present in a population does natural selection occur. In human populations, the relative reproductive success of the different genotypes depends on the total number of offspring that each couple leaves to the next generation. [2] However, natural selection does not operate only through differential fertility; the existence of differential survival of descendents up to reproductive age also determines the biological fitness. [3],[4] Crow′s index of opportunity for natural selection merely sets an upper limit on the amount of selective opportunity that can exist in any particular population. It measures actual selection only if the heritability of fitness were complete and if birth and death rates were totally determined by genetic factors. [5] Despite this limitation, Crow′s index has been widely used in human populations because it allows indirect quantitative estimation of the selection inherent in the evolutionary process simply on the basis of demographic statistics for birth and death rates. [6],[7],[8],[9],[10] Fertility and mortality can cause a major disruption of gene frequencies from those predicted by the Hardy-Weinberg theorem. Therefore, the quantum of change of differential genetic transmission becomes a significant indicator of the amount of potential evolutionary change within a group, which is actually the production of reproductive viability expressed in the form of differential fertility and mortality. Studies from all over the world have brought forth evidence in support of the contention that the socioeconomic and sociocultural milieus of a population have a tremendous impact on the fertility and mortality components of that population and, subsequently, on selection. [1],[5],[11],[12],[13],[14] In India, a few studies have demonstrated the role of natural selection in imposing characteristic fertility and mortality differentials among the different populations. [3],[7],[15],[16],[17],[18],[19],[20],[21],[22],[23] All these studies reveal a relationship between socioeconomic conditions and the index of total selection. Himalayan populations are widely studied by Kapoor et al., [7] wherein they computed the index of total selection for 24 Himalayan populations, revealing that the contribution of fertility component (I f ) in determining total index of selection (It) is stronger than the mortality component (I m ). Simultaneously, they observed that both I f and I m are strongly associated with I t , accounting for 76 and 67% variability in I t , respectively. But, in their study, highlanders are small in number. Therefore, an attempt was made in the present study to generate data on the highland population. Area and People The present study was conducted in District Kinnaur, which is among one of the 12 districts of Himachal Pradesh of the Indian Republic. The area lies between 31 0 -05′-55′′ and 32 0 -05-20′′ north latitude and between 77 0 -45′-0′ and 79 0 -0′-50′′ east longitude, being demarcated as District Kinnaur. The word Kinnaur is derived from the word Kinnar. Kinnars are often referred to in Hindu religious books. According to mythologies, they are neither God nor human, but are in between these two. In 1960, the northeastern region of Himachal Pradesh was administratively recognized to form the present-day district of Kinnaur. It is spread over 80 km in length and about 64 km in breadth. [24] The total area of the district is 6401 sq km, which is 11.5% of the total area of the state. The district headquarter is located at Reckong Peo. The district is a land of scenic beauty and, at the same time, comprises a cold desert zone too. Sangla, Kalpa and Nichar valleys are enchanting valleys, with lush green forests and apple orchards, whereas the Yangthang, Pooh and Ropa etc. valleys experience cold desert, with no natural flora. National highway no. 22 is constructed in place of the old Hindustan-Tibet road, which goes along the river Sutlej, the river itself passing through narrow fissures of extremely vertical mountains. The vertical valleys are blasted toward the river to construct the present national highway. In many places, the road looks like a tunnel, the mountain hanging over the road, with the deep furious river flowing underneath. Many hanging bridges are constructed over the river to make transportation easy and convenient. But, in spite of all these efforts, the road communication network is not very efficient. It is believed that the district derived its name from its inhabitants who are known as Kinner, or Kinnaura. According to an Indian traveler - Sanskritayan, the original name of the district was Kimpurus Desh, i.e. land of Kimpurusa. [25] In the absence of an authentic historical record, the early history of Kinnaur region is obscure and the reference of the Kinnaura or Kannaura and their land is by and large confined to legends and mythological accounts. The people inhabiting the district of Kinnaur in Himachal Pradesh are known as Kinnaura. They are indigenous occupants of the area. According to the Census of India, [26] their total population in Himachal Pradesh is 45,154. A majority of them identify themselves as Rajputs, the suffixe "Negi" being a common title after their names. Some of the authors [27] Chandra, [28] had associated the term Kinnaura with Indian religious mythology. These authors tried to describe the term Kinner, as mentioned in the Vedas, Puranas, Epics and other religious books, which means half-God or Godly-people or angle-like people. Ethnically, genetically and religiously, Kinnaura are a heterogeneous group of people. Earlier researchers and travelers had reported five different ethnic groups, viz. Kanet, Koli, Badhi, Lohar and Nangloo in the district of Kinnaur. But, today, Kanet is an obsolete term. Raha and Mahato [25] opined that it was a derogatory term, indicating to kunit and Kanya-het. Kunit means one who does not perform his duties as per norms - a violator, whereas Kanya-het means a father who has a lot affection for his daughter. Kanya is a Hindi word, a synonym for daughter, and het meaning liking or affection or love. According to hearsay, in the ancient period, there was a custom of female feticide or female infanticide among the Rajput, the occupants of the region. But, some of these Rajputs had violated the norms of killing the newly born daughter; hence, they were called Kanet (the term "Kanet" was possibly derived from hindi words, either Kunit or Kanya-het or both) by the "daughter killer group of Rajputs" of the area. It is observed that there are two clear-cut divisions in terms of habitations too. These may be designated as middle- and high-altitude region. The high altitude can be associated with an area above an altitude of 3,000 m and the middle altitude can be associated with an altitude ranging between 2,000 and 3,000 m. The Kalpa, Nichar and Sangla valleys fall in the middle-altitude zone and their habitant are migrants, largely from Shimla and Rampur districts. Whereas Kinnaurs of the high altitude are always struggling for subsistence due to the harsh environment and tough challenging ecological conditions, hardly having large land holdings. Hence, they were rendered economically and politically weak. Methodology For the present investigation, the Kinnaura tribe of Kinnaur district of Himachal Pradesh is taken into consideration. As Kinnaura are occupants of two different geoclimatic set-ups, i.e., middle and high altitudes, the study sample for the present investigation comprises a subsample of a total of 160 post-menopausal mothers belonging to the Kinnaura of the Himalayan highlands. Village-wise distributions of mothers are presented in [Table - 1]. A total of 820 households were covered. Of these 820 households, 160 mothers were found in the post-menopausal stage. The information was collected using anthropological techniques, viz. case studies, focus group discussion, in-depth interview, participants′ methods, genealogy and semi-structured schedule. Post-menopausal women are interviewed for different aspects, like age at menarche, menopause, children born, children surviving, child death, etc. and the information given by them is cross-checked through different methods by other members of the family. Case study or life histories of selected women were taken for achieving the goal. Many doubts were cleared from the focus group discussion. In all the cases, genealogy was found helpful in determining the age of the women. Data regarding other Himalayan and Indian populations were collected from 33 different published studies conducted on 70 various endogamous populations of eight Himalayan and four non-Himalayan (plain) states. The data collected from primary and secondary sources were given essential statistical treatment using MS-Excel and SPSS softwares. Among the chief statistical treatments are regression analysis, error bar diagram and scattered plot diagram. The following formulas are used for computing different indices and indicators: Crow′s index of natural selection The index of opportunity for natural selection (I t ) is calculated using Crow′s index, [1] as cited below:
Here, I m = index of opportunity for natural selection due to pre-reproductive mortality (mortality from birth to reproductive age - below 15 years) I f = index of opportunity for natural selection due to fertility x = average number of live births per women aged 45 years and above who has completed her reproductive life span V f = variance (average deviation from mean) of number of live births P d = proportion of pre-reproductive deaths P s1 = proportion of survivors from birth to reproductive ages Proportion of pre-reproductive deaths (P d ) is calculated from children ever born from mothers of age 45 years and above (who have completed their fertility) and pre-reproductive deaths, as cited below: Proportion of pre-reproductive deaths(Pd)
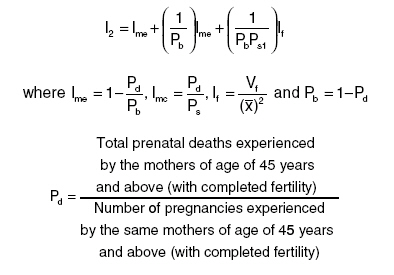
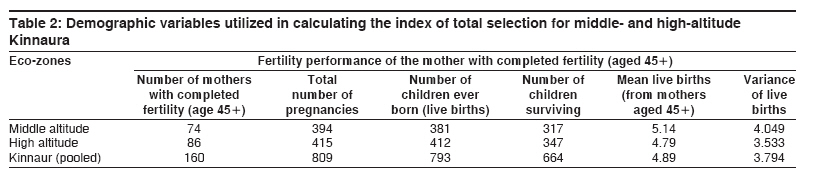
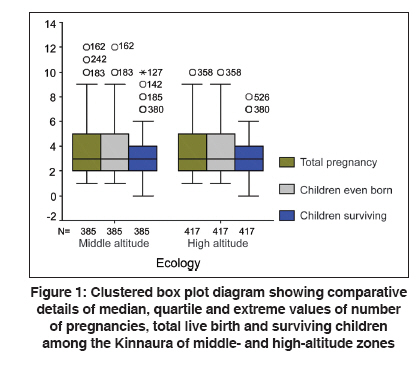
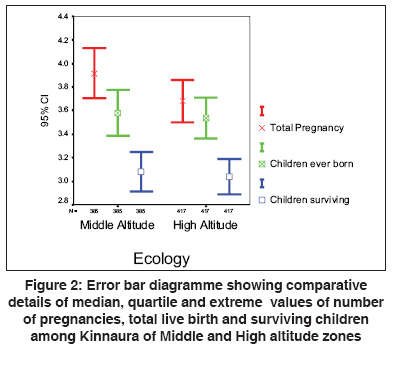
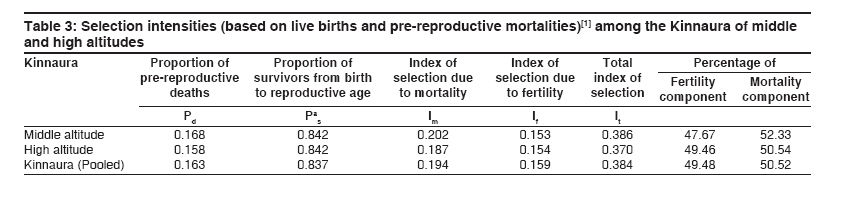
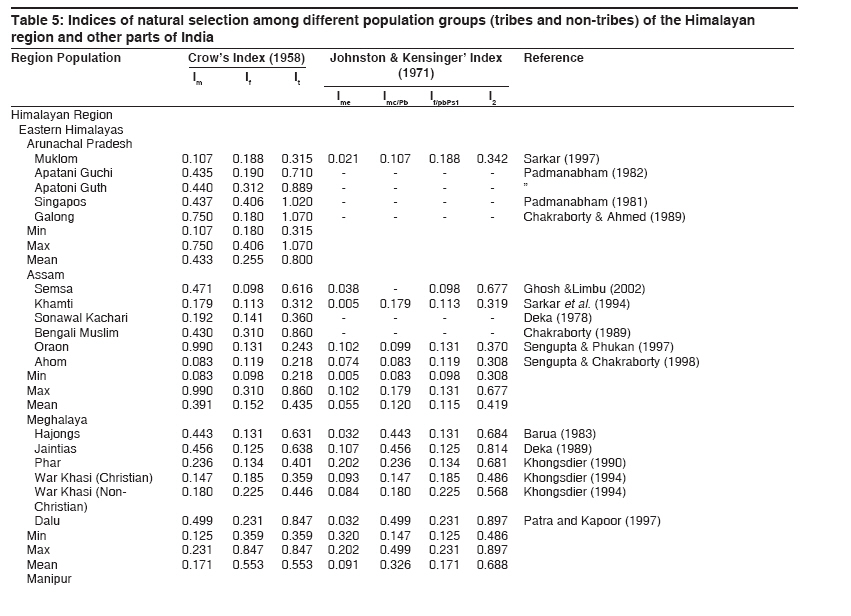
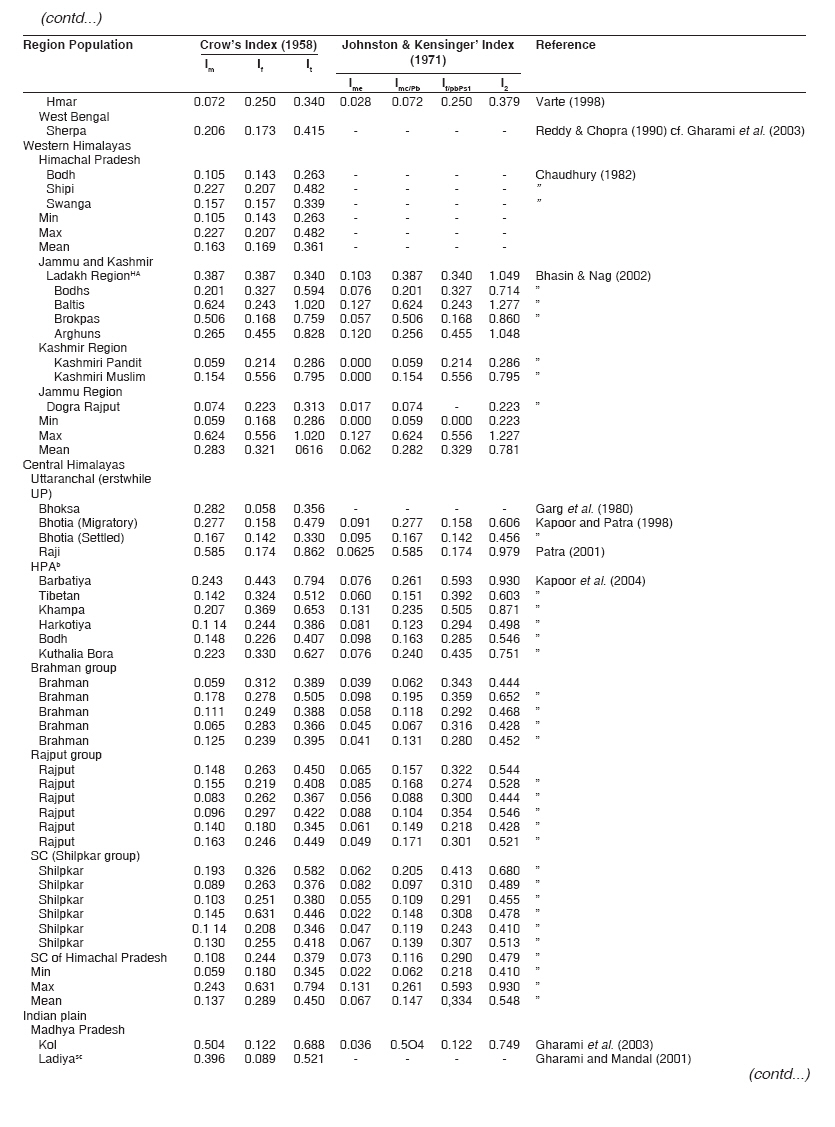
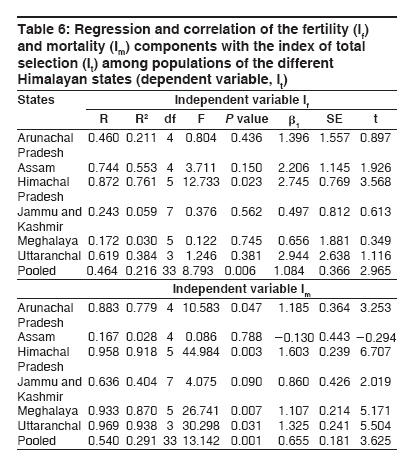
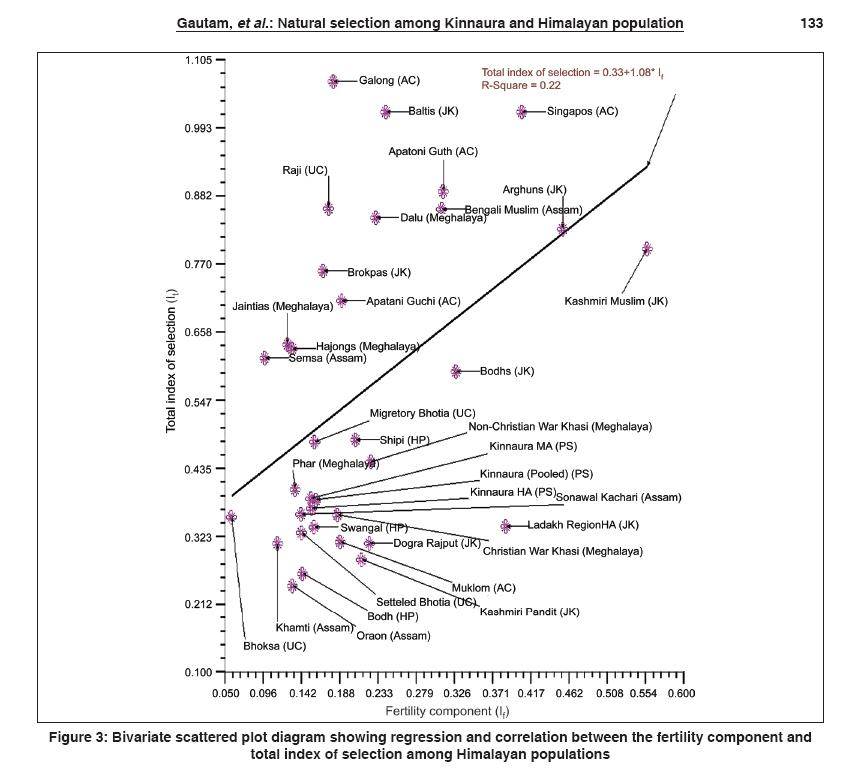
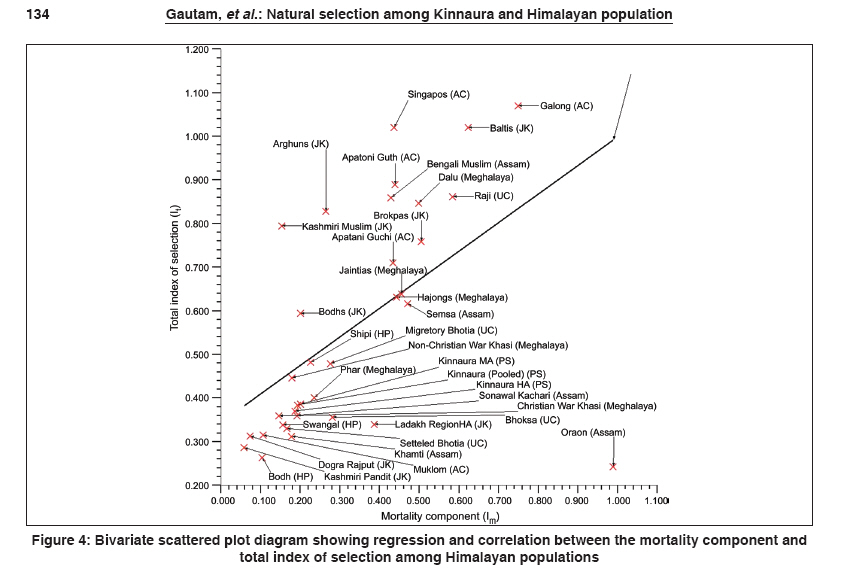
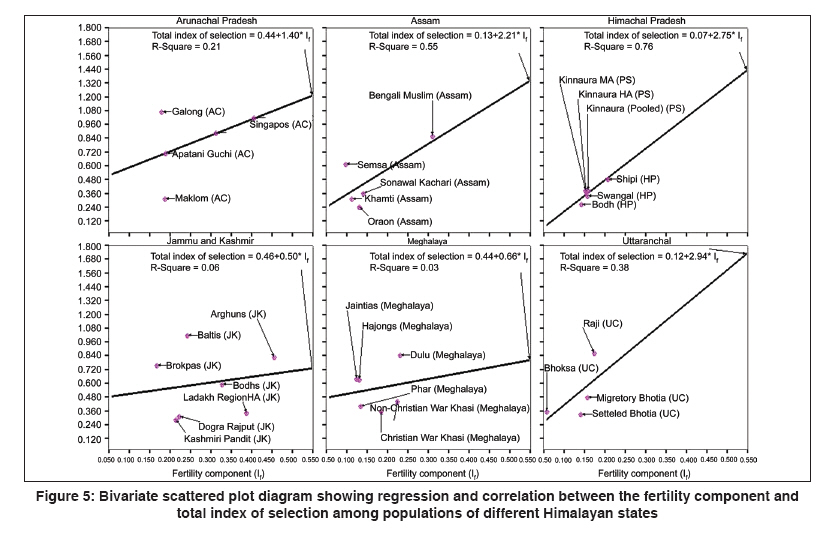
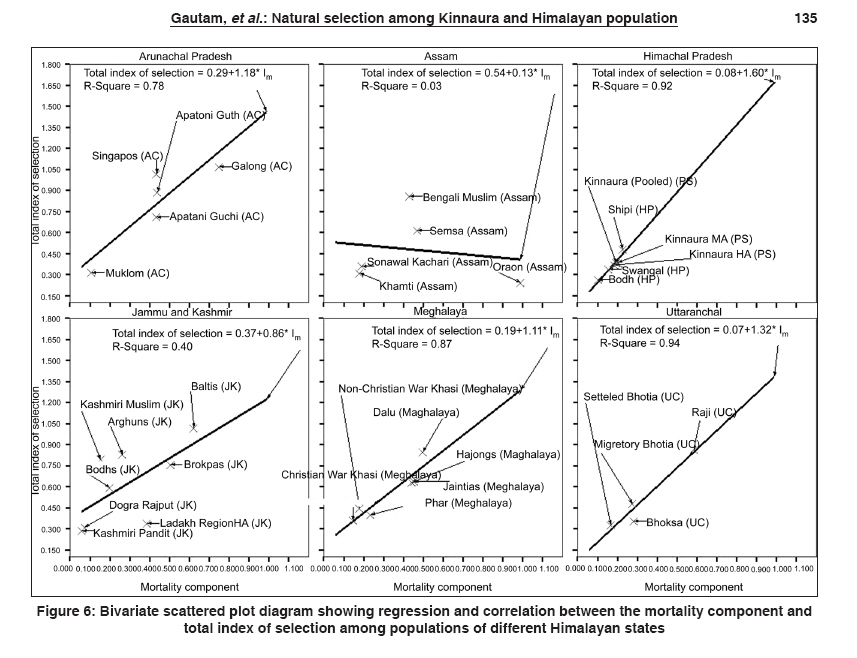
Proportions of survivors were calculated by subtracting P d from 1, as given below: P s1 = 1 - P d Johnston and Kensinger′s index of natural selection The index of opportunity for natural selection (I 2 ) following Johnston and Kensinger′s index [9] has been calculated as follows: [INLINE:3] Here, I me = index of opportunity for natural selection due to embryonic mortality I mc = index of opportunity for natural selection due to pre-reproductive mortality (mortality from birth to reproductive age - below 15 years) I f = index of opportunity for natural selection due to fertility x = average number of live births per women aged 45 years and above who have completed their reproductive life span V f = variance (average deviation from mean) of number of live births P b = proportion of survivors to birth P d = proportion of pre-reproductive deaths P s = proportion of survivors from birth to reproductive ages Result Among the Kinnaura, a total of 813 mothers were interviewed, of whom 160 had already completed their fertility (above 45 years of age) and constituted the sample size for analysis of natural selection. Village-wise distribution of mothers with completed fertility is presented in [Table - 1]. These 160 mothers had conceived a total of 809 pregnancies, which resulted in 793 live births. Of these 793 live births, 664 survived up to their reproductive ages. The mean number of live birth per mother has been found to be 4.89, with a variance of 3.79 [Table - 2]. For further elucidation of facts, box pot and error bar diagrams are constructed [Figure - 1] and [Figure - 2]. It is evident from the error bar diagram that there is a significant difference in the numbers of pregnancy experienced by the mother, children ever born and children surviving. The number of children surviving is significantly less than those born and conceived. This indicates that fetal loss and child mortality is significant among Kinnaura of middle and high altitude. The indices of total selection, based on differential fertility and mortality data, have been computed using the methodologies of Crow [1] and Johnston and Kensinger, [13] presented in [Table - 3] and [Table - 4]. The mean number of live births is slightly higher among middle-altitude Kinnaura (5.14) as compared with high-altitude Kinnaura (4.49). The index of total selection intensity (I t ) calculated according to Crow is always lower than that of the Johnston and Kensinger index (I2), perhaps because of inclusion of embryonic deaths in the latter. It is also evident that differential mortality contributes more than differential fertility to the total selection intensity. The proportions of survivors from birth to reproductive age were found to be slightly higher for high-altitude Kinnaura (0.842), as compared with middle-altitude Kinnaura (0.832). Contrary to this, the proportions of pre-reproductive deaths were found to be higher among middle-altitude Kinnaura (0.168) as compared with high-altitude Kinnaura (0.158). On the whole, the proportion of survivors from birth to reproductive age was found to be 0.837 and the proportion of pre-reproductive deaths was 0.163. However, the proportion of embryonic (pre-natal) deaths varied from 0.007 to 0.033 [Table - 4]. It has been noticed that the total index of selection is higher among middle-altitude Kinnaura as compared with high-altitude Kinnaura, irrespective of the methodology used. However, all the estimates (as per Crow′s formulation) were below 1.18, as reported by Sphuler [8] for various populations. Discussion and Conclusion The present findings are compared with other Indian tribes as well as non-tribes of the Himalayan region and other parts of the country [Table - 5]. It reveals that this index [1] among the Kinnaura is moderate as compared with the other population groups. Among the Himalayan population, the highest was reported for Galong (I t = 1.07) of Arunachal, whereas the lowest was reported from Ahom (I t = 0.218) of Manipur. In the western Himalayas, the index was found to be highest for Baltis (I t = 1.02) of Jammu and Kashmir and lowest for the Bodhs (I t = 0.263) of Himachal Pradesh, whereas for all of Kinnaura, the index is computed to be I t = 0.384, which varies from I t = 0.370 (high altitude) to I t = 0.386 (middle altitude). Thus, Kinnaura show similarities with Muklom (I t = 0.315) of Arunachal Pradesh, Khamti (I t = 0.312) and Sonawal Kachari (I t = 0.360) of Assam, Swangal (I t = 0.339) of Himachal Pradesh, Ladakhi (I t = 0.34) as a whole, Dogra Rajput (I t = 0.313) of Jammu and Kashmir and Halba (I t = 0.388) of Madhya Pradesh. The overall Indian scenario shows that the Kota (I t = 1.367) have the highest selection intensity while Ahom (I t = 0.218) have the lowest index of total selection [Table - 5]. The correlation and regression analysis [Table - 6] between total index of selection (I t ) and fertility (I f ) and mortality (I m ) components for pooled data of populations of Indian Himalayan states [Figure - 3] and [Figure - 4], showing that I f and I m account for 21.6 and 29.1% variability, respectively, in the Crow′s total index of selection (I t ) along with a strong association that is significant at the 1% level. This indicates that mortality plays a greater role in natural selection in comparison with fertility among populations of the Indian Himalayas. Furthermore, the individual analysis for states [Figure - 5] and [Figure - 6] exhibit great variation, the least variability of fertility component (I f ) being noticed in Meghalaya (3%), followed by Jammu and Kashmir (5%), whereas the highest was noticed in Himachal Pradesh (76%), followed by Assam (55.3%), Uttaranchal (38.4%) and Arunachal (21.1%). Similarly, the least variability of the mortality component (I m ) on Crow′s total index of selection (I t ) was found to be in the state of Assam (2.8%), followed by Jammu and Kashmir (40.4%), whereas the highest was noticed in Uttaranchal (93.8%), followed by Himachal Pradesh (91.8%), Meghalaya (87%) and Arunachal (77.9%). In light of the above discussion, the findings of the present study indicate that Kinnaura have a moderate value of component of fertility (I f ), mortality (I m ) and mortality playing a greater role in natural selection over fertility, as is true to a majority of the Himalayan populations. The present findings do not show any great variation from the previous one, [29] but more or less support it, the average (0.361) of total index of selection being present closer to the present findings (0.384). It can be concluded that determinants of mortality among Kinnaura should be identified and targeted for reduction. The Department of Health and the Integrated Child Development functionaries must pay attention to reduce fetal loss and infant and child mortality. The improvement in health infrastructure and facilities in the remote areas may change the scenario. References
Copyright 2009 - Indian Journal of Human Genetics The following images related to this document are available:Photo images[hg09028t5a.jpg] [hg09028t5.jpg] [hg09028f2.jpg] [hg09028f1.jpg] [hg09028t6.jpg] [hg09028t5b.jpg] [hg09028t2.jpg] [hg09028t1.jpg] [hg09028t4.jpg] [hg09028f3.jpg] [hg09028f6.jpg] [hg09028t3.jpg] [hg09028f4.jpg] [hg09028f5.jpg] |
| |||||||||