 |
| About Bioline | All Journals | Testimonials | Membership | News |
|
||||||
|
||||||
Journal of Health, Population and Nutrition, Vol. 23, No. 3, Sept, 2005, pp. 250-258 Growth Patterns of Qatari School Children and Adolescents Aged 6-18 Years Abdulbari Bener1,2 and Abdulaziz A. Kamal3 1 Department of Medical Statistics and Epidemiology, Hamad Medical Corporation,
2 Department of Biomedical Sciences, University of Qatar, PO Box 3050, Doha, State of
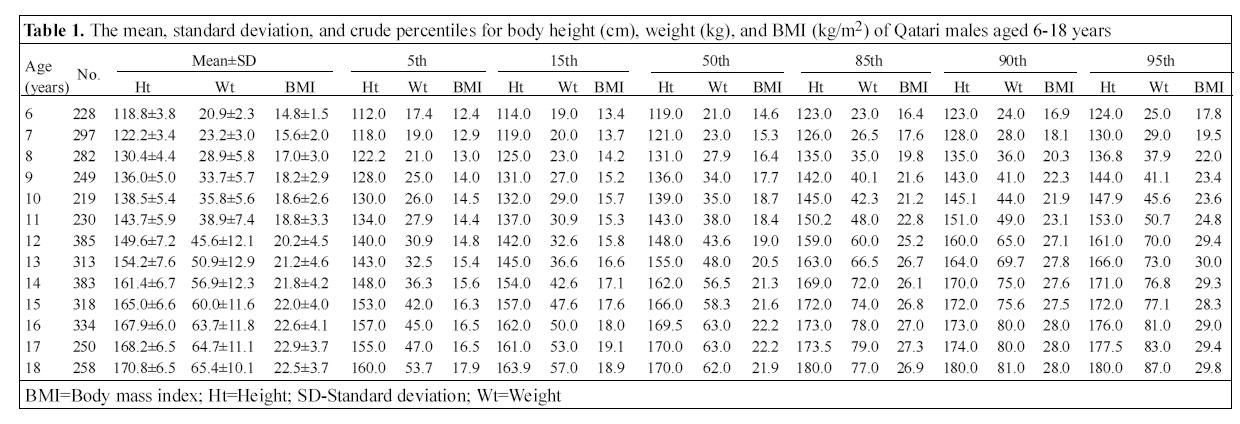
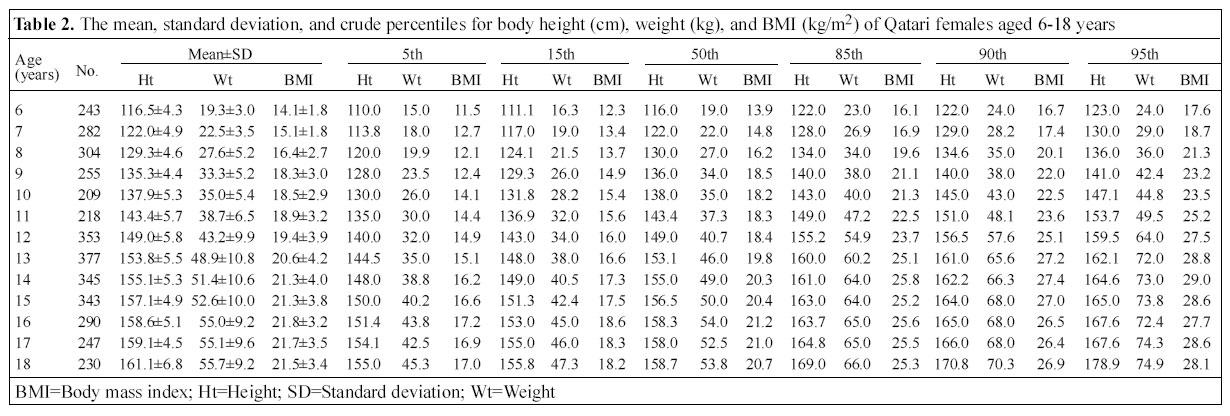
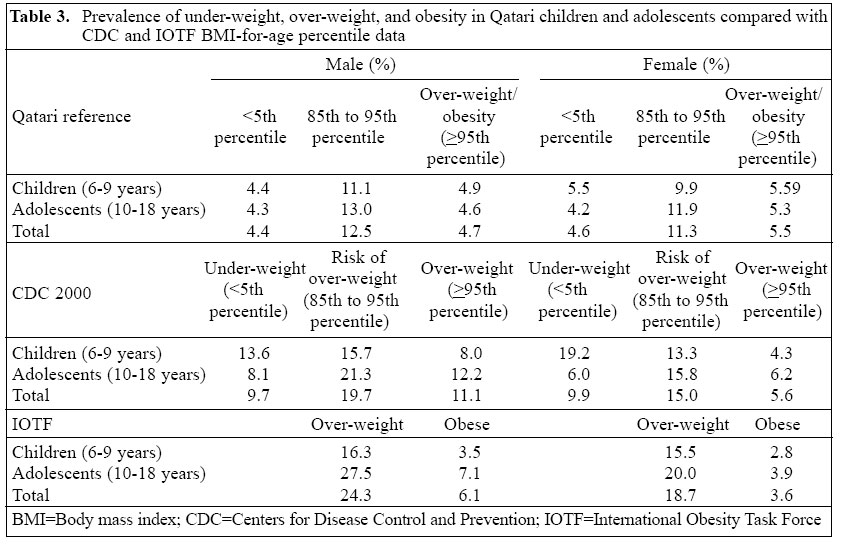
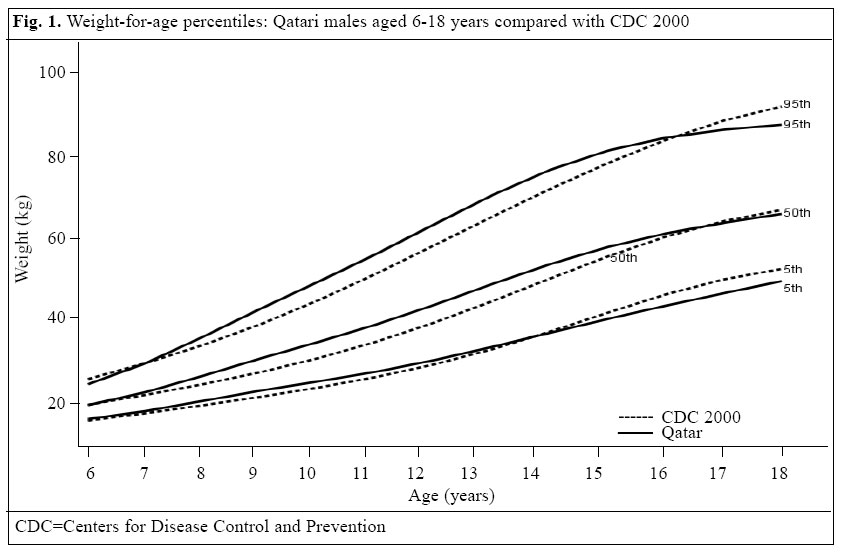
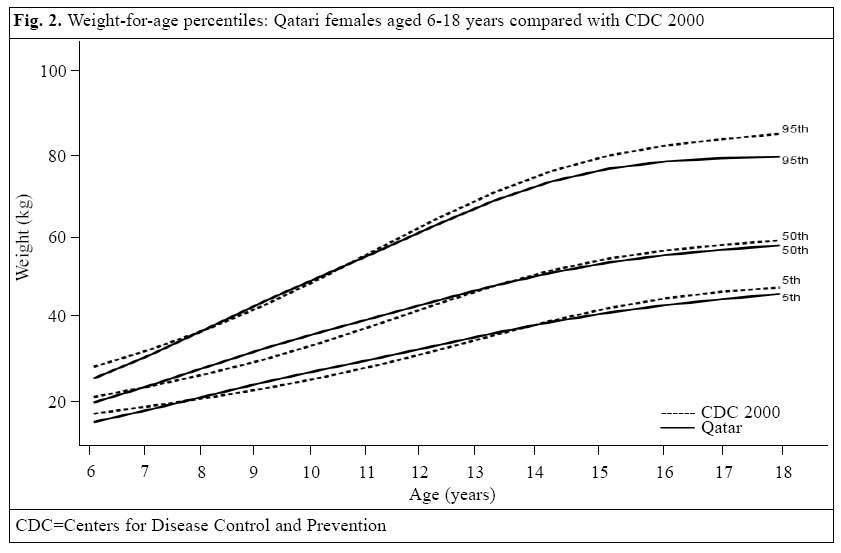
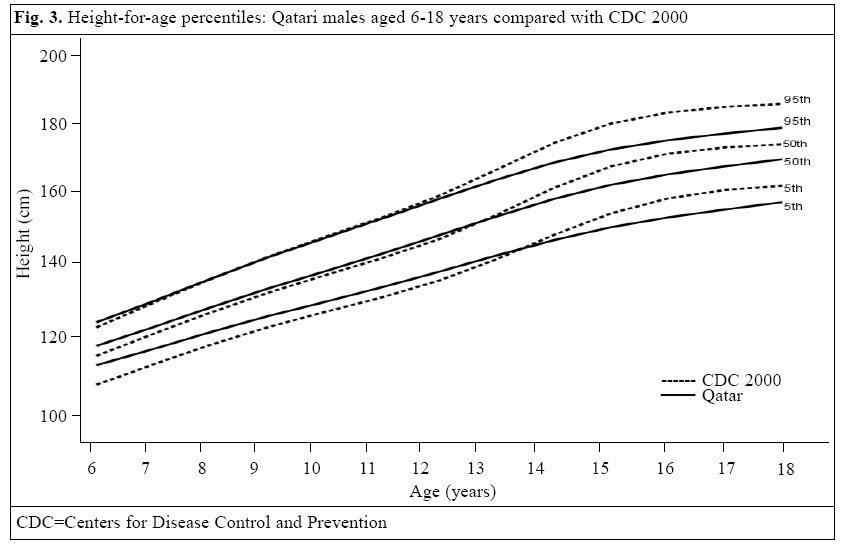
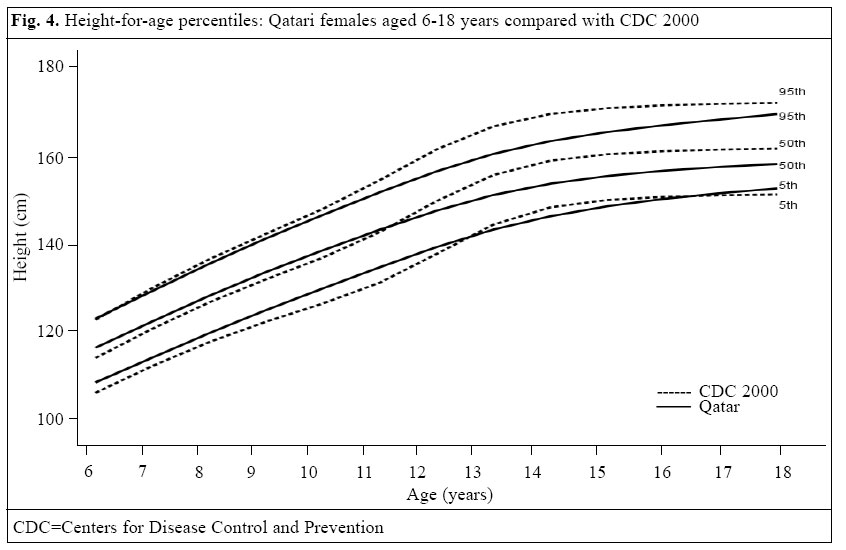
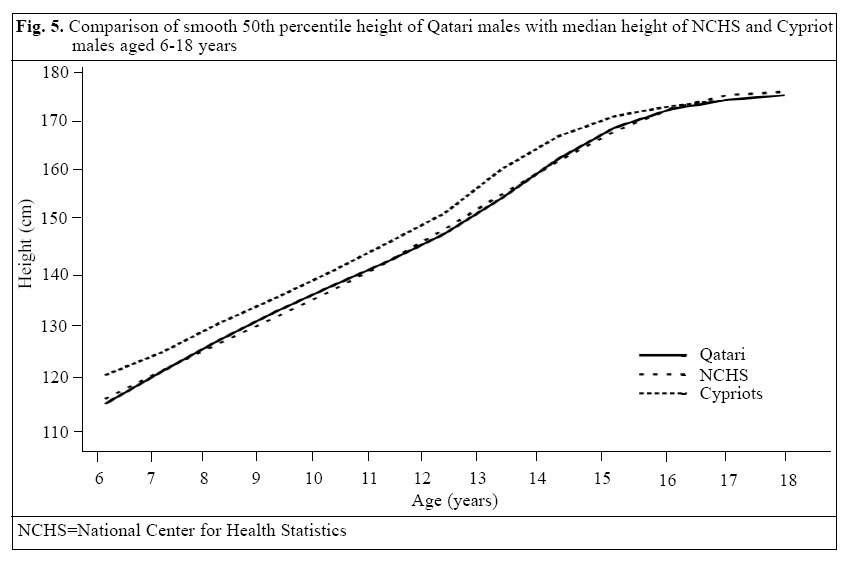
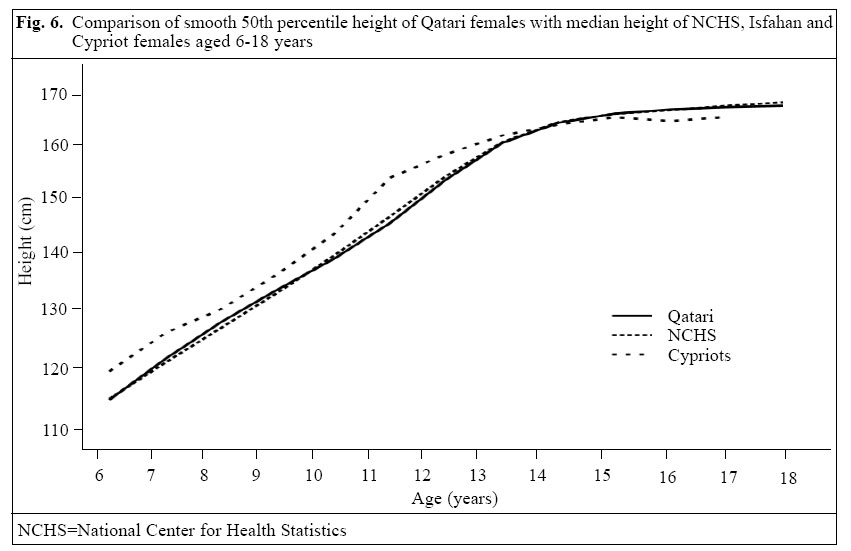
Qatar, and 3 Department of Psychology, University of Qatar, Doha Code Number: hn05032 ABSTRACT The study was conducted to analyze the patterns of growth in height and weight and the prevalence of over-weight among Qatari school children aged 6-18 years. Weights and heights of a cross-sectional sample of Qatari school children were measured. These children were selected randomly, in equal proportions of age and gender, from different schools from urban and semi-urban districts. Appropriate statistical procedures were performed to produce smooth percentile curves for boys and girls using a two-stage approach. Initial curve smoothing for selected major percentiles was accomplished by various parametric and non-parametric procedures. In the second stage, a normalization procedure was used for creating z-scores that closely matched the smooth percentile curves. The height and weight results were compared with the international reference values of National Center for Health Statistics/Centers for Disease Control and Prevention (NCHS/CDC) . The prevalence of over-weight was calculated using the new International Obesity Task Force (IOTF) reference. Of 7,442 Qatari children studied, 50.3% were male and 49.7% female. The mean values for height, weight, and body mass index (BMI) increased with the age for both boys and girls until the age of 18 years, except BMI, which stabilized at the age of 16-18 years at around 22.6 for boys and at 21.6 for girls. The growth patterns of the Qatari children, aged 6-18 years, appeared to be comparable with those of the NCHS/CDC reference. The weight-for-age centile curves of the Qatari boys tended to be superior to those of the NCHS/CDC reference until the age of 15 years, less so those of the Qatari girls. In contrast, the height-for-age centile curves of the Qatari children tended to deviate in a negative sense from the NCHS/CDC reference curves, for boys and girls from age around 11 years and 13 years respectively. The deviation of the smoothed median height-for-age curves from the reference in adolescence could most likely be attributed to a later maturation among the Qatari children. The prevalence of under-weight, over-weight, and obesity for the Qatari children was quite below the CDC and IOTF rates, except for girls aged 6-9 years. More males than females were over-weight or obese according to either the local, the CDC, or the IOTF reference, and the prevalence increased with age. A good percentage of the Qatari children was at risk of being over-weight, which needs more attention because the development of obesity results in different types of diseases associated with changes in body composition. Key words: Child growth; Growth charts; Anthropometry; Height; Body weight; Obesity; Child; Cross-sectional studies; Qatar Introduction Measurements of height and weight are important factors relating to growth and development, puberty, and nutritional status of children and adolescents. The 1977 National Center for Health Statistics (NCHS) growth charts for infants and older children have been widely used in assessing the nutritional and health status of children and in monitoring individual growth (1). In 1985, the NCHS began a process to revise the 1977 NCHS charts using improved statistical procedures and incorporated additional data from the second and the third National Health and Nutritional Examination Survey (NHANES) (2). Waterlow et al . recommended that, for the assessment of nutritional status in cross-sectional studies, primary reliance should be placed on height-for-age as an indicator of the past state of nutrition and weight-for-height as an indicator of the present state of nutrition (3). Height-for-age and weight-for-height are the primary indicators of nutritional status in children (3,4). They further suggested that the data recommended by the NCHS/Centers for Disease Control and Prevention (CDC) reference population are the most suitable for use as an international reference. Since no study on the growth patterns of Qatari school children aged 6-18 years has been conducted, we carried out a national survey to develop growth charts for school children. The main purpose of the study was to assess the physical growth of school children in the State of Qatar by comparing with the NCHS/CDC reference population. Materials and Methods A cross-sectional growth survey was conducted during September 2003 - May 2004 using a multi-stage stratified random-sampling technique. The State of Qatar, mainly an urban country with a land area of 11,493 sq km, had an estimated population of 724,125 in 2003. Thirty percent of them were estimated to be nationals. The country is divided into 22 socioeconomically urban and semi-urban districts. During the academic year 2003/2004, the number of Qatari students in the government schools in the age group of 6-18 years was 45,354. The target sample size was 17% of the total Qatari students aged 6-18 years (7,800 students) registered for the school year 2003/2004 with 300 Qatari students in each age-sex group. Schools, selected from urban and semi-urban districts proportionally, were divided into three educational levels (primary, intermediate, and secondary), and the sample was adjusted proportional to these levels from each school from school records by the systematic sampling technique. Cross-sectional data for the study were obtained from weight and height measurements of Qatari school children who were selected from different urban areas. Since the Government of Qatar bear all the expenses of education of Qataris, 90% of them go to school. All the studied subjects were in good health and had no serious health problems. The difference in socioeconomic status was defined from the household income, living condition, and number of people living in the house. Moreover, there are no disadvantaged or under-served groups in Qatar. Resources for healthcare and other facilities have been distributed equitably in such a way that everyone has reasonable access to healthcare services and facilities. Of the 7,800 students approached for the present study, 7,442 (95.4%) responded to the questionnaire. In total, 358 questionnaires were excluded from the study due to incomplete answers and extreme outliers. The survey team comprised nurses working in school clinics. Data and anthropometric measures of Qatari school children were collected and taken at school clinics by qualified and well-trained nurses. A standard questionnaire was designed for recording their socio-demographic and anthropometric measures. These nurses conducted face-to-face interviews with those who met the eligibility criteria. The field survey was programmed for taking growth measurements of selected Qatari children. To minimize errors in measurement, weighing scales were checked before each session as the unloaded scale registers zero. Standing height was measured using a Stadiometer (Harpenden, UK), and weight was measured using a beam balance for children. The beam balance was frequently checked by a known-weighing object. While measuring weights, the children were asked to remove heavy clothing and shoes. The weight was measured in gramme and later converted to kilogramme with a precision of two decimal places. Height was measured as the distance between two flat surfaces using a Stadiometer attached to the weighing scales. The students stood straight, bare-footed with heals, buttocks and back touching the Stadiometer. The horizontal in-dicator of the Stadiometer was then lowered until it was firmly touching the crown of the head. Height was measured in centimetres and later converted to metre with a precision of two decimal places. The dates of birth were collected from the birth certificates of students, which were given to the school authorities at the time of admission. School clinics have complete records of Qatari students studying in that school. Age was recorded by calculating the difference between the date of interview and the date of birth. The age-group was defined as follows: the six-year group included 6.0 years to 6.99 years and the seven-year group included 7.0 years to 7.99 years, and so on. Body mass index (BMI) was calculated by dividing the weight measured in kilogramme by the square of height measured in metre. Under-weight was defined as BMI < CDC 5th percentile. Over-weight was defined as BMI ≥ CDC 95th percentile, and those who fell between 85th and 95th percentile were considered to be at risk of over-weight. Statistical analysis Data were entered and processed in the IBM computer using SPSS (Statistical Package for Social Sciences) (5) and LMS (L=Skewness, M=Median, S=Coefficient of variation) software (6,7). Anthropometric data were statistically analyzed in the Department of Medical Statistics and Epidemiology, Hamad Medical Corporation, University of Qatar, Doha. The LMS computer program fits smooth centile curves to reference data using the LMS method described by Cole (6,7). Charts with 5th, 50th, and 95th smoothed percentile lines, each for boys and girls, were plotted and compared with the CDC 5th, 50th, and 95th percentile. With the exception of stature, which tends to be normally distributed, for most other anthropometric measures - neither empirical nor smoothed data - strictly follow a normal distribution. The final set of percentile curves presented in this paper was produced using the modified LMS estimation procedure (6,7). The percentile height-for-age, weight-for-age, and BMI-for-age were presented as 5th, 15th, 50th, 85th, 90th, and 95th in the form of tables. The source of reference population to which comparisons were made was the NCHS/CDC 2000 data as recommended by the Nutrition Unit of the World Health Organization (8,9). The centile distribution of weight-for-age and height-for-age of children in relation to the reference population and their z-score (standard deviation score) distributions were constructed. The individuals with values outside the range of -6 and +6 SD in height-for-age and weight-for-age and -4 SD and +6 SD in weight-for-height were excluded (10). Results Of the 7,660 students, the study analyzed the data of 7,442 students, with 50.3% boys and 49.7% girls. Table 1 reveals the sample size in each age and their mean±SD for all anthropometric measurements for boys aged 6-18 years. Their crude percentiles (5th, 15th, 50th, 85th, 90th, and 95th) of height, weight, and BMI are also shown in the table. The mean values for height, weight, and BMI increased with the age of boys, except BMI in boys aged 18 years. Table 2 shows the sample size in each age and their mean±SD for all anthropometric measurements for girls aged 6-18 years. Their crude percentiles (5th, 15th, 50th, 85th, 90th, and 95th) of height, weight, and BMI are also given in the table. Although the mean values for height, weight, and BMI increased with the age of girls, there was a slight decrease in BMI in the age- group of 17-18 years. Table 3 shows the comparison of prevalence of under-weight, over-weight, and obesity in Qatari children and adolescents with CDC and IOTF BMI-for-age percentile data. The prevalence of under-weight, over-weight, and obesity for the Qatari children was quite below the CDC and IOTF rates, except for girls aged 6-9 years. Figures 1 and 2 show the comparison in smooth 5th, 50th, and 95th weight-for-age percentiles of the Qatari boys and girls with the CDC 5th, 50th, and 95th percentiles. The weight-for-age centile curves of the Qatari boys tended to be superior to those of the NCHS/CDC reference until the age of 15 years, less so those of the Qatari girls. Figures 3 and 4 show the comparison in smooth 5th, 50th, and 95th height-for-age percentiles of the Qatari boys and girls with the CDC 5th, 50th, and 95th percentile. The height curves of the CDC and Qatari children were very close until the age of 13 years, but after the age of 13 years, the CDC children were taller than the Qatari children. Figures 5 and 6 show the comparison of smooth 50th percentile height of the Qatari children with the median height of NCHS and Cypriot curves. The median height curve of the Qatari children was very close to NCHS. The difference between them was negligible (11). Discussion It is known that adequate nutrition is needed for nor-mal growth during the childhood and adolescence period. Growth charts have been used by paediatricians, physical anthropologists, and physical educators to track the growth of children and adolescents (10,13). The growth charts consist of a series of percentile curves that illustrate the distribution of selected body measurements in children. Growth charts are not intended to be used as a sole diagnostic instrument. Instead, these are the tools that contribute to forming an overall clinical impression for the child being measured (14). The Isfahan Endocrine Resarch Centre, University of Medical Science, Iran, carried out an anthropometric evaluation in 6-17-year old female students (12), and it was found that the height curves can be approximately super-posed on those of the NCHS growth charts, but American girls were significantly taller than Isfahani girls after the age of 14 years. However, the growth patterns among Isfahani female students have improved when compared with those of their fellow citizens 22 years earlier. Improvements in nutrition, health services, or other unknown environmental factors may have contributed to an increase in the growth indexes. This shows that revising the growth chart periodically will provide an improved tool for evaluating the growth of children in clinical and research settings. A similar finding was found in our study, which showed that the CDC girls were taller than the Qatari girls after the age of 13 years. Results of a comparison of body weight and height of Israeli school children with the CDC and prevention growth charts prepared by the Bar-Han University and Sheba Medical Centre in Israel (15) suggest that the CDC growth charts are adequate for assessing Israeli children and slightly better than the current standard. Thus, in the absence of local standards, we recommend the use of the revised CDC growth charts, which include the additional BMI measures. It was also observed in our study that the height-for-age centile curves of the Qatari children tended to deviate in a negative sense from the NCHS/CDC reference curves, for boys and girls from age around 11 years and 13 years respectively. We have developed the growth charts for Qatari girls and boys aged 6-18 years as a clinical tool for health professionals to determine if the growth of a child is adequate. This is the first study conducted at a national level on growth chart for Qatari children. The growth chart of our present study is based on a cross-sectional data representing Qatari school children. Reliable growth charts are not available in most countries due to lack of an adequate database. It was observed in our growth charts that the boys were significantly taller and heavier than the girls in all ages. The general tendency for boys to weigh more than girls is similar to the growth patterns recorded in other studies (1,4,16). The BMI-for-age chart is used for judging whether the weight of an individual is appropriate for his/her height. BMI is the most commonly-used approach to determine if adults are obese and is also the recommended measure to determine if children are over-weight. In recent years, the BMI-for-age chart has received increased attention for paediatric use. The results of the study showed that 4.4% of the males and 4.6% of the females were under-weight, whereas 4.7% of the males and 5.6% of the females were obese. The prevalence of under-weight and over-weight of the Qatari children was lower compared to the CDC reference, except for the girls aged 6-9 years, in relation to obesity. More males than females were over-weight or obese according to either the local, the CDC, or the IOTF reference, and the prevalence in-creased with age. The growth patterns and physical charts of the Qatari school children revealed that their median height was very close to the curve of NCHS. A good percentage of the Qatari children was at risk of being over-weight, which needs more attention because the development of obesity results in various types of diseases associated with change in body composition. Nevertheless, the height, weight, and BMI percentiles will act as a baseline for further observation and research. Acknowledgements The study was funded and supported by the Qatar Nation-al Bank and Hamad Medical Corporation, Doha, State of Qatar. References
© 2005 ICDDR,B: Centre for Health and Population Research The following images related to this document are available:Photo images[hn05032f3.jpg] [hn05032f6.jpg] [hn05032f4.jpg] [hn05032f1.jpg] [hn05032f2.jpg] [hn05032t1.jpg] [hn05032t3.jpg] [hn05032f5.jpg] [hn05032t2.jpg] |
| |||||||||
