 |
| About Bioline | All Journals | Testimonials | Membership | News |
|
||||||
|
||||||
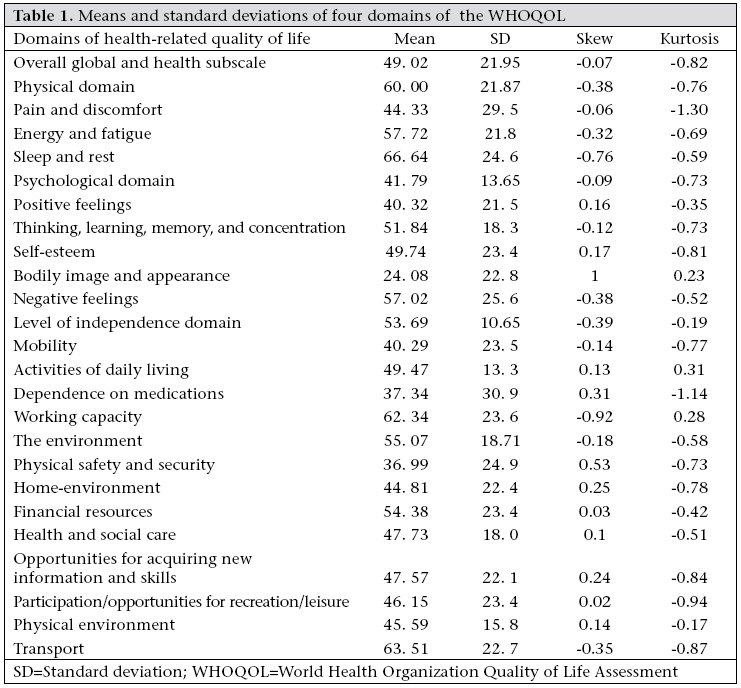
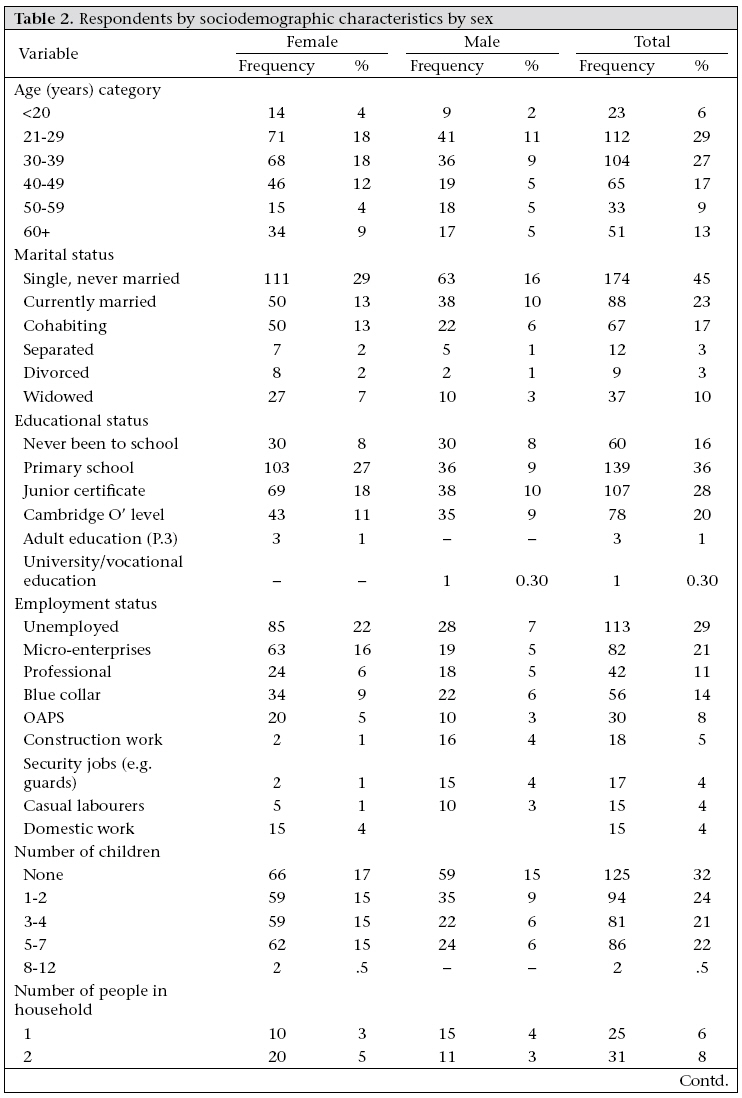
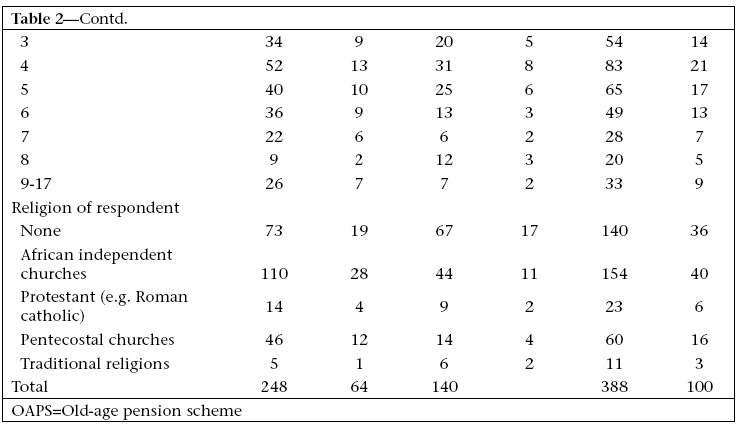
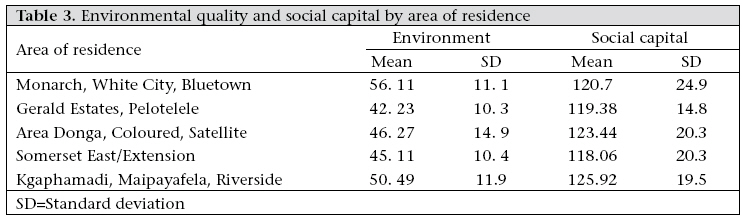
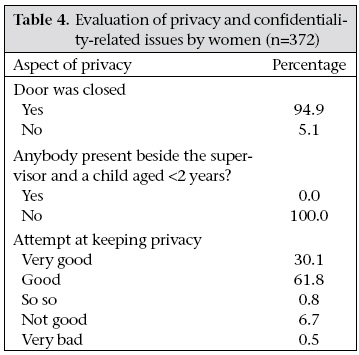
Journal of Health, Population and Nutrition, Vol. 27, No. 4, Aug, 2009, pp. 462-476 Does Level of Social Capital Predict Perceived Health in a Community?—A Study of Adult Residents of Low-Income Areas of Francistown, Botswana Tirelo Modie-Moroka Social Work Department, University of Botswana, Private Bag 0022, Gaborone Code Number: hn09046 ABSTRACT This study explores and describes the relationships among neighbourhood characteristics, social capital, and health outcomes among low-income urban residents in Francistown, Botswana. Using an explanatory correlational research design to explore the relationships among the study variables, data were collected from 388 low-income urban residents in Francistown, Botswana. The study further examined the role of social capital on the environmental quality for the overall health and quality of life and the psychological, physical and level of independence domains of health. Several studies have explored these relationships but currently no study has explored this relationship in Africa and Botswana in particular. Selected concepts from social capital theory and stress theory were used as a conceptual framework. Using linear and multiple regression models, results of the study showed that social capital did not correlate with the overall health and quality of life and the level of independence domain of health but positively correlated with psychological well-being. Social capital negatively predicted physical health. Hierarchical moderated multiple-regression analyses were conducted to examine the moderating role of social capital. To the contrary, social capital did not moderate the effects of chronic community stressors on all health outcomes. Social capital, however, moderated the effects of the poor environmental quality on level of independence and physical health outcomes but not on the psychological and overall health and quality of life. These results underscore the importance of considering the role of social capital, especially in low-income communities. Key words: Cross-sectional studies; Environmental quality; Health status; Social capital; Social exclusion; Botswana INTRODUCTION There is a growing interest in the role played by the community context or neighbourhood characteristics, or ‘the place’ in shaping health outcomes (1-3). Whereas, most population-based medical research has often focused on individual risk factors, such as life-style, diet, cholesterol, smoking, lack of exercise as the major contributory factors to disease, increasingly; this focus has been shifted to the community or neighbourhood context (1-4). Most research in medical sociology has found evidence to link social conditions as antecedents of disease outcome in the causal chain. Link et al. and Coken et al. emphasize that the focus should be on the social conditions which are the ‘distal causes’ of disease (4-5). The central message is that focusing on the individual risk factors deflects the beam from the real upstream factors that are antecedent to onset of disease. By ignoring the role of the community context in shaping health outcomes, individual-level indicators are less reliable in reflecting a holistic picture of human well-being. Results of most recent studies concerning the impact of concentrated poverty environments on health outcomes indicate that community characteristics have an impact on most members of a community, irrespective of the socioeconomic status of the individual (3,6-8). High levels of neighbourhood problems, such as pollution, poor weather, noise, unsafe areas, smells, fumes, and litter, contribute to stress that has negative health consequences. Global overview of urbanization Urbanization, poverty, and sustainable development have become very important topics at the global level. In 1999, 75% of Latin America was urbanized; in the Middle East and North Africa, urbanization was at 58%; in South Asia, it was 28%; and in sub-Saharan Africa, urbanization was 34%. Recently, the United Nations General Assembly elevated the United Nations Centre for Human Settlements (UNCHS) to the status of a full-fledged programme, now referred to as United Nations Settlement Programme because of the challenges involved in urbanization (9,10). The rate of urban growth in developing countries has been estimated to be higher than that in more developed countries (11-14). There were 330 million urban poor in 1988 in the developing world, distributed as follows: Africa–56 million; Asia–137 million; Latin America and the Caribbean–77 million; and other regions–60 million. By 2005, the majority of the world population would be living in urban areas (9,10,12,15). According to UN projections, the world’s total urban population will have risen to 4.54 billion in 2025, an increase of 1.69 billion people (16). According to the UN, urban dwellers are vulnerable to global forces, manifested by growing polarization and exclusion, a visibly increasing poverty, and a widening gap between the rich and the poor. As a result, squatter settlements, slums, and shantytowns have become commonplace in most developing countries (12). Sub-Saharan Africa and urban poverty According to the UNCHS, Africa (which has remained predominantly agrarian for the most part) would also face an explosive demographic shift from rural to urban areas in the next 10 years (13). In sub-Saharan Africa, rapid urbanization and industrialization became a major feature immediately after Independence in the late 1950s and early 1960s. Most cities had been newly established (or newly refurbished) as centres of trade and administration during the colonial era. Residents seeking a better life moved rapidly from the deteriorating agricultural sector because of droughts, overgrazing, and soil-erosion. As a result, the African continent experienced rapid urban sector growth and ultimately was recorded as a continent with the highest rate of urbanization worldwide (12,17). For the most part, African societies have slowly transformed from agricultural to agro-industrial states. The population in urban settlements in Africa has increased substantially. According to the United Nations Development Programme (UNDP), sub-Saharan Africa has the highest proportion of urban growth and the fastest growth in human poverty (18). Hope and Lekorwe noted that “although cities may be catalysts of economic growth, [they] ... have been the major contributor of urban poverty and environmental degradation” (19). About 18-24% of the population in South Africa, 25% of the population in Ethiopia, and 22-37% of the population in India have been living in chronic poverty for more than five years (10). The World Development Report noted that nearly half of the people in sub-Saharan Africa are living in conditions of extreme poverty, where people live on the amount equivalent of U$ 1 a day or less (20). The UNCHS also noted that, in the past 20 years, there has been ‘‘massive transfer of poverty from rural to urban areas ... indicators of distribution of wealth and socioeconomic disparities have, unfortunately, continued to increase social segregation” (10). It is estimated that 15-65% of African urban dwellers live in poverty. For example, the number of the urban poor in Nigeria rose from 9.7 million in 1985 to 11.9 million in 1992. Urban poverty is partly a reflection of rural poverty. An estimated 20-25% of the active population (aged 15 years and over) in major African cities is unemployed (21). Most of the group that comprises the young, welleducated but unemployed population are aged 15 -24 years. Urbanization in most of Africa, and Botswana in particular, originated as a response to the economic and administrative needs of the metropolis during the colonial times. Urban areas were constructed to coordinate the commercial and administrative activities of British colonial power. Ruralurban migration, which is partly responsible for the growth of cities in Africa, is usually perpetuated by hopes for a better life in cities and towns (22-26). The interaction between economic and political factors denied ‘squatter dwellers’ the choices that people from the middle-and upper-income class have. Unequal distribution of economic resources, the marginalization of segments of the population and informal activities, and their exclusion from planned and serviced areas force people to live in poor and shanty parts of towns where access to basic services is a problem. Life in urban centres has resulted in new social concerns that all too often go unmet. Without basic services, secure tenure, and formal employment opportunities, these poor urban settlements offer residents little hope of improving the quality of people’s lives (13). The marginalization of segments of the population and their exclusion from planned and serviced areas force people to live in the shanty parts of towns, where basic public serv-ices are inadequate, if these exist at all. This has had a substantial impact on the quality of life of many urban residents. At the same time, the urban population has been increased by large numbers of illegal immigrants, especially in countries that border with those countries that are going through political and economic hardships. The greatest challenge of all, however, will remain the increasing spread of the HIV/AIDS virus. According to Hope and Lekorwe, the environmental impacts of urbanization are diverse, covering “inadequacy in physical infrastructure, and services, the health consequences of crowding and increased exposure to concentrated wastes, unsustainable resources consumption and greater settlement on environmentally fragile lands” (19). Residents of low-income areas are often exposed to a higher incidence of infectious diseases, including HIV/AIDS and may be subjected to unlawful forced evictions on a regular basis, such as the case in Botswana (12). Botswana, urbanization, and poverty Botswana, a country that lies in the southern part of Africa, has experienced a share of urban problems, such as squatters and low-income urban settlements—partly as a result of rapid urbanization and industrialization in the past 36 years since Independence. This urban explosion is the outcome of both a natural increase in population and ruralurban migration. The livelihood and quality of life for many people in urban areas in Botswana have also deteriorated significantly over the years (24). Despite efforts to address the substandard living conditions in low-income urban areas, these problems have continued to grow (20,22,24). These poor living conditions are potentially stressful to the residents and likely affect their health. In this study, the focus is on the city of Francistown, which lies in the north-eastern part. This city was chosen to enable one to undertake a far more in-depth approach to understanding the health environment connections in low-income urban Botswana. Lowincome settlements, such as those found in Francistown, often have environmental conditions that are potentially stressful to individuals’ lives. Despite the proliferation of research on Africa in areas, such as economic development, civil wars, fertility, religion, and the family, scholarship on the lives of people living in low-income urban areas and the influence of such conditions on health outcomes remains fragmented. This is due to the dominant focus on rural poverty and povertyalleviation strategies. Little is known, therefore, about the impact of poor urban conditions on the health status of the residents in an African context and in Botswana specifically. There is, therefore, a need to explore the relationship between living in low-income areas and health outcomes using a multi-level, multi-model approach. This study was intended to serve that purpose. Recently, attention also shifted increasingly to the positive role of social capital, a resource produced when people cooperate for mutual benefit, in influencing the health outcomes. A large and growing body of literature points to certain features of social organization, such as norms of reciprocity, social trust, collective efficacy, a sense of community, and participation in joint community activities, as predictors of positive individual and collective outcomes. Conditions that hinder the availability of social capital in a community and its members are perceived to have a negative effect on the health and well-being of the members of that community. These negative effects on health and well-being may then have effects on the health of the community as a whole. The primary aim of the study was to examine the role of the poor environmental quality among low-income urban dwellers in Francistown, Botswana and further examine the possible buffering role of social capital on all health outcomes. The current study hypothesized that chronic community stressors and environmental quality stressors determine the overall health status and quality of life and other domains of health, such as physical, psychological, and level of independence and that social capital would buffer the effects of chronic community stressors and environmental quality stressors. A few studies that have examined the relationship between community characteristics and health have considered the direct and the ‘buffering’ role of social capital in poor environmental quality. Most research has been conducted at an individual level and with individuals in the developed world, such as the USA, Australia, and European countries. Increasingly, there has been a growing interest in the generalizability of these linkages to developing countries. Studies that explored social capital at the community level within a developing-country context were conducted in India and Tanzania (2527) but the criterion variables were development outcomes and household income respectively. The theoretical framework for this study draws on both stress theory and social capital theory to delineate the effects of environmental quality. MATERIALS AND METHODS Research design and sample The study employed a cross-sectional quantitative, explanatory design and used primarily close-ended interviews with a random sample of 388 lowincomeresidents.Theunitofanalysiswasresidents, aged over 18 years, who live in low-income areas, otherwise referred to as ‘makeishane’ or ‘locations’. The population was organized into a number of non-overlapping regions called clusters. The population units were selected by first selecting some clusters and then selecting household units within those clusters. Little data are available on the number of people who live in low-income areas but it is clear that the proportion has increased due to shortage of available housing for low-income dwellers in better areas. From each zone or geographical cluster, five areas were randomly selected (28). From each area, one in every three households was selected by systematic sampling with a random starting point. Classifications were based on the 2001 National Population Census and recent reclassification by the Francistown City Council Housing Department. Since people cluster in households, within each cluster, a household was selected first, and then the prospective respondent was selected from within that household. There was no reliable sampling frame with a listing of all the areas and households in them. The sampling interval was determined by dividing the estimated number of households in the list by the desired sample size (28). The results of this procedure gave the researcher the ‘kth’ element, which means that the researcher counted down the number of elements after starting from the case chosen as the random starting point (28). In this method, every third household was randomly chosen for inclusion in the sample. The prospective respondent in the household list was determined after drawing a list of all respondents aged over 18 years and picking the name of one person using the simple random-sampling method. An inperson field approach was deemed more reliable. This method ensured that every area, every household, and every resident had an equal chance of being selected throughout the process. An interview questionnaire consisting of primarily closed-choice questions was administered to the research participants. Although the questionnaire was designed to be easy to read and comprehend, most respondents would have difficulty with it because of literacy levels. We trained five research assistants to familiarize them with the instruments, the aims of the study, ethical issues, the profile of the questionnaire used, and coding procedures. The questionnaire was translated into Setswana and Ikalanga languages and back-translated into English with the help of local language speakers. All sets of questionnaire were pilot-tested before using these in the study. About 388 respondents were interviewed. Only seven potential respondents—four women and three men—refused to participate. The study had a 98% response rate. Interviews took one and a half hours. Human subjects issues Approval for the study was obtained from the Office of the President, Republic of Botswana and the University of Pittsburgh Institutional Review Board. Despite the difficulty of implementing this because of the problem of overcrowding and the sharing of rooms in low-income areas, privacy was safeguarded in all instances. Where possible, interviews were held outside the room, at a safe distance. Since the study was conducted during the rainy season, some interviews were postponed several times; if there was no place, the interview could be held without compromising privacy. The probability of harm occurring because of participation in this study was estimated as minimal. The participants were informed that the questionnaire and the interview would ask for information about their health, education, work history, drug and alcohol-use, and experiences of physical, sexual and emotional abuse. They were further informed that some questions could be intrusive and bring back painful memories, which could result in anger, fear, and bitterness. The respondents were informed also that they were free to withdraw from the study at any time if they felt that the questions were intrusive. A special protocol was developed to address any unanticipated harms. The respondents were also given the opportunity to ask questions during the interview. Participation in the study did not result in any financial costs to individuals because they were followed to their homes for the interview, as customarily accepted. They were informed that this study could benefit them by sensitizing the policy-makers about their situation, who could then work towards the amelioration of their poor-living conditions. This was a potential longterm benefit. Instruments/measures The World Health Organization (WHO) Quality of Life [WHOQOL] measure: the physical domain scale Quality of life is a multi-dimensional concept that encompasses a cognitive evaluation of the physical, emotional and social components of one’s life. The Constitution of the WHO has defined health as “a state of complete physical, mental and social well-being and not merely the absence of disease or infirmity” (29). According to the WHO, the measurement of health and the effects of healthcare must include an estimation of one’s well-being across the different areas (domains) as stated in the definition. Quality of life deals with an individual’s perception, satisfaction, contentment, aspirations, happiness, and other areas of social, personal and occupational significance, based on current and previous living and health status (30). The WHOQOL Group defined health–related quality of life as an “individual’s perception of their position in life in the context of the culture and value systems in which they live and in relation to their goals, expectations, standards and concerns. It is a broad ranging concept affected in a complex way by the persons’ physical health, psychological state, and level of independence, social relationships and their relationship to salient features of their environment” (31). This conceptual definition was adopted for this study. The WHO designed the WHOQOL-100 measure to assess one’s quality of life in relation to health status and healthcare. The WHOQOL measure has Likert-type scale questions. The measure has an international core of 100 items, covering 24 facets of quality of life. There are questions that specifically target specific domains of health-related quality of life. Facet and domain scores: Previous studies by the WHOQOL Group have come up with (a) six domain scores, (b) 24 individual facet scores, and (c) an overall quality of life and general health perceptions score (based on the four global questions) (31-33). A facet is described as “a behaviour (e.g. walking), a state of being (e.g. vitality), a capacity (e.g. the ability to move around), or a subjective perception or experience (e.g. feeling pain)” (33). Generally, to achieve comparability between domains in the range of possible scores, domain scores are calculated by summing the facets within each domain and dividing the summed facet scores by the number of facets within the domain, according to the directions provided in the manual for syntax table and guidelines of all summations). Facets were scored through simple summative scaling as directed in the WHOQOL guidelines. Each question contributes equally to a facet score. Each category is assigned a numeral between one and the highest number (e.g. 1 to 5) on the respective score having the greatest strength. Each facet has four questions. Physical domain: The physical domain includes questions that deal with pain and discomfort, sleep and rest, and energy and fatigue. The pain and discomfort facet explores “unpleasant physical sensations experienced by a person and the extent to which these sensations are distressing and interfere with life” (31:4). The sleep and rest facet “concerns how much sleep and rest, and problems in this area, affect the person’s quality of life” (31). The energy and fatigue facet “explores the energy, enthusiasm and endurance a person has top perform the necessary tasks of daily living as well as other chosen activities such as recreation” (31). Some facet questions that comprise the physical domain are “How often do you suffer (physical) pain?”, “Do you worry about your pain or discomfort?” and “How difficult is it for you to handle any pain or discomfort?” The pain and discomfort facet was negatively framed, and scores on these facets were reverse-coded. These three facets are summed together to make up the physical domain. The physical subscale has 12 items. The scores ranged from 6.25 to 95.83, which indicate that there was variability in the physical health status of respondents. The mean score was 60.0 (standard deviation [SD]=21.9). Psychological domain: The psychological domain is made up of facet questions that include questions about feelings (both positive and negative), thinking, learning and concentration, self-esteem, and perceptions of body and appearance. The selfesteem facet “examines how people feel about themselves” (31). The bodily image and appearance facet “examines the person’s view of his/her body and their satisfaction with how it looks” (31). The negative feelings facet explores any negative feelings, such as blue mood, despair, anxiety, and depression, and how these interfere with everyday functioning. The negative feelings facet is worded negatively, such that high scores denote the poorer quality of life. Some examples of facet questions that comprise the psychological domain are “How much do any feelings of sadness or depression interfere with your everyday functioning?”, “How much do any feelings of depression bother you?”, and “How much do any feelings of sadness or depressioninterferewithyoureverydayfunctioning?” These three facets are summed together to make up the psychological domain. The psychological subscale has 20 items. The scores ranged from 7.50 to 72. 50. The mean was 41.79, (SD=13.7). Level of independence domain: The level of independence domain is a measure of incapacitation, mobility, disablement, or level of functionality. It is composed of mobility, activities of daily living, dependence on medications, and working capacity facets. Some items on the level of independence domain are “How well are you able to get around?”, “To what extent do you have difficulty in performing your routine activities?”, and “How much are you bothered by any limitations in performing everyday living activities?” Possible scores ranged from 0 to 100. The level of independence subscale has 16 items. The scores ranged from 18.75 to 75.69. The mean score was 53.69 (SD=10.4). Environmental quality domain: The environmental domain is a measure of the quality of one’s living environment. It is composed of the following facets: access to health and social care; opportunities for acquiring new information and skills; the quality of the physical environment; safety and security; and home-environment, financial difficulties, and participation in and opportunities for recreation/leisure. The opportunities for acquiring new information and skills facet “examines a person’s opportunity and desire to learn new skills, acquire new knowledge and feel in touch with what is going on.” The health and social care facet “examines the person’s view of the health and social care in the near vicinity. ‘Near’ is in relation to the time it takes to get help” (31). Some facet questions for the environmental domain are “Do you feel you are living in a safe and secure environment?” and “How much do you worry about your safety and security? These six facets are summed together to make up the environmental domain. The environmental domain subscale has 32 items. The scores ranged from 11.72 to 79.69. The mean score was 47.84 (SD=11.9), suggesting that, generally, the quality of the environment was lower than average. The environmental domain was used as an independent variable, alongside the chronic community stressors. Table 1 shows the means and standard deviations of four domains of the WHOQOL. Perceived social capital scale Social capital is a multidimensional concept that incorporates different concepts, such as trust, strength of civic associations, reciprocity, social care, community integration, cohesion, and participation in organizations. This measure included two measures of social capital: a subjective measure of perceived social capital and the objective inventory measure of community participation in community organizations. The perceived social capital measure explored community trust, collective efficacy, community concern, and people in general. The unit of analysis was the community as perceived by individuals. The perceived social capital measure was designed based on the works of Narayan and Pritchett of a measure of social capital in rural Tanzania and Krishna measure developed for rural India. The measure explores an individual’s perception of community integration, trust, strength of civic associations, and personal involvement in the community (34-36). The scale has 37 items with Likert-typescales(1=Stronglydisagreeto5=Strongly agree) with high scores, indicating high social capital. Some items on the scales are “If there is a problem in this community, people here can get it solved”, “My neighbours would intervene if a fight broke out”, and “Community members participate in voluntary work aimed at improving conditions in the community.” Reliability of the scale in the current study is 0.81. The possible scores ranged from 37 to 185. The mean score for social capital was 122.81 (SD=20.46). The scores from the study ranged from 49 to 174. Generally, results suggest that residents of these low-income areas perceived their communities to have high social capital (mean=125.92, SD=19.5). Generally, results suggest that residents of lowincome areas perceived their communities to have high social capital (mean=125.92, SD=19.5). A oneway analysis of variance (ANOVA) was conducted to evaluate whether the five communities differed significantly from one another in terms of their perception of social capital in their respective communities. Using the Tukey multiple comparison test, the ANOVA showed that the five communities did not differ significantly from one another [F (4, 383)=1.889, p=0.112]. Table 1 also shows the differences in chronic community stressors, the environmental quality, and social capital across communities. Results suggest that Kgaphamadi, Maipayafela, and Riverside scored higher on social capital and lower on the environmental quality. RESULTS Sociodemographic characteristics of the sample The participants were asked to indicate their age, marital status, income, employment, religion, housing quality, educational status, number of people in the house, migration status, rural-urban linkages, ownership of property in rural areas, and alcohol and smoking habits. The sample consisted of 388 respondents who were aged 18-88 years. About 36% of the respondents were men, and 64% were women. Their mean age was 38.6 years (SD=16.2). The largest group of the respondents was single (43.5%), and others were cohabiting (16.8%), married (22%), separated (3%), widowed (9%), or di-vorced (2.5%). The population was ethnically heterogeneous. Forty-seven percent of the respondents were Bakalanga. The remaining respondents are distributed among the Bangwato (14%), Bazezuru (8.5%), Batawana (8.5%), Bahurutshe (7%), and other ethnic groups (9%). Table 2, 2 cont'd. shows the distribution of the respondents by age, income, marital status, educational status, employment status, number of children, and number of people in the household and religious affiliation. Thirty-one percent of the respondents had no children,23% had oneor twochild(ren), 15%hadthree or four children, 22% had 5-7 children, and one respondent had 12 children. The mean number of children was 2.3 (SD=1.2). Approximately 35% of the respondents had no religious affiliation compared to 65% who had some religious affiliation. The respondents were distributed among African Independent Churches (38%), Pentecostal Churches (15%), Protestant Churches (6%), and traditional religions (2.8%). Most (85%) respondents had some form of formal education. Approximately 35% had primary education only, 27% had Junior Certificate only, and 20% had an O’ Level Certificate (Form 5). Only three had participated in the adult education programme and had attained only primer 3 level. One-third (29%) of the respondents were unemployed. Most of the unemployed were women. About 20% of the respondents were involved in micro-enterprises or informal sector. Women were most likely to be in the micro-enterprises/informal sector work, which includes food services, hairdressing, selling fruits and vegetables, and dressmaking. Most of these activities provide income for the family. Eleven percent were engaged in professional jobs, such as accountancy, teaching, nursing, and public administration. Blue-collar workers, as they are normally called, such as drivers, messengers, and cleaners, accounted for 14% of the respondents. The respondents were asked to indicate their monthly income. Their mean monthly income was P 801.32 (US$114), with a median of P 425 (US$ 61). About 27% did not have an income. We categorized income data into five groups (No income; P 400 and less; P 401-1,000; P 1,001-3,000; and P 3,001-6,000). In Botswana, anyone earning below P 400 is considered to be below the poverty datumline. Twenty-three percent of the respondents were earning income below the poverty-datum level. Only seven respondents earned between P 4,400 and P 8,400. There were more women earning income below the poverty-datum level than men (17% compared to 6%). Area of residence Francistown has a number of low-income areas. For the purposes of the study, the areas were divided into five categories. Gerald Estates and Pelotelele were put in the same category because they are made up of people who are mainly ex-squatters, most of whom were evicted from Somerset West, Kanana, Matjimenyenga, and PWD. Table 3 shows the distribution of the respondents by area of residence. Housing quality A majority (68%) of the respondents were living in houses of Self Help Housing Agency (SHHA). The remaining respondents were distributed among those who were renting (27%), those who rented some parts of their houses for money (2%), and those who were sharing the house with somebody else (4%). Most (83%) houses were built of masonry, 54% of which belonged to women. Twenty-six percent of the houses were supplied with electricity. A majority (65%) of the houses used paraffin and candles compared to 26% who used gas lamps for lighting. About 45% of the houses were built of cement while the remaining houses were built of stone, bricks, and other materials. About 36% of the respondents fetched water from the streetpumps while 40% had water piped to their yards. Only 14% had in-house sanitation, and 17% had a flush toilet. Eighty-four percent of low-income urban residents still use pit-latrines compared to 9% who use waterborne system. According to the Urban Development Plan 10 for Francistown City Council, the population density of Francistown is higher in lower-income areas, such as Monarch and Gerald Estates, compared to higher-income areas, such as Molapo Estates and Ntshe. This is mainly attributed to affordability levels on various income groups. The high population density in low-income areas has posed problems for development, and services provided by the Government are extended far beyond their planned boundaries. Subsequently, these highly-populated areas still source water from public standpipes and rely on the use of pit-latrines. Bivariate correlations The results for zero-order correlations are discussed by hypothesis. Hypothesis 1 was that the environmental quality will positively influence the overall health status and quality of life and the physical, psychological and level of independence domains of health. There was a strong and positive correlation between the environmental quality and the overall health-related quality of life (r=0.71, p<0.001), a moderate and positive correlation with physical health (r=0.36, p<0.001), a strong and positive correlation with psychological well-being (r=0.64, p<0.001), and a moderate but positive correlation with level of independence (r=0.43, p<0.001). The higher the perceived environmental quality, the better were the reported health outcomes. It was further hypothesized that social capital would be positively correlated with the overall health status and quality of life and with the physical, psychological and level of independence domains of health. There was a weak but positive relationship between social capital and the overall health status and quality of life (r=0.10, p<0.06). There was no relationship between social capital and the level of independence (r=0.01, p=0.93). The only significant, albeit weak, relationship was between social capital and psychological well-being (r=0.18, p<0.006), suggesting that people who lived in environments they considered to have high levels of social capital tended to also report higher levels of psychological well-being. An unexpected finding was an inverse and weak relationship between physical health and social capital (r=-0.17, p<0.001). This result would suggest that when social capital is high, people perceive or experience poor physical health. Test of moderation of social capital Multiple regression analyses were used for testing the moderation model by examining the hypothesized variables (environmental quality) and the hypothesized moderator variables (social capital) respectively, after controlling for antecedent variables. To test for the moderation effects, first, the control variables (age, migration, housing, job-category, and income) were entered in the equation. Second, the dependent variable was regressed on the independent variable to determine the main effects of the independent variable on the dependent variable. Third, the dependent variable was separately regressed on the moderator variable to determine the main effects of the moderator variable on the dependent variable. Finally, after controlling for main effects, the dependent variable was regressed on the interaction product term to determine its interaction effects. Where there is a statistically significant main effect of the independent variable on the dependent variable and a statistically significant interaction effect of the independent variable and the moderator, it was taken that there is evidence of moderation. When an interaction was found, social support was trichotomized in low, medium, and high to determine the nature of this interaction. The moderation hypothesis was that social capital would moderate the relationship between the poor environmental quality and the overall health status and quality of life and the physical, psychological and level of independence domains of health. Significant main effects were found for the environmental quality and overall health status and quality of life (beta=0.61, p<0.001), physical well-being (beta=0.47, p<0.001), psychological well-being (beta=0.51, p=0.001), and level of independence (beta=0.23, p<0.001). The main effect for social capital on the overall health status and quality of life was not significant (beta=0.08, p=0.34). Significant main effects were found for social capital on physical health outcomes (beta=-0.17, p<0.001) and psychological well-being (beta=0.16, p=0.001). The main effect for social capital on the level of independence was also not significant (beta=0.02, p<0.90). There was no significant interaction effect of social capital and the environmental quality for the overall health status and quality of life (beta=0.24, p=0.22)andforpsychologicalwell-being(beta=0.03, p=0.15), suggesting that social capital does not buffer the effects of the poor environmental quality on the overall health status and quality of life and on psychological well-being. There was, however, a positive significant interaction effect of the environmental quality and social capital for physical well-being (beta=0.62, p=0.02). The buffering hypothesis was supported. Social capital buffers the impact of the poor environmental quality on physical well-being. People who lived in communities which they considered to have high social capital tended also to report better physical health outcomes. The buffering hypothesis suggests that when individuals live in communities that they perceive to have high social capital, they tend to have better physical health outcomes even when their environments were poor. Low social capital was also beneficial for people who reported poor environmental quality. The results showed that the interaction made a significant contribution to the R2 (R2=0.01; F (5,382)=30.882; p<0.001). The product term involving the environmental quality and social capital produced a significant regression coefficient (t=1.980; p<0.001). The R2 for the total model is 0.29 F (5,382)=3.922 (p<0.001). This indicates that 29% of the variance in physical health outcomes could be explained by the two variables. This indicates that social capital is a moderator of the poor environmental quality. Table 4 shows the results of moderated hierarchical regression analysis for the environmental quality, health-related quality of life, and social capital. There was also a significant interaction effect of the environmental quality and social capital on the level of independence (beta=0.34, p=0.02). These results suggest that high social capital buffers the impact of the poor environmental quality on the low level of independence. At high levels of social capital, the effects of the poor environmental quality on the level of independence are reduced, such that those people will report high levels of independence. The buffering hypothesis of social capital on the environmental quality was partially supported. DISCUSSION The results of this study suggest that better environmental quality results in better reported health outcomes for the residents. The findings of the study also suggest that more attention should be paid to the role of the positive community environment in shaping health outcomes. The strong positive association between the quality of the environment and the health outcomes was a major finding. The environmental quality positively correlated with the overall health status and quality of life and the physical, psychological and level of independence domains of health. Acting alone, the environment accounted for a greater part of the variance explained in all health outcomes. The results of the study further suggest that more attention should be paid to the role of the positive environment in shaping health outcomes as it has a stronger effect than that of the rest of the individual variables. A strong main effect of the environmental quality and the lack of buffering by social capital has implications for improving the health of population. Future studies could explore which components of social capital would be beneficial to the health of population. Further, there is still a need to develop more effective and community-specific measures to examine the distribution and use of social capital to aid the formulation of policy and programmes to combat social exclusion and enhance health outcomes. The quality of a living environment inhabited, for the most part, by low-income people may result in concentration of poverty, overcrowding, poor housing, social disorganization, and limited access to healthcare. Such environments accelerate the transmission of disease because these increase the rates of contact between infected individuals. The differential prevalence of poor-health outcomes in low-income communities can be explained by the quality of the physical and social environment in which people live, the spatial distribution, and the contact and density patterns within and across population subgroups. The lack of buffering by social capital findings is in contrast to those that support the positive role of social capital on health outcomes. However, this study supports the work of Cullen and Whiteford, which warned of the possible negative impact of social capital on physical health and mental health outcomes (37). The negative correlation between social capital and physical health, however, requires further attention. The following is a brief discussion of this negative relationship. The results of the study suggest that when pain and suffering was high (poor physical health), bonding social capital and participation in community organizations were also high but when energy levels went down, fatigue went up, and there was little sleep and rest. This could imply that when people are confronted by certain challenges and crises in their communities, they physically exert themselves beyond their coping capacity. These communities are experiencing challenges and crises relating to the HIV/AIDS pandemic. Societal role expectations (latently existing through the legal and normative structures of society), norms of reciprocity and mutuality, and the fear of ostracism could force individuals to participate in other people’s lives, overexert themselves, and take responsibility for multiple family and extra-familial affairs, ultimately leading them to exhaustion and fatigue. To create a conducive environment for both recipients and caregivers, there should be a decrease in interpersonal conflict relating to participation and bonding and a corresponding increase in the number of people who participate willingly or receive support willingly (38). Possible reasons for lack of buffering Several reasons may be given for why social capital could not buffer the effects of chronic community stressors for physical health outcomes. Lack of residential stability: First, a significant number of squatters had been evicted to one of the study communities (Gerald Estates) prior to the study. Lack of residential stability due to squatter evictions may have had a negative impact on the stability of the communities and their ability to organize for the collective good. Sampson and Groves suggested that residential instability breaks social ties (39). It takes time to build social relationships and to contribute to the trust and collective efficacy to create links and bridges in the host community. Sporadic evictions, especially when people are not allocated plots next to each other, the same way they had lived for years in squatter areas, could have resulted in weakened social capital due to disrupted community ties. Squatter evictions often disempower people by disrupting the informal control systems and systems of containment at the local level, resulting in a loss of personal resources. Further, when evictions do not address the socioeconomic consequences of displacement and when people are evicted without sufficient consultation and compensation, apathy may result. ‘Bridges in conflict’: The issue of squatter removals also resulted in conflicts among civil servants, the ruling government, and opposition parties and could have possibly resulted in a rift in weakening bridging social capital and collective efficacy. Lowincome dwellers are more likely to be represented by Councillors and Members of Parliament from outside. The latter usually do not live in the same communities with the former, and as such, they may not have the experience of living in poverty. While representatives may share the same geographic locality, often their socioeconomic status is higher than that of the residents they represent. Lack of trust in public institutions and generalized apathy is a possible result. Knowing that their needs are not necessarily a priority in the eyes of political and business interests could result in apathy, making it difficult to organize and work towards the collective good, a manifest that would have buffered the effects of community stressors. This could further explain why communities, like Gerald Estates and Pelotelele, had the lowest collective efficacy, community trust, and concern. Weak community cohesion and concern for the community often impedes a community’s attempts to address its own problems. The dissipation of social capital as the community becomes poorer makes it difficult to work together to address critical community needs, such as the declining quality and availability of public services. Links with other rural and urban households may also be broken, intensifying hunger and malnutrition among poor households when a crisis hits because of a weak social safety network. The Coburn argument: the neglect of putative causes Wilkinson and Kawachi et al. contended that income inequality produces social disorganization (or lowered social cohesion), which then leads to poorer national health status (40,41). Coburn recently challenged this focus and suggested placing emphasis on examining the basic social causes of inequality and health (42). Higher income inequality produces low social cohesion and trust, which, in turn, produces poor health status. Coburn contended that it is not income inequality that produces lowered social cohesion and trust leading to lowered health status per se but rather the manifestation of neoliberalism (market dominance), which produces both higher income inequality and lower social cohesion (43). Muntaner et al. made a similar argument (42,44). Because markets allocate production and distribution resources in society, it would follow that individuals within those societies are motivated by material or economic considerations. Coburn argued that neoliberal tenets often oppose measures to redistribute income resources and are congruent with the production and tolerance of greater socioeconomic inequalities that result in lowered social capital. Implications for future research The present study provides groundwork for a larger investigation of the stressors facing low-income urban communities and their effects on the health status of residents. Additional research is needed on the variables that moderate or mediate the effects of the poor environmental quality on African populations. The negative correlation between physical health and social capital also needs further exploration in future research. Measurement of social capital Social capital is a concept that researchers are still grappling with and trying to refine. There is a need to develop more effective and community-specific measures to examine the distribution and use of social capital to aid the formulation of policy and programmes to combat social exclusion and enhance the quality of life. Several questions remain unanswered. How can linking and bridging social capital in poor communities be cultivated and broadened so that community members have access to new business ideas, suppliers, and markets? How can more extensive bridging networks, in turn, be used for enhancing the political capacity of the poor so that they have a greater say in matters affecting their lives? How can community concern and collective efficacy be enhanced? What associations, networks, and economic, political and social relationships are important to urban residents, especially the poor? More studies are needed to explore the contextual and locality-based component of social capital. A stronger focus should be placed on the components of social capital because these provide more information on the complexity of the community. Future studies could explore this variable using a mixed-method approach, including the use of participatory appraisal methods to contextualize the various aspects of social capital. Future research should also examine the meaning and sources of variation within communities in surveying the health status of respondents. The results of this study showed considerable heterogeneity in responses from the participants within the same neighbourhood about features that were all exposed to. It is not clear, then, what accounts for the unexplained variation, apart from income status. Further work needs to be done to validate the negative findings in relation to physical health and social capital and to further assess the impact of community stressors on health outcomes. ACKNOWLEDGEMENTS This project was funded by the University of Botswana Scholarship Fund. The author thanks the University of Botswana Staff Development Office for their commitment, financial support, and cooperation during his study. The author is deeply indebted and thankful for the leadership, guidance, support, and keen interest in his academic development of Professor Wynne Korr, Chair, and other members of the dissertation committee: Professor Gary Koeske, Professor Sandra Wexler, and Professor Ravi Sharma. REFERENCES
Copyright © International Centre for Diarrhoeal Disease Research, Bangladesh The following images related to this document are available:Photo images[hn09046t4.jpg] [hn09046t3.jpg] [hn09046t2a.jpg] [hn09046t2b.jpg] [hn09046t1.jpg] |
| |||||||||