 |
| About Bioline | All Journals | Testimonials | Membership | News |
|
||||||
|
||||||
Health Policy and Development Journal, Vol. 1, No. 1, Dec, 2003, pp. 61-68 COSTING HEALTH SERVICES IN LACOR HOSPITAL Maurizio Murru1, Corrado Bruno2, John Odaga3, Ahairwe Denis4, Akulu Ernesta4, Bavcar Alessandro4, Bonane Emmanuel4, Kirunda David4, Mwesezi Henry4, Nagujja Angela4, Ndindayino Kalire4. 1. Senior Lecturer, Department of Health Sciences, Uganda Martyrs University; 2. Director, St. Mary’s Lacor Hospital, 3. Lecturer, Department of Health Sciences, Uganda Martyrs University; 4 Students of the Master of Science in Health Services Management. Department of Health Sciences, Uganda Martyrs University. Code Number: hp03012 IntroductionHealth institutions all over the world are troubled by the intractable problems of shrinking resources and increasing demands for good quality services. Private-Not-For-Profit (PNFP) health units face even more serious problems. The financial support coming to them from donations has significantly decreased in the last 20 years. Raising user fees is not a viable option as fees high in relation with families’income exclude the poor from using the services. Yet, the mission of PNFP health units rotates around the idea of serving the poor and the disadvantaged. This leads to the need to reconcile the apparently irreconcilable: financial accessibility of services and their sustainability (Flessa 1998). Health managers at all levels (regional, district, sub-district, hospital, lower level health units) are ignorant about the actual cost of the services they produce and deliver. The very notion of “cost”is not clear to the great majority of them. In most cases the terms “cost”and “price”are used as if they meant the same. In the best cases, only direct costs are thought of when trying to assign a monetary value to services produced: expenditures are mistakenly taken to equal “actual costs”. So-called “hidden costs”are rarely considered or thought of. Yet, the knowledge of actual costs incurred in producing health services, can be of great use to health managers at all levels to make more informed decisions and to assess efficiency and effectiveness (Shepard et al. 2000, Green et al. 2001). In addition, a more detailed knowledge of actual costs of producing services can be useful for “political”reasons. All too often, lay people as well as technicians, seem to equate “fees”with “profit”. Sound information on actual costs of producing services, obtained with a clear and acceptable methodology, can help in clarifying the above mentioned misunderstanding. The authors of this study used cost finding and cost analysis techniques to calculate the actual cost of producing final units of outputs in Lacor Hospital, Gulu District, Northern Uganda. Lacor HospitalLacor Hospital was founded in 1959 by the Comboni Missionaries. In 1961, Dr.Piero and Lucille Corti took over the management of what was then a Dispensary and developed it into a hospital. By 1972 St. Mary’s Lacor Hospital was providing out- and in-patient services, and had established a nurse training school. Peripheral health units were also constructed at Amuru, Opit, and Pabo to provide services directly in rural areas and decrease the pressure on the hospital itself. Today, the hospital has 528 employees (of which 27 are medical doctors) and 468 beds with four wards; a General Medical Ward (125 beds), a Surgical Ward (127 beds), a Paediatric Ward (152 beds) and an Obstetrics- Gynaecology Ward (64 beds). In 2002 the in patients were 25,348 and the outpatients contacts were 147.178 (79.677 new cases and 67.501 re-attendances). Lacor Hospital also trains intern doctors from the Universities of Makerere and Mbarara. In addition, it has schools for nurses, anaesthetic assistants and laboratory assistants. St Mary’s Lacor Hospital has three main sources of funds: Delegated Funds from the Uganda Government (about 12 % of the total hospital funding), User Fees paid by patients (about 13 % of the total hospital funding), Projects surpluses and donations (about 75 % of total hospital funding). Between the financial years 1998 –1999 and 2001 –2002 the hospital recurrent costs increased of about 40 % (Driwale et al 2003). According to the National Census conducted between September 13th –19th 2002, the District has a total population about 338.427 people and an annual population growth rate of 3% (Uganda Bureau of Statistics 2003). For the last 17 years, the District has been ravaged by the guerrilla war waged by the Holy Spirit Movement first and the Lord Resistance Army later. The dear price of this ferocious war is, as always, mainly paid by civilians through abduction of children, indiscriminate killings, mass displacement, all resulting in serious disruption of life and widespread of poverty. MethodologyThe study covered the financial year 2001 –2002 (July 1st 2001 –June 30th 2002) and its main objectives were;
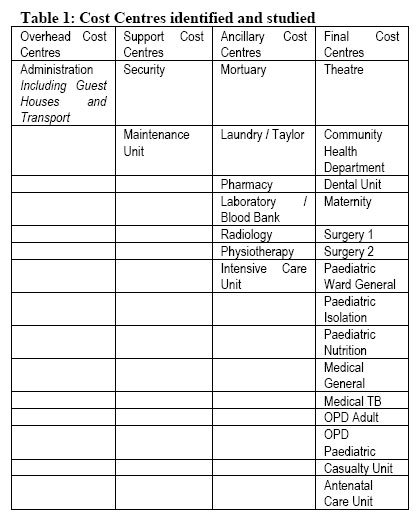
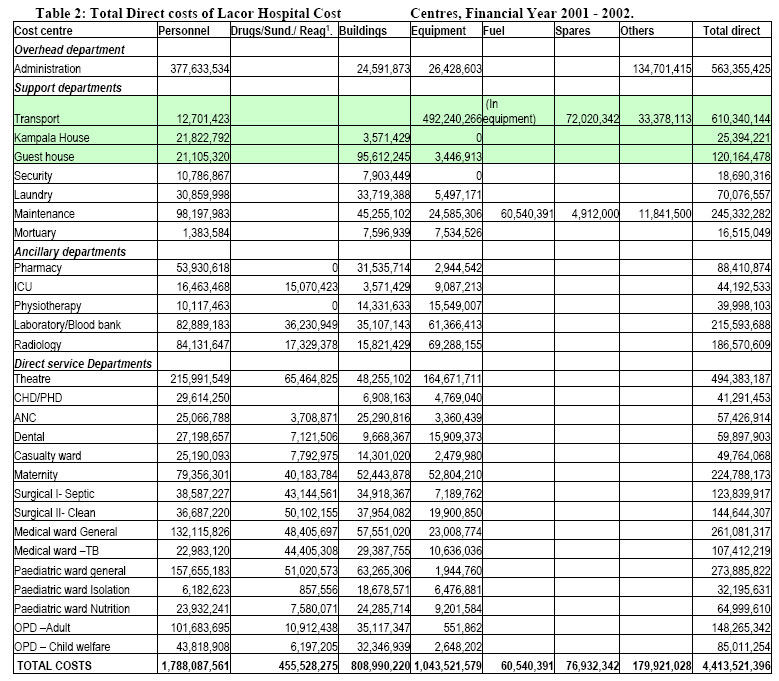
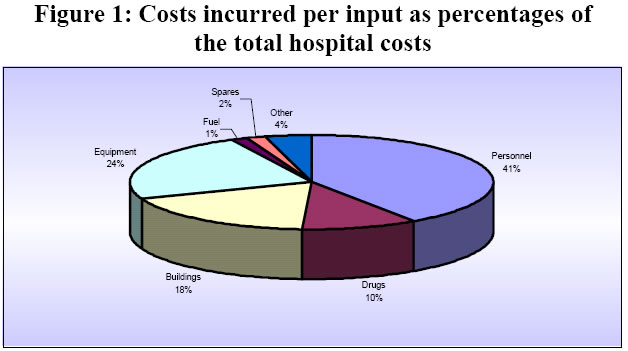
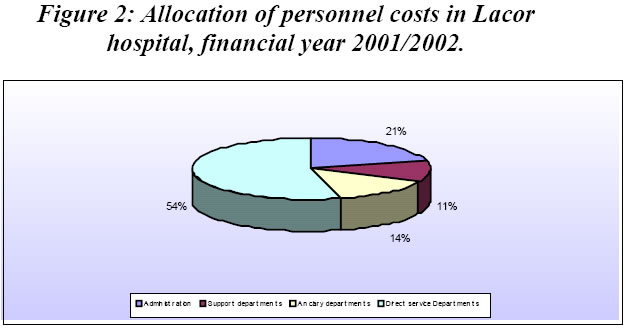
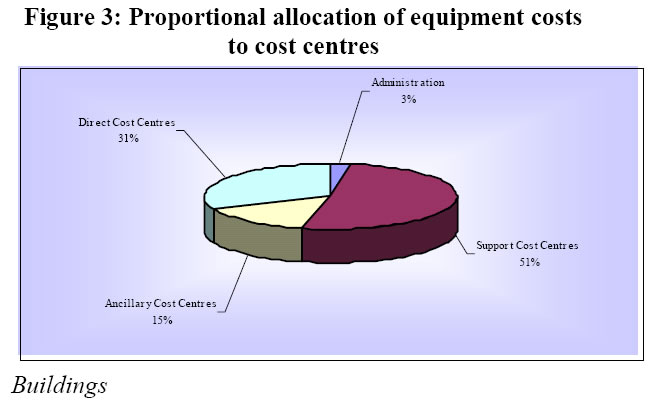
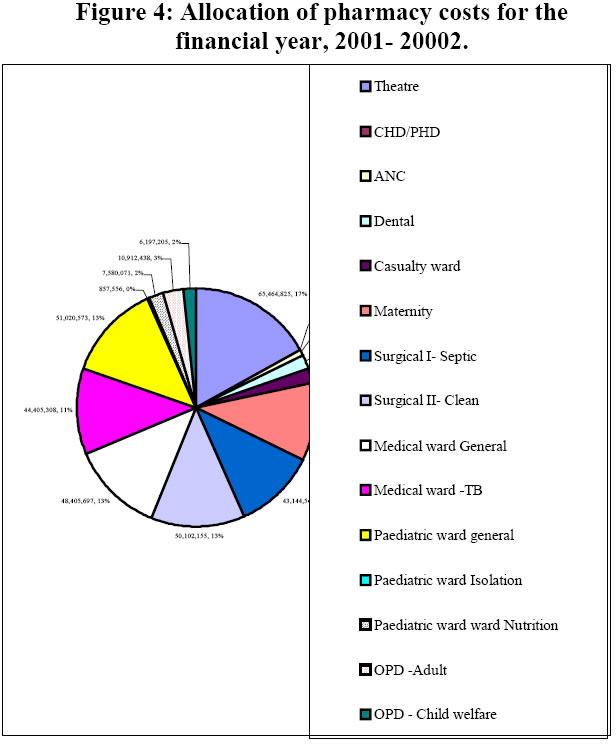
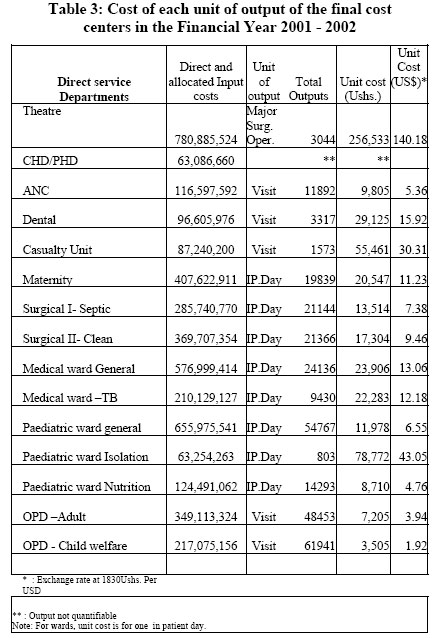
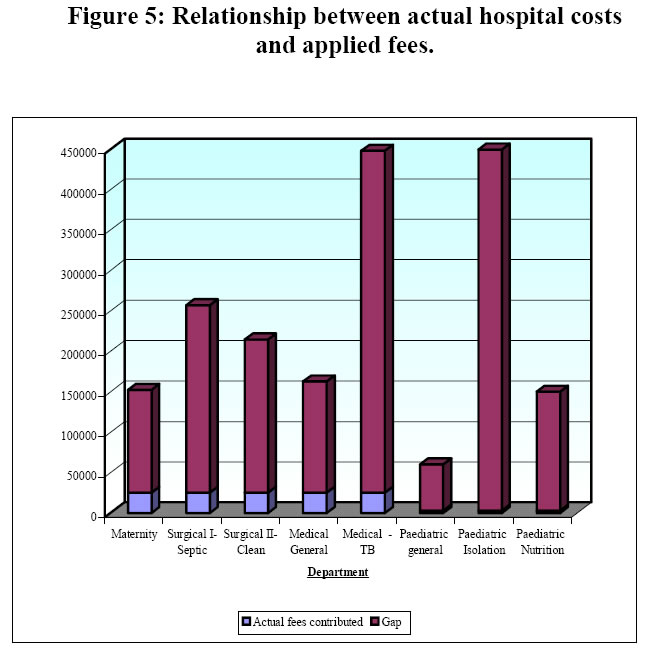
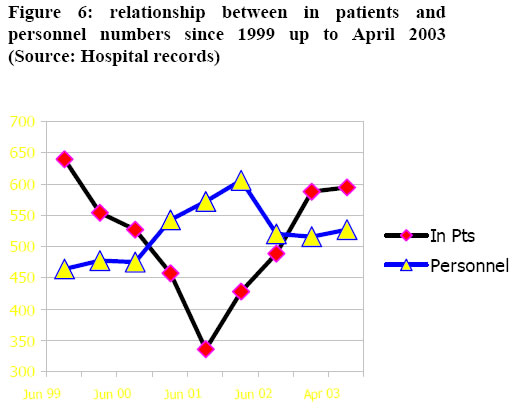
Overhead, intermediate and final cost centres were identified according to the functional structure of the hospital and according to the availability of reliable data. All the inputs used in each cost centre were identified, quantified and given a financial value. Personnel Personnel costs include salaries, allowances, housing, statutory deductions (National Social Security Fund and Pay as You Earn), staff insurance, medical treatment for staff and dependants and in service training. There are several expatriates working in the hospital. They are paid by various Projects. To cost their work, we used the salary perceived by Ugandans of the same rank and with the same qualifications. We assumed that, when they leave, at the end of their Projects they shall be replaced by Ugandans with the same qualifications. Using the international salaries paid by Projects would have inflated the costs of producing the hospital services. The costs of staff members working in different departments were apportioned according to the time spent in each department. This was found out using a “Time Motion Questionnaire”where the staff members noted the use of their time hour by hour for one entire week. This method was found to be more precise than just relying on interviews (Bratt JH, Foreit J., et al 1999) Buildings The surface of all the hospital buildings was calculated in square meters. The cost of each building was calculated by multiplying its surface in square meters by a standard rate of 1.000.000 Uganda Shillings. The Hospital has its own building construction team and this is the cost of construction currently incurred by it. The complete hospital plan was already in place and drawn to scale with the Auto Cad computer program. This made computing the surface of all the buildings fast and easy. The total cost of each building was then annualized and the annualized cost was used to calculate the costs for the period under study. To annualize the cost, we used standard annualisation tables, assuming that 30 years is the useful life of each building2 and using the discount rate that, according to the Bank of Uganda, was 3 % at the time of the study (Bank of Uganda 2003). The perimeter fence was also assumed to last 30 years. Its annualized cost was attributed to the Security cost centre. Vehicles The useful life of vehicles was estimated at five years. The replacement value was obtained from car dealers in Kampala. The annualized cost was calculated using standard annualisation tables. Medical Equipment The equipment inventory availed by the hospital was incomplete and imprecise: many items were not included and the value assigned to them was far below the replacement price (the price one would currently pay to purchase a similar item). We carried out a new, comprehensive inventory of the hospital equipment. As the one of buildings, the cost of the equipment was also annualized using standard annualisation tables and current replacement prices. The useful life of equipment was estimated at five years. The replacement value of the various items was estimated using the last edition of the “Price Catalogue”of the Joint Medical Store (Joint Medical Store 2003). Drugs and sundries The value of drugs and sundries used in the period under study was obtained from the balance sheet. The data on the value of opening and closing stock were not complete. We assumed that all drugs and sundries purchased during the financial year 2001-2002 were consumed in that year. The prices were obtained from the Joint Medical Store price list. The amounts of drugs and sundries used in the various cost centres were determined by adding up the amounts issued by the pharmacy to the different units. Donations The value of all donated items (equipment, drugs, equipment, etc.) was calculated using the current replacement price and their annualised cost was included in our calculations. The step down process This is the process of allocating, step by step, the direct costs of overhead cost centres to ancillary cost centres then to direct cost centres. Then the costs of ancillary cost centres (direct and allocated from overhead cost centres) are allocated to direct or final cost centres. In the first step of the process, the costs of administration (and of other overhead cost centres, if any) are assigned (“stepped down”) to intermediate (or ancillary) cost centres and to final cost centres (out patient and in patient departments). In the second step the cost of intermediate cost centres (direct costs and stepped down costs) are assigned (“stepped down”) to final cost centres. The costs of support services that do not change with patient volume (like cleaning) are allocated in the first step, with the overhead costs. The costs of support services that vary with patient volume, like laundry, are allocated in the second step, with ancillary costs. This process assumes that all the resources used flow in only one direction: from the overhead cost centres down to ancillary and direct cost centres. The proportion of costs allocated from overhead to ancillary and direct cost centres and from ancillary to final cost centres is based on the proportional use made of the services of the cost centres “above”by the cost centres “below”. It is not always easy or straightforward to determine the proportional use of overhead cost centers by ancillary cost centres and of overhead and ancillary by direct cost centres. It is necessary to determine allocation criteria that are logical and whose calculation is feasible. Allocation criteria are often debatable. Below, are some of those we used in this study. Staff insurance costs were allocated to all staff in proportion to their salaries. Therefore, they were distributed to all the cost centres in proportion with the number of staff working in them (or the proportion of time spent in them by staff members working in more than one final cost centre). Transport costs, together with the costs of the guesthouses, were attributed to administration. It was not possible to determine the proportional use of vehicles by the ancillary and final cost centres. The guesthouses are supposed to benefit, indirectly, the whole hospital. The contribution of security to administration was ignored because considered minimal. Data on linen use were not available. We allocated the costs of the laundry to the final cost centres on the basis of the number of staff working in them. The assumption was that cost centres with high number of staff also have a high workload and need more linen. Costs not included in this study We didn’t analyze the costs of the Nursing Training School attached to the Hospital. Two new buildings were under construction at the time of the study. They were excluded from the study because they are not yet in use. Equally excluded from the study were the expenditures linked to ongoing formal training for hospital staff since this “capital item”was not yet utilized by the hospital. The costs of the field activities of the Community Health Department were also not studied. FindingsThe cost centres identified and studied are shown in table 1 below while the direct cost calculated for each one of them are shown in table 2. Total hospital costs During the financial year 2001 –2002, the costs incurred by the hospital to produce its services amounted to 4,413,521,396 Uganda Shillings. As shown in figure 1, personnel costs were the biggest item, accounting for 41 % of the total. The costs linked to depreciation of equipment and buildings came immediately after (respectively 23 % and 18 % of the total). Drugs and sundries accounted for 10 % of the total costs incurred, while the costs of the remaining items, although considerable in absolute terms, accounted for small percentages of the total. Under the heading “others”we included stationery, telephone bills, courier and other similar items that, alone, would have accounted for very small percentages of the total costs incurred. (Figure 2) Personnel costs The greater part of personnel costs (54 %) were absorbed by the final cost centres (the service departments, see table 2). Administration absorbed 21 % of the total personnel costs. As said, we included under “administration”the direct costs (including personnel) of transport and guesthouses. Equipment The depreciation of equipment accounted for 24 % of the total hospital costs in the financial year 2001 –2002. The explanation for such a high percentage is that we included under this item not only the “medical equipment”used in ancillary and direct cost centres but, also, equipment used by “support cost centres”such as transport, laundry and maintenance unit. The vehicles, machinery and equipment used by these cost centres are expensive. Their maintenance and depreciation are, also, expensive. Figure 3 shows that 51 % of the costs calculated under the heading “equipment”are attributable to the support cost centres mentioned above, 31% to direct cost centres, 15 % to ancillary ones and 3 % to administration. As for medical equipment, the hospital is well endowed. In some cases we had the impression that some departments and wards are over equipped in relation with their actual needs. Buildings As seen before (Figure 1) the depreciation costs of buildings account for 18 % of the total costs incurred by the hospital in the financial year 2001 –2002. The area of buildings of the Lacor Hospital Complex is a very wide: little less than 25.000 square meters. This explains the high annualized costs linked to the depreciation of buildings. These annualized costs include those of the lagoon and of the incinerator. The management of solid and liquid waste in Lacor Hospital is taken care of at high standards of quality and this has its costs. Pharmacy The data on items issued by the pharmacy to other cost centres (ancillary and final) for the period under study were not complete and clear. Our findings, therefore, may not be 100 % accurate but we believe they give a reasonably good approximation to the real situation. Figure 4 shows the proportion of pharmacy costs allocated to the various cost centres. About 85 % of the total pharmacy costs were allocated to the final cost centres. Unit costs of final cost centres outputs After having calculated, for each direct cost center, all the direct costs and all the costs allocated through the step down process, we calculated the unit cost of the outputs of each direct cost center. To do this, we found out the total number of units of output for each cost center, for instance, total number of OPD visits for the OPD Departments, total number of in patient days for the Paediatric general Department, total number of major surgical operations for the Surgical Theatre, etc. After that, we divided the total costs of each direct cost centre by the total number of its units of output. This gives us the unit cost of each unit of output of each final cost centre. Table 3, below, shows the results of these calculations. As expected, the most expensive unit of output is a major surgical operation. The actual cost of in-patient days differs between different in-patient departments, the least expensive being the Paediatric Nutrition Department (8,710 Uganda Shillings) and the most expensive being the Paediatric Isolation Ward (78,772 Uganda Shillings). The high cost of in-patient days in this Department is linked to the very low utilization (only 803 in-patient days in one year). Since fixed costs (personnel, buildings, equipment) remain constant, the resultant unit cost is high. The cost of a visit in the casualty unit is, also, relatively high (55.461 Uganda Shillings). These visits are carried out by specialized personnel and require expensive investigative procedures. The average cost of an in-patient day is 24.627 Uganda Shillings. Hospital costs versus hospital fees As already noted, the hospital costs are funded by project surplus and donations (75 %), User Fees (13 %) and Government Delegated Funds (12 %). The fees charged for the various services are among the lowest charged by PNFP Hospitals in Uganda. In addition, the majority of them are “flat rates”rather than “fees for services”. This means that they are not linked to the amount of drugs received or the number of days spent in the hospital. With flat rates, patients know in advance what they are going to pay, irrespective of the seriousness of their condition and the length of their admission. The hospital is heavily subsidizing the services offered. For instance, the real cost (incurred by the hospital) for one single in-patient day in the Paediatric General Ward is 11.978 Uganda Shillings while the flat rate of one admission in the same ward is 2,000 Uganda Shillings irrespective of the length of the admission. One visit of an adult as an outpatient costs to the hospital, on average, 7,505 Uganda Shillings. The flat rate for it is 4,000 Uganda Shillings. Figure 5, below, gives a graphic visualization of the difference between hospital costs and hospital fees. The calculations made to produce the graph in Figure 5 show a median subsidy of 6.5 US $ per patient. It is necessary to add that even the relatively small fees charged is much money for the majority of the population served by the hospital, a population severely impoverished by 17 years of uninterrupted and brutal war. ConclusionsThe usefulness of costing as a managerial tool is appreciated by health managers in general and hospital managers in particular. In the case of PNFP hospitals operating in poor areas, like St. Mary’s Lacor Hospital, its usefulness is more descriptive than normative. It helps to understand the structure of costs, to identify and appreciate the usually unrecorded (but very real) hidden costs, to have clearer ideas on the actual costs of services. It can help to identify and, possibly, correct areas of absolute or relative inefficiency. Assessing efficiency was not among the objectives of this study. However, from the Hospital Annual report of 2002, and from figures on the activities of the first four months of 2003, it seems that the overall efficiency at St. Mary’s Lacor Hospital has been improving since 2001 (Figure 6). It is our impression that only very little efficiency gains could be obtainable at St. Mary’s Lacor Hospital and that they would not constitute a significant financial contribution. In few cases costing can help in setting user fees more realistically linked to actual production costs. This is not the case in St. Mary’s Lacor Hospital. While it is true that the fees are extremely low when compared to the actual cost of the delivered services, the served population is so poor that raising the fees is unthinkable. A study carried out in 10 PNFP hospitals in Uganda suggests that, in such hospitals, user fees should never cover more than 20 % –25 % of hospital costs. If they exceed this percentage, the hospital is not fulfilling the mission of “serving the poor”(Maciocco et al. 2000). At St. Mary’s Lacor Hospital user fees only cover 13 % of hospital costs. Identifying and describing the actual costs of producing hospital health services (against the fees charged) can be a useful tool to advocate for more funds from both, Government and donors. The findings of this study cannot be generalized. If studies comparable for methodology and time are carried out in various hospitals, useful comparisons could be made and possible efficiency gains could be identified. It would be recommendable and useful to couple costing studies with assessment of quality indicators as this could explain and justify differences in costs (Levin et al. 2003). References
Copyright 2003 - Department of Health Sciences of Uganda Martyrs University The following images related to this document are available:Photo images[hp03012t3.jpg] [hp03012f5.jpg] [hp03012f3.jpg] [hp03012t1.jpg] [hp03012f4.jpg] [hp03012f1.jpg] [hp03012t2.jpg] [hp03012f2.jpg] [hp03012f6.jpg] |
| |||||||||
