 |
| About Bioline | All Journals | Testimonials | Membership | News |
|
||||||
|
||||||
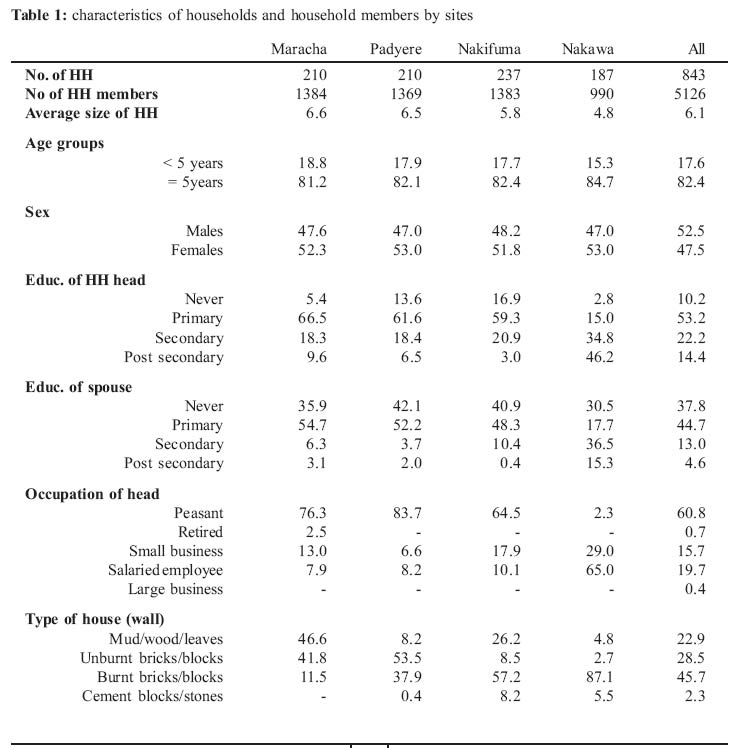
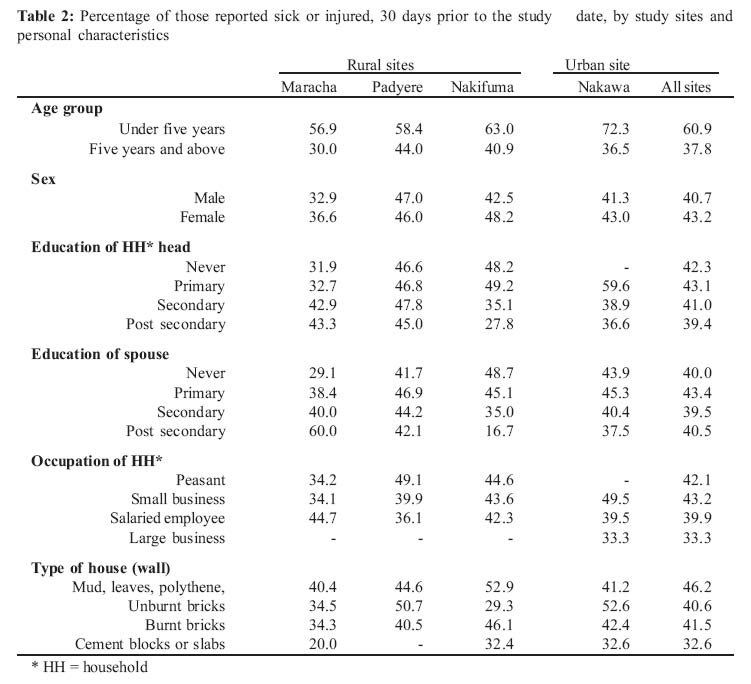
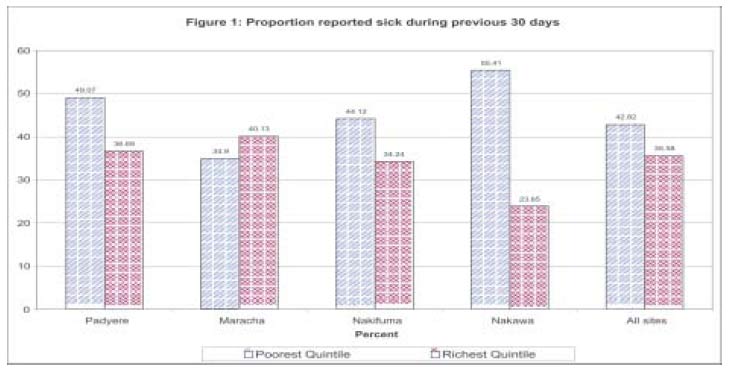
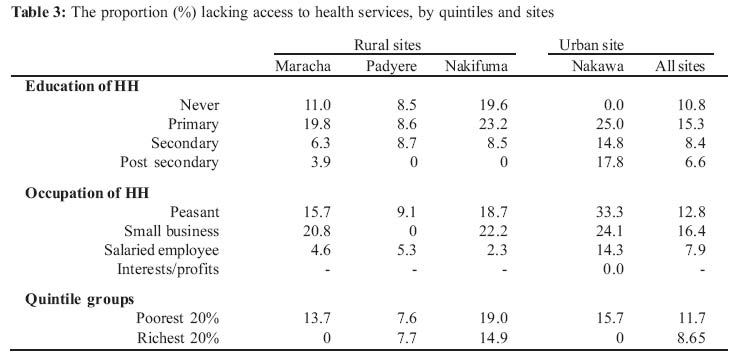
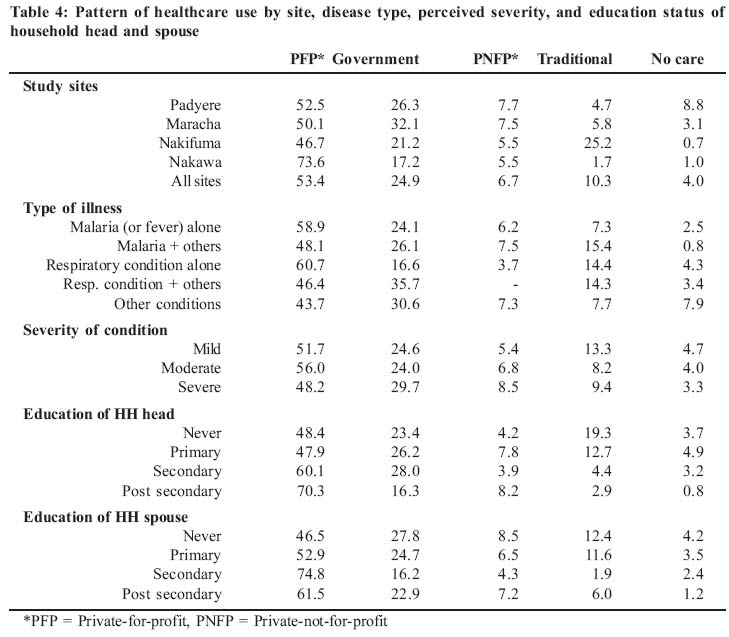
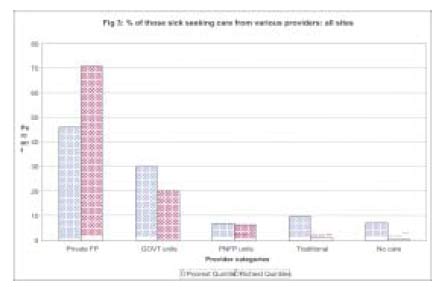
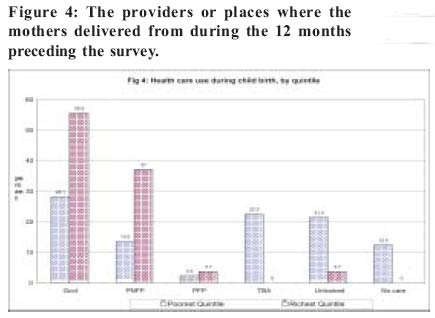
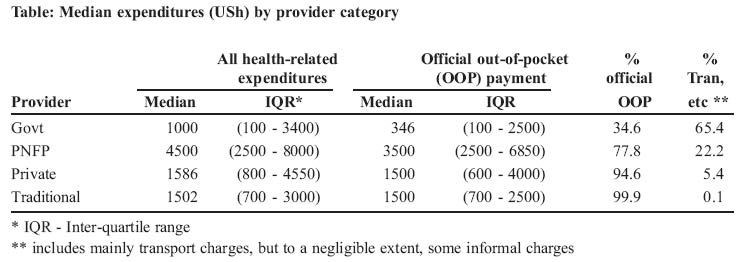
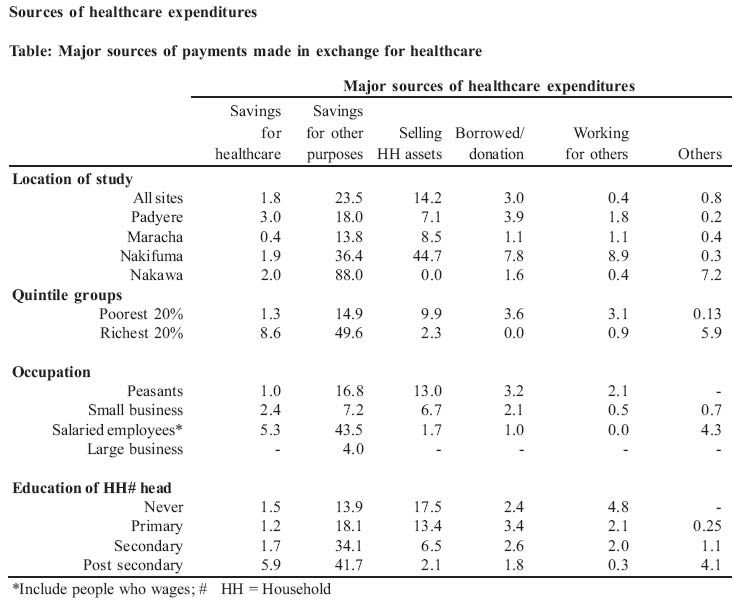
Health Policy and Development Journal, Vol. 2, No. 3, December, 2004, pp.192-208 HEALTH INEQUITY IN UGANDA: THE ROLE OF FINANCIAL AND NON-FINANCIAL BARRIERS John Odaga, Lecturer, Department of Health Sciences, Uganda Martyrs University, Adriano Cattaneo, Unit for Research on Health Care Services and International Health, IRCCS Burlo Garofolo Trieste, Italy Code Number: hp04033 Abstract Inequality in health is known to be rampant among different socio-economic groups, with the poor typically suffering more ill-health and facing greater economic cost of ill-health than the rich. Yet a number of other non-economic factors are also known to concurrently operate, in a complex way, to further ration healthcare in favour of the rich. Measuring, monitoring and understanding the influences these factors pose in determining health-seeking behaviour at district and sub district levels are necessary to guide policy. Policies based on intuition alone can be misleading. The household survey was an attempt to understand the level and direction of disparities in health by socio-economic differentials in Uganda; and the roles of both financial and non barriers to healthcare use. A total of 843 households were sampled (by probability proportionate to size technique) from four health sub districts. We found that the poorest quintiles were 2.4 times more likely to suffer ill-health than the richest quintiles, with a greater proportion of them lacking access to publicly-provided health services than the richest counter-parts. There were no rich-poor differences in the types of illnesses/injuries. Although the findings of this survey confirm the conventional wisdom, they also reveal healthcare use patterns that reflect, not only the importance of financial barriers, but also the opportunity costs in travel (and possibly waiting) time, and other important factors including the availability, affordability and the perceived quality of services. Introduction There is ample evidence of unacceptable inequality in the health sector with respect to various indicators. The indicators often assessed include people's health status (morbidity and mortality), accessibility to basic health services, utilization of health services, and expenditure on health. The conventional wisdom is that the poor are often the disadvantaged, whatever the dimension assessed-that they suffer more ill-health (and death), utilize services less, and pay more of their income (proportionally) on healthcare than the betteroff. Such disparities have been shown to pervade the whole world, being rampant both between and within countries-whether they are rich or poor, or have high or low aggregate health (Schellenberg et al, 2003; Evans et al, 2001). The picture is said to be the worst in Sub-Saharan Africa (Schellenberg et al., 2003), and Uganda is no exception. For example, according to the Uganda Demographic and Household Survey (UDHS) of 2000 - 2001 (UBOS & ORC Macro, 2001), the infant mortality and child mortality rates were twice as much in the lowest population quintile as they were in the highest population quintile. They (the poorest groups) were four times more likely than the wealthiest quintiles to deliver unattended to, or attended to by traditional birth attendants; and about three times more likely than the richest groups to be attended to by relatives or friends. Similar directions in disparities were consistently demonstrated through out the report with respect to other indicators.For example, according to the Uganda Demographic and Household Survey (UDHS) of 2000 - 2001 (UBOS& ORC Macro, 2001), the infant mortality and child mortality rates were twice as much in the lowest population quintile as they were in the highest population quintile. They (the poorest groups) were four times more likely than the wealthiest quintiles to deliver unattended to, or attended to by traditional birth attendants; and about three times more likely than the richest groups to be attended to by relatives or friends. Similar directions in disparities were consistently demonstrated through out the report with respect to other indicators. The UDHS (UBOS & ORC Macro, 2001), and the Uganda National Household Survey 2002/03 (UNHS, 2003), also show unacceptable disparities in the same indicators between different regions of the countrywith the northern part being worse-off-partly reflecting the stability and the security pattern of the country. As expected, the indicators are more favourable in the urban areas than in the rural ones. The bottom line is that the poor are often facing a far greater economic cost of ill-health than the rich. For example, between 1999/00 to 2002/03, people in rural areas of Uganda (most of whom are poor), spent about 5% of their total monthly consumption on health, compared with 3% for their urban counter parts, even though poverty had increased more in the former than in the latter areas (UBOS, 2003). In the Uganda Participatory Poverty Assessment Project of 2000, Ugandans mentioned ill health as one of the top-most causes of poverty to them. The associated cost of treatment and burial expenses was noted as an important factor, among others. And when asked about the top-most cause of ill-health to them, they also mentioned poverty (UPPAP, 2002). To reduce the rich-poor gap in the health sector, the government of Uganda has responded by abolishing user fees in all government health units, except the private wings. In addition, public subsidies are now flowing, much more than before, towards those services expected to be used by the poor-the peripheral government health facilities and the mainly faith-based Private-Not-For-Profit (PNFP) health units. The PNFP units (located mainly in rural areas) are also implementing a targeted user fee reduction initiative, which preferentially favours those least privileged in the society (women and children). The Ugandan types of response are typical of what are seen in many other developing countries (Charlotte, undated). Such initiatives are usually premised on the expectation that the poor will use those facilities, particularly the government ones, as their primary, if not exclusive, source of care. Yet the empirical evidence (Charlotte, undated; UBOS & ORC Macro, 2001), paradoxically, point to the contrary-that, despite the free government services, both the poor and the better-off often opt for healthcare services and medicine in the private sector. Distance is often cited as the most important consideration, implying that the opportunity cost of the 'free' government services is too high for many to afford, forcing both the poor and the rich to seek care from the private sector, the majority of which, in Uganda, are of questionable quality. These observations call attention to the fact that determinants of utilization are complex, and that economic factors (such as fees charged at the point of use) are only one consideration in people's health care-seeking behaviour. There may often be transport costs, and there are likely to be non-monetary losses to the patient and accompanying family members (loss of time in other productive activities, for example). All these factors tend to ration services in favour of the households that are better-off than the poorer ones, even when provision and financing reforms are pro-poor. Therefore, an equity policy that concentrates on only one aspect can not do the whole job. Thus, it becomes necessary to measure the direction and extent of inequality, not just as a one-off exercise, but routinely so as to monitor the trends in the disparities thereof. Decisions based on intuition alone can be misleading. Different methodologies exist for measuring inequality along socio-economic differentials. They include the use of concentration curves described by Wagstaff (2000), gini coefficients, means testing and other indices. Unfortunately, such levels of assessments are rare, and certainly not part of the routine health management information system, making it difficult to operationalise policies, or monitor trends in inequality. The reports quoted here (UBOS & ORC Macro, 2001and UNHS, 2003) are very good steps in this direction. However, they do not analyse the state of inequality at the district or subdistrict levels. Healthcare managers need such information at that level. Because of the need for such information, CUAMM commissioned this survey, which was conducted by the department of Health Sciences of Uganda Martyrs University in three selected rural sites and one urban area. The survey set out to establish if there were any disparities in sicknesses or injuries suffered, accessibility to basic healthcare, healthcare-seeking and healthcare spending, among households, by socioeconomic differentials. We also sought to investigate factors underlying any observed healthcare use pattern, and, how households raised money to pay for healthcare services, if at all. METHODOLOGY Population and sampling i. Selection of the study sites The survey was carried out in the three rural Health Subdistricts (HSDs), which presently correspond to the counties, of Maracha in Arua district, Padyere in Nebbi district and Nakifuma in Mukono district-areas partly served by the CUAMM supported hospitals of Maracha, Angal and Nagaalama respectively. The fourth study area was Nakawa division (HSD), an urban center in Kampala, chosen to allow for some comparison. The counties/HSDs were chosen conveniently because of the presence in these areas of people who are known collaborators with the institution undertaking the study, and CUAMM (the organization that commissioned and funded the research). ii. Sample size and sampling methods Eligible households were selected by means of a multi-stage cluster sampling method, the first stage being the convenient selection of the HSDs (counties), already described. A two-stage 30 by 7 cluster sample method was applied, such that, at each site, 30 villages were selected, each with seven eligible households, giving a total of 210 households per study site. Thus a total of 840 households were planned to be sampled for the survey. The actual number interviewed varied at different sites, such that a total number of households studied came to 843. i. Selecting the villages Thirty villages were sampled from each Health Sub-district (HSD) with probability proportionate to size (PPS) of the population in the villages. Sampling with PPS allows the bigger clusters (villages in this case) to have a greater chance of being selected. The list of villages, and the corresponding number of households for each of the study area was obtained from the Uganda Bureau of Statistics (UBOS). The detailed process of selecting the households consisted of: a) Cumulative numbering of all the households to construct the sampling frame (total population) b) Dividing the cumulative number of households by 30 to obtain the sampling interval c) Selecting a random number between 1 and 30. This number corresponded with one of the households in the sampling frame and identified the first village from which the first set of households were selected d) Adding the sampling interval to the random number selected. This identified another household on the cumulative list or sampling frame, which corresponded to another village (or same as previous) from which another set of households were selected. e) The process was repeated 28 times; each time the next village was identified by adding the sampling interval to the previous number on the cumulative list that corresponded to the previous village. This means that we could have more than one cluster in case of very large villages. ii. Selecting the households The next stage was to select seven households from each of the identified villages by means of a systematic random sampling method. The detailed process consisted of: a) Visiting each of the selected villages b) Selecting a central location (intersection, etc) c) Selecting a random direction (pen or bottle spin) d) Selecting the first household. The first household in the chosen direction was selected. e) Then choosing the next nth household, until a total of seven households are sampled. The nth depended on the estimated number of households in that direction, determined with the aid of the local council leaders. Variables and measurement 1 Household economic characteristics a) Social & economic proxy markers To measure inequality in morbidity, healthcare use or expenditures, it was necessary to establish a scale for measuring socio-economic status. Various methods exist to determine the social and economic status of a household, including the total income, the total expenditure/consumption of the households, concentration curves and indices (Wagstaff 2000; Gakidou et al, 2000). This study investigates inequality basing on other methods that use proxy indicators to generate an index that reflects the relative socioeconomic levels of different household. Four variables were studied and used to derive a composite index, used as a marker of the socioeconomic status of all the households studied. The variables (and the corresponding indicators) included: i. Conditions of the main house (type of roofing, wall and floor materials) ii. Disposable household assets (means of transport, means of communication/entertainment, domestic animals) iii. Education status of the household (education status of the household head and spouse) iv. Main source of income of the household head The indicators were given ranked scores, reflecting their relative money worth. For example, regarding "conditions of the main house" a concrete roof scored 6, against 1 for a grass/banana-thatched roof (refer to the questionnaire for details). The types of wall and floor materials were also similarly weighted. Similar weighted scores were also applied to the types of household possessions (disposable assets). However, because it was possible for a given household to own more than one, or all, of the assets in question, we only sought for the most valuable items, in terms of their perceived relative monetary values. For example, a household, with a car (score = 6), a motorcycle (score = 5) and a bicycle (score = 2), would be scored "6" for means of transport. And one with no car or motorcycle, but with a locally assembled boat/canoe (score = 3) and a bicycle (score = 2) would be scored "3". The same process was applied to assess the presence of other household assets. The education status of the households was determined by scoring the highest level of education ever attended by the household head and the spouse, regardless of whether they completed the stages or not. The education status of a given of a given household was given by an index-the product of the scores of the household head and the spouse. If the household head attended a post secondary education (score of 4) and the spouse attended any level of primary education (score of 2), the education index of the household would be 8. The main source of income, or livelihood, of the household head was similarly ranked. The category "other" was eventually disregarded during the analysis, since it was not practical to rank such an option. In any case, there was no household whose main source of income fell in the "other" category. b) Household socio-economic index The overall socio-economic index of every household was derived by multiplying the scores for the various indicators described above (roofing materials, wall materials, floor materials, means of transport, means of communication/entertainment, domestic animals, highest level of education reached by household head and spouse (education index), and the main source of income of household head). Thus, if a household had a tile-roofed house (5) built with concrete blocks (7) and had floor tiles (3); suppose that this household owned a car (6), a phone (4), but no domestic animal (1). Suppose also that the household head studied up to University (4) and was a civil servant (3), and that the spouse studied up to primary seven (2). The socio-economic status (SES) index for that household would be 60480-the product of the scores. This kind of index was derived for every household, and also applied to every individual in the respective households, since analysis was done by individuals. The product of the scores was considered on the assumption that the various variables studied could possibly have synergistic rather than complementary effects on the healthcare use pattern of the individuals studied. The index is arbitrary and does not give the true economic positions of the households studied, but rather their relative socio-economic (SE) levels. Thus, the lower the value, the lower the SE level; and the converse are true. c) Derivation of quintile groups The index thus derived was tested for normality. Because of the skewed distribution, the scores were transformed into their log10 equivalents to obtain a somewhat normal distribution. A cumulative percentage (percentiles) of the transformed index (Log10 SE index) was obtained after arranging the scores in ascending order. Using the cumulative frequency (percentage) of the transformed scores, the samples were divided into five equal percentiles or quintiles, such that each quintile group had a range of non-overlapping scores. Thus we have: Q1 = t he first (bottom) quintile group (Q1) = Poorest (20%) quintile Q2 = the second quintile group Q3 = the third quintile group Q4 = the fourth quintile group Q5 = the fifth (top) quintile group = 'Richest' (20%) quintile It is important to note that the grouping is reliable only in a relative sense, being useful for investigating the direction of inequality. They do not reflect the true welfare status of the samples studied. 2 Accessibility to health care Accessibility to health services in this context was defined as the percentage of a given population who live within a 5km radius of any public health unit. A public unit was either a government, or PNFP health facility. Conversely, an individual was considered as lacking access to health services if he/she was living more than 5km from any public health unit. The respondent was asked to estimate the distance to the nearest public facility. The distance was recorded to the nearest whole figure. Estimates were made with the help of the research assistance, who had fair knowledge of the geography of the sites. 3 Health needs and Healthcare seeking pattern We enquired of all the listed members of the selected households for history of any sickness/injuries suffered or sustained 30 days prior to the survey. The conditions considered were those whose onset fell within the 30 days time bracket-thus only new events were documented. The respondents were allowed to describe the conditions in their own words. The interviewers only probed where the responses were not clear. The reported conditions (signs, symptoms, diagnoses) were matched against a pre-coded list of common conditions/symptoms in the questionnaire. For the members who fell sick or sustained injuries during the specified period, information was further elicited about the type of provider first sought for care, if at all. The same information was also asked where further treatment was sought for the same conditions. "Further treatment" referred to treatment sought, for the same episode of the reported illness, after a partial or complete course of treatment from the provider first consulted. Severity of the conditions suffered was graded as mild, moderate or severe depending on whether or not the individual continued with all activities, stopped some activities or stopped all activities respectively. In the case of a breast feeding child, the condition was graded as such if the child continued breast feeding normally, showed reluctance in breast feeding or stopped breast feeding respectively. We further asked for history of any child birth during the 12 months preceding the survey, and the type of care/ provider first sought regarding the child birth in question. 4 Reasons for the reported care seeking pattern The respondents were asked for the most important reasons for the type of care sought for the reported conditions. The reasons given were matched against a list of pre-categorised responses, capturing various factors; from severity of conditions to distance, from affordability to quality, and from availability of services to 'other' reasons that could not fall in any of the categories. 5 Household expenditures on healthcare For every condition for which some form of care was sought (be it home-made remedies or otherwise), the respondents were asked to estimate the amount of expenditures made on transport and in exchange for the services received from the providers sought. We specifically sought to capture out of pocket payments made by the households at the point of service deliveries, whether official or informal, and whether paid on delivery of service or later (credit). Where an individual first consulted a given provider but had to purchase some, or all, of the prescribed drugs from another source(s) because they were unavailable from the prescribing provider, such expenditures were considered as being "informal" charges with respect to the first (or prescribing) provider. Where payments were made in kind, estimates of the local market values of the items were recorded. Quality assurance Every study site had at least three research assistants (RAs) and one supervisor. To be enrolled as a research assistant one should have attained, as a minimum, the Uganda Advanced Certificate of Education, and, in addition, should have been proficient in both written and spoken English, and fluent in the local languages. All the research assistants had post secondary school qualification, about 50% of whom being university graduates. Further more about 50% of the research assistants had participated in similar surveys before, and were conversant with the methodologies and interviewing skills. Nevertheless, two training sessions, each lasting two days, were conducted for all the research assistants (RAs). The first was for all the RAs for Nakawa (Kampala) and Nakifuma (Mukono) and included also all the supervisors for the different sites. A second training was conducted for the RAs from Padyere & Maracha HSDs. All the trainings were conducted by the principle investigator. All trainings lasted two days each. The first day focused on the content of the questionnaire. On the second day, the RAs pre-tested the questionnaires, and at the end of the day, further clarifications, and some adjustments in the instruments, were made to remove any ambiguities. Each RA interviewed only 7 households per day, for an average of one hour each, so that there was no rush through the questionnaires. At the end of each day, each supervisor met with the team of RAs to check the instruments for completeness as well as for internal consistencies, and further clarifications were made, where necessary. The supervisor traveled with one of the RAs each day, especially the first few days; and normally this was a RA that needed extra and closer supervision. Data processing and analysis Data cleaning, recoding and coping with missing data Before proceeding with the analysis, we checked for the internal consistencies of all the important responses. This was possible by filtering all the important variables using Ms Excel, and running frequencies and cross tabulation of the variables with Minitab 13. These processes enabled us to identify missing or illogical responses. Generally, missing responses were few and random. Where the data were missed during data entry, such values were entered after cross-checking in the questionnaire. Where the omission was made by the interviewer, the missing data were imputed only for the socio-economic proxy indicators. This was done by examining the scores of the other related variables, comparing them with those of other households, and finally adopting an average of scores (of the missing data) from the other households with similar scores. The data was also cleaned of all illogical responses-a response considered inappropriate-arising due to errors during data entry. For example, the variable "sex" was coded as "1" for "male" and "2" for "female". If a frequency run returned records such as "11" or "22", these values were recoded as male and female respectively. We applied the same process to all the variables. Data analysis All the descriptive statistics and data transformation were run by means of Minitab 13, and the tables and graphs developed using MS Excel. RESULTS The number of households included in the study is summarized in Table 1 below. Results for 3 villages (thus 21 households) in Nakawa HSD were excluded, because they were received after the analysis was too advanced for time to allow. With exception of Nakawa HSD, most families were living in poor, mud-and-wattle, grass-thatched huts, and surviving mainly on subsistence agriculture, or petty trade such as small lock-up shops. The majority of the household heads, or spouses, either never went to school at all, or only attended primary education. 52.8% of the households did not have any means of transport while 41.4% owned bicycles as additional means of transport. The majority (74.6%) of them had at least one or more of the common domestic animals, which families normally dispose off in times of need-chicken, goats, sheep, cattle, etc. Morbidity pattern i. Proportion of people reported sick by quintile groups Table 2 shows the pattern of reported ill-health by personal characteristics and some of the proxy socioeconomic indicators that showed wide variation among the household studied. Children below 5 years of age were far more likely to suffer ill-health or injuries than the older counter parts. Although females also tended to be more prone to falling sick than the males, the difference in risk suffered by them was generally marginal. The education status of the household heads or spousesdid not seem to have a clear influence on the pattern of ill-health, except in Nakifuma and Nakawa divisionwhere households with more educated heads and spouses reported less ill-health than those with lesseducated counter parts. With regard to occupation, the peasants generally experienced greater ill-healththan those engaged in more gainful employments. Overall, the poorest quintile groups were more likely to have suffered from one or more sicknesses or injuries, than the richest quintile group (Fig 1 below). The differences in susceptibility between the poorest and richest quintiles were not marked, except for Nakawa division (Kampala), where the poorest quintile group was 2.4 times more likely to have been ill than the richest quintile group. In Maracha HSD, the poorrich distribution of ill-health was even reversed, with a smaller proportion of the poorest quintile group (35%) reporting any sickness or injury compared to the richest quintile (40%). (Table 3) ii. Most common sicknesses suffered By far, the most commonly reported sicknesses at all the sites were fever/malaria (23%), either alone or in combination with other conditions, and respiratory tract infection (11.3%), alone or in combination with other conditions. There was no difference in the pattern of sicknesses/injuries suffered, whether by study sites or by socio-economic groupings. Accessibility to health services Accessibility to public health services was analysed by the different socio-economic groups, and the results are presented in the table below. The overall level of accessibility (proportion of the population living within 5 km of any government or PNFP facility) was high (above 80% for both quintile groups, at all sites). Nevertheless, a higher proportion of the poorest quintile groups lacked access to healthcare compared to the richest group; the exception, again, being Maracha HSD, where there was no difference in accessibility between the poorest and the richest quintile groups. The less educated, peasants and small business owners were more likely to lack access to healthcare than those engaged in more profitable businesses or gainful employments. Health-seeking behaviour i. Pattern of healthcare use by site This section describes the types of healthcare providers first consulted when individuals fell sick or got injured. The providers in the formal sector were referred to by the types of the facilities they practiced in. Each provider category in the informal sector included both the hospitals as well as the peripheral or lower level units (health centers). Table 4 summarises the pattern of healthcare use by site, disease type, perceived severity, and education status of household head and spouse. The rates of modern medical care use were high (above 80%) at all the sites, except in Nakifuma HSD, where it was relatively low (74%), with about a quarter of the sick preferentially seeking care from traditional providers. The private-for-profit services were the most frequently consulted, and the PNFP services the least, at all the sites. The use of PNFP services was similar for the HSDs in West Nile region (Padyere & Maracha), as well as for those in the Central region (Nakifuma & Nakawa)-being slightly higher in the former than in the latter. The pattern of provider preferences was neither related to the disease conditions nor their perceived severity. It was also independent of the education status of the household head or of the spouse. However, individuals with either mild or moderate conditions were more inclined to consulting the PFP and traditional providers, or to 'doing nothing' about them, than those who felt their conditions were severe. On the hand, there was a greater tendency by those with severe conditions to seek care from government or PNFP facilities than those with less severe conditions. ii. Specific provider preferences by quintile groups The figure below shows how individuals in the extreme quintile groups responded to sicknesses or injuries. (Figure 2) The graph shows that: a) Both the poorest and richest groups were more inclined to use the private-for-profit services than the services offered in the government or PNFP health facilities. However, the richer quintile group used these services 1.5 times more than the poorest quintile group. b) Although the poorest group relied more on the private-for-profit services, they used the services in the government units 1.5 times more than the richest group. Use of PNFP services was the same for both quintile groups. c) The poorest people were more inclined to treat them selves or use traditional care than the richest ones, and they were least likely to seek modern medical care than the richest group. iii. Reasons for the observed provider choices The most important reason cited for seeking care in the private-for-profit (PFP) facilities (mostly clinics and drug shops), as the first options for modern medical care, was nearness (41%). Other factors included the perception that the sicknesses were mild (about 15%), and therefore did not necessitate any "serious" attention. Another 15% of the respondents also felt that the services in the private clinics were 'affordable' because, in the words of one respondent in Padyere county (Nebbi), "with the little money one can 'get something', which is unlikely if one went to a government or PNFP unit". Quality was not an important consideration for choosing private clinics as the priority option for care. However, quality was the most prominent reason for those who first sought care either at the government-owned units (cited by 62% of them) or the PNFP health facilities (30% of them). The second important consideration for those who preferentially consulted these provider categories was nearness, mentioned by 17% of those who first consulted a government unit, and 27% of those who first consulted a PNFP facility. The majority (45%) of those who used traditional care did so because they felt the conditions were mild. Another important reason was lack of money. Lack of money and the perceived mildness of the conditions were also the most frequently mentioned reasons why some people 'did nothing' about their conditions. iv. Pattern of retreatment Table 6 shows the pattern of healthcare use for those who sought further treatment for the same conditions. "Further treatment" referred to treatment sought, for the same episode of the reported illness, after a partial or complete course of treatment from the provider first consulted. About 22% of all those who sought some form of care before had to seek further treatment because their conditions had not improved. The rate of retreatment was highest (about 55%) among traditional care users and least (15%) among the modern PFP care users. The poorest quintiles were 1.2 times more likely to seek further treatment for their conditions than the richest groups. The pattern of provider choices was similar to those observed during first treatment attempts. That is, the majority of those who sought further treatment went to private-for-profit providers from various other sources. However, the majority of the private-for-profit care users, sought further treatment at government facilities (6%). A very small proportion (2.2%) fell back to traditional medicine after treatment from various sources. v. Pattern of health care use during child birth Table 6 shows the type of care preferred by mothers during child birth, 12 months prior to the survey. The "preferred" providers are those who were first consulted during the processes of labour. They do not necessarily represent the facilities where the mothers finally delivered from, or the providers who finally delivered them. The use of modern healthcare during child birth was lower (56%), compared to the use of such facilities during illness and injuries (84%). However, unlike in the case of illnesses or injuries, government-owned and PNFP health facilities were the more frequently used of the modern type of care, than the private-forprofit ones. The proportions of mothers that first consulted TBAs and untrained relatives were generally high, very much comparable with the rate of use of PNFP services. In fact in Maracha HSD, the number of mothers who preferentially consulted TBAs or untrained relatives exceeded, by far, the number of those who went either to the government or PNFP units. There is no clear pattern regarding the independent influence of education status of household heads or spouses, and of occupation of household heads, on the choice of services within the formal sector. The same could also be said of the informal sector. The effect of the relative socio-economic positions on the choice of providers during child birth is illustrated by Figure 4 below. The graph above shows that a) Mothers in the richest quintile relied more on government or PNFP facilities for child birth than on Private-for-profit units, traditional birth attendants or untrained people. They were 1.5 times more likely to deliver in a government-owned facility than in PNFP units; and 15 times more likely to do so than in private-for-profit facilities. b) The poorest quintile, too, relied on government services for childbirth, but to a lesser extent, comparable to their dependency on traditional birth attendants or untrained relatives. Mothers from the richest quintiles used government owned- or PNFP facilities far more than the poorest quintiles for child birth-more than twice as much in each case. vi. Reasons for provider preferences during child birth The perceived quality of services was the single most important reason for the pattern of choice in the formal sector. For example, 63.3% of the mothers who first consulted government provided maternal services did so because of the perceived good quality. Similarly, 74.4 % of the mothers who went to the PNFP provided services did so for the same reason (quality). Distance was the second most important reason for the pattern of choice. In fact it was the most important consideration for the mothers (76%, n = 7) who went to the Private-for-profit facilities for child birth, and for those who resorted to the traditional birth attendants (57.8%) or untrained relatives (36.4%). However, the majority of the mothers who sought no care, or resorted to untrained relatives, did so mainly because they expected to have normal deliveries, and were more comfortable doing so at home. Financial barriers (fees at the point of delivery) did not feature as an important reason determining the observed pattern of health care use. Pattern of healthcare spending The expenditures reported here were those incurred in pursuit of treatment during the first consultations, or attempts at treatment. The cost of retreatment was not considered because of the large amount of missing data in that regard. The total expenditures included all healthrelated expenditures for a given episode of a condition with respect to the first provider consulted. The median expenditures by the top quintile groups were higher than those by the bottom quintile groups, at all the sites. For better comparison, it was necessary to compute the proportionate expenditures-the median expenditures as percentages of the total monthly per capita expenditures (median per capita consumption per month). The latter information was not captured by this study. We accordingly applied, as the denominators, the consumption data in the UNHS, Report on Socio-economic Survey (UBOS 2003). The report provides the median monthly per capita consumption, adjusted to adult equivalents, by deciles (not quintiles), and for rural and urban areas (not specifically by the sites studied). Therefore, consumption data (for the top and bottom deciles) for rural areas were assumed to apply to all the rural sites of Padyere, Maracha, Nakifuma. Similarly, the consumption data for the urban areas were applied to the respective deciles in Nakawa healthsubdistrict (being an urban sample). The (proportionate) healthcare expenditure pattern was accordingly examined by the extreme decile groups and is presented in figure 4 below. In the rural areas of Padyere, Maracha and Nakifuma health subdistricts, the pattern of healthcare spending was regressive, with the wealthiest 10% spending less of their total consumption on health than the poorest 10%. This was most notable in the health subdistricts of Maracha and Nakifuma. This finding is reversed in the urban health subdistrict of Nakawa (Kampala), where the wealthiest 10% tended to spend a higher proportion of their consumption on health than the poorest 10%. We also looked at median per capita expenditure by providers and the main expenditure categories investigated. The results are as summarized in the table below. (Table) The PNFP facilities were the most expensive to the patients, and the government units were the cheapest; in the latter case, a big proportion being spent on transport or unofficial expenses. The financial costs of the private-for-profits facilities (clinics, drug shops, etc) were comparable with those of the traditional care providers. (Table) Just about 2% of the private healthcare expenditures were from funds that had been specifically saved for healthcare. Otherwise, most of the out-of-pocket payments were from savings meant for other purposes, from funds raised by selling household assets and/or from borrowed money. The poorest individuals (unemployed, less educated) were much more likely to dispose off their assets, or borrow money, in order to fund their medical treatments, than their wealthier counter parts, who, on the other hand, were in a better position to put some money aside for healthcare or otherwise. There was a high rate of asset disposal in Nakifuma HSD, despite the relatively high level of saving in the study area. DISCUSSION The survey attempted to examine the extent of inequality in health states, accessibility to healthcare, healthcare use and health expenditures between different socio-economic groups. Most of the findings are not surprising, merely confirming the usual observations regarding the direction of inequality with respect to the dimensions assessed here. Morbidity pattern a) Distribution of ill-health by quintiles The study confirms the usual observations that the poorest of society tend to suffer more ill-health than the better-off, even though the difference in susceptibility was not marked, and even reversed in Maracha healthsubdistrict. This marginal difference could have arisen from a systematic difference in reporting of ill-health between the poorest and the richest quintiles. The poor tend to accept ill-health as a normal aspect of life (Makinen M., et al, 2002). The concept of ill-health also tends to vary among the educated (and normally better-off) and uneducated (and normally poor) people, with the poor taking disease conditions less seriously, especially if they are perceived as mild. This is especially true of respiratory conditions. Systematic differences such as these could have resulted in poorer reporting of ill-health on the part of the poorest groups than their wealthier counter parts. b) Types of conditions suffered There was, however, no difference in the types of ill-health suffered by the poorest and quintiles. The most commonly reported conditions were malaria or fever and respiratory infections, either occurring alone or in combination with other problems. In other words, there were no special health problems related to the different quintile groups (e.g. the poorest quintiles and the richest quintiles). So are the poor receiving the same benefit package as the better-off, given that the spectrum of conditions suffered was the same? If so, do they have the same access to them, or consuming them to the same, or greater extent, as the rich? This survey did not specifically seek to specifically answer these questions. But we know that, in Uganda, all public (government and PNFP) facilities normally, or are expected to, provide, as a minimum, a package of care that addresses the common problems affecting of the all citizens. There have even been deliberate attempts to target the minimum package more at the poor, by directing more public subsidies to the peripheral health centers and PNFP facilities. This has been on the understanding that the poor will preferentially use these facilities. To encourage uptake of the services by them (the poor), the government even abolished user fees in government units in 2001, and the PNFP sector has been selectively reducing user fees for the most vulnerable (pregnant women and children). Access & opportunity costs As expected, the survey reveals that, generally, a higher proportion of the poorest quintile lived more than 5km from any government or PNFP health facility than the richest quintile. A bit of caveat, though. Because most of the people interviewed did not have a good sense of distance; and that the reported distances were mere estimates rather than exact figures, the figures presented may not the most accurate picture; nevertheless, we do think they reflect the general pattern in accessibility to health care. Members of poor households in Africa typically face longer journeys to obtain healthcare, than their wealthier counter parts (Castro-Leal F., et al 2002). The long distance traveled by the poor has a bearing on the total economic costs suffered by them, especially in terms of out-of-pocket expenditures on transport and time spent away from survival activities. The latter, logically, represents a much greater opportunity cost for the poor than the better off. These costs can dominate the decisions to seek care. Pattern of healthcare use for "normal" illnesses or injuries As afore mentioned, the conventional wisdom is that the poorest households will preferentially, or exclusively seek modern medical care from government-owned health facilities. This was not the case in this survey. We found that the poorest quintile was about 1.5 times more likely to use private health care-for which they had to make out-of-pocket expenditures at the points of service delivery-than the normally free government services. Distance was the most important consideration for this choice, underscoring the significance of the opportunity costs involved in seeking "free" care from the government health units. The majority of those who preferentially used government and (PNFP) services did so, not because they were "free" or affordable to them. It was because they perceived the quality of the services offered in those units as being good, or because they were near enough to them. This finding disproves the reasoning in some quarters that "free" services normally encourage frivolous use of resources. It implies that the opportunity costs of "free" care might just be too expensive for the majority to afford, including the poor. Studies else where also reveal that the poor are usually willing to pay more of their income than the "non-poor" (in proportionate terms) to reduce the distance traveled (Lavy & Germain in Castro-Leal F., 2002). Therefore, the challenge is to make services more easily accessible to the poorgeographically and otherwise. The demand of healthcare is normally sensitive to the quality of services provided as well. Even poor households limit their demand for healthcare when services are of poor quality, although they are less sensitive than the rich. The quality of services offered in the private facilities is normally suspect, particularly in rural areas. The fact that quality was a less important reason for seeking care in the private facilities tends to underline this fact. Yet, most of the poor and the better off still preferred them, even in the rural areas, because they could not afford the opportunity costs of the "free", better-quality services! Pattern of healthcare use for child birth Healthcare use during child birth was the reverse of what we observed regarding ill-health or injuries. Wealthier mothers used government and PNFP facilities far more than the poorest individuals. The poor actually used government services approximately to the same extent as the care provided by the TBAs or untrained relatives and friends. This utilisation pattern and the reasons thereof, are not entirely surprising. Many poor mothers normally prefer to deliver at home, especially if the pregnancy is perceived to be normal. The rate of utilisation of antenatal care services in Uganda has been shown to be higher than the rate of deliveries in the modern facilities. Most of the mothers delivering in the formal sector are usually those with perceived risks. As such the pattern of healthcare use tends to reflect the perceived abilities to handle those risks. This, partially, might explain greater preferences for the government provided, PNFP and TBA services. The rich, or the better educated, are usually more sensitive to quality differences than the poor; it is therefore not surprising that the better-off used government and PNFP services more than the poorest groups. Apart from quality, the pattern of use might be a reflection of availability of services. Most of the for-profit facilities do not offer antenatal or delivery services. So it goes without saying that the government and PNFP facilities are expected to be used more by either of the extreme quintile groups than the for-profit facilities. Healthcare expenditure The large number of the poor and the better-off visiting the private sector suggests that the study population could be spending large amounts of resources in the private sector. This is typical of most resource-poor countries, whereby populations with low per capita income tend to have the highest shares (in proportionate terms) of private spending. This is illustrated by the spending patterns at the rural sites, and in Kampala (Nakawa HSD). The distribution of healthcare spending was found to be regressive in the rural areas, with the poor devoting a higher proportion of their total monthly consumption on healthcare. Healthcare spending was found to be progressive at the urban site. Rich people in urban centers normally use services at a higher rate. They also tend to 'opt out' of the services provided by the subsidized government providers. This observation is worrying, given that the most disadvantaged (unemployed, less educated) were likely to fund their healthcare by disposing off their assets, or through borrowed money, than their wealthier counter parts; more over in the face of growing poverty in the rural areas. CONCLUSIONS The results confirm initial expectations. They point out what has been demonstrated elsewhere. For example, they show that the poor, as well as the better-off, are spending large amount of resources in the private sector. Yet public subsidies are largely directed to the public facilities, especially government health units where the services are free at the point of delivery. They also reveal that financial constraints are, but only one of the many constraints affecting the health seeking behaviour of the individuals. The observed healthcare use pattern reflects not only financial barriers, but also the opportunity costs in travel (and possibly waiting) time. Other important factors affecting healthcare use included their availability, affordability and the perceived quality of services. The non-financial barriers tended to outweigh financial considerations, rationing services in favour of the better-off. The type of socio-economic index applied in this research is based on proxy indicators and is arbitrary. Nevertheless it is useful for demonstrating the direction of inequality in the health sector. To that extent, it can be a useful policy guide. More sophisticated methods using multivariate analysis could have disentangled some of the findings. Nevertheless, the experience in this study underlines the importance of conducting research using methodologies which are comparable both within and between countries. Acknowledgements We are grateful to Paula Braveman, Dr. Bwete Vincent, Dr. Gavino Macocco and Dr. Orach Sam for their useful comments on various sections of this document, particularly the methodology applied. Bibliography
|