 |
| About Bioline | All Journals | Testimonials | Membership | News |
|
||||||
|
||||||
Health Policy and Development Journal, Vol. 3, No. 1, April, 2005, pp. 54-67 DIRTY DATA: DISEASE SURVEILLANCE IN ARUA DISTRICT, UGANDA Driwale Alfred Head, Maracha Health Sub-District, Arua District Code Number: hp05009 Abstract Integrated Disease Surveillance is the current modus operandi for emergency and disaster preparedness and Response in Uganda. In this article, the author presents a detailed analysis of one component of disease surveillance - reporting, as conducted in Arua District in 2001/2002. Although time has passed and changes for the better may have taken place, the article raises a number of issues and practices common to surveillance systems in other places. These include lateness of reporting, incomplete reports and most importantly, data inaccuracy. The article highlights managerial weaknesses in the management of the district health system that greatly affect disease surveillance. Finally, even before the Ugandan Ministry of Health introduced its now (in)famous 'League Tables' the author proposes models of categorising Health Sub-Districts according to performance, effectively suggesting a precursor to the current tables. Introduction
Epidemiological Surveillance, the ongoing systematic collection, analysis, interpretation, of health data in the process of describing and monitoring a health event, with the objective of supporting the planning, implementation and evaluation of public health interventions and programs (WHO, 1997), is an important component of any public health system. The data collected usually describes the incidence of diseases. They may include risk factors, disabilities or health practices in the communities. In practice, disease surveillance is a management tool essential for prediction, prevention, timely detection of epidemics and response. It may also be used in planning for resources, monitoring, and evaluation of health programs and quantification of health problems. Surveillance systems commonly use data collected routinely in the course of patient care, laboratory reports, surveys, and sentinel laboratory data for specific diseases. Functionally, the surveillance system may be sub-divided into four main component stages. These are data collection (clinical case detection, laboratory case confirmation, and case registration), data reporting (upward transfer of data to the next higher level in the health system), data analysis and interpretation (processing, summarisation into relevant information for decision-making and dissemination) and finally, feedback (communication from the data-receiving levels to the data collecting points). This study mainly concentrated on the data reporting sub system in Arua District. A system that reports properly sends accurate and complete reports to the next level of the surveillance system in time. Global perspectives on disease surveillance A surveillance system for diseases of epidemic potential for developing countries was developed in India in the past decade. The system combines Government and private sectors, with every hospital participating. The reason for the success and sustainability of this model is the simplicity of reporting procedure, low budget, private sector participation, personal rapport with the people in the network, regular feedback of the information through monthly feedback, and a visible intervention upon reporting. Surveillance systems in Africa are generally weak and characterized by vertical programs, delayed reporting, and low level of involvement of laboratories to confirm cases or outbreaks (WHO, 1999). In Zimbabwe, it was found that only 31% of the reports from the city primary care clinics were timely. The same findings were true for the rest of the WHO member states of Africa (WHO, 1999). A study in Mauritius in 1996 found incomplete filling of medical records generalized shortage of staff, low awareness among staff of the importance of the system, lack of feedback and lack of utilization of information at the point of collection to be factors contributing towards poor compliance with the surveillance schedule, (WHO/AFRO, 1997). Due to the problems above the WHO regional office for Africa has proposed to strengthen the national disease surveillance systems of the member states using an integrated approach (WHO, 1999). Implementation of the Integrated Disease Surveillance and Response (IDSR) started in 1998 in Tanzania with the rest of the countries in the region starting by 2000. At the time of this study, the implementation in the Great Lakes Region of Africa stood at 52%. Disease surveillance in Uganda
The concept of surveillance as we understand it today was introduced into the Ugandan health system through the vertical programs like Expanded Programme of Immunization (EPI) and Control of Diarrhoeal Diseases (CDD). They had parallel surveillance systems in addition to informal surveillance systems for specific diseases like rabies, malaria and others. Each program allocated resources specifically for surveillance. This inefficient use of resources and duplication of services also eventually increased pressure on the health workers at the data collection points who had to respond to the requirements of each program. In 1997, the Ministry of Health introduced the Health Management Information System (HMIS) with the objective of providing health managers with information for decision-making. This enabled the information about diseases of national interest to be sent in one report. In 1998, member states of the African region of the World Health Organization (WHO-AFRO), Uganda inclusive, adopted the Integrated Disease Surveillance (IDS) strategy to strengthen the national infectious disease surveillance system with the main objective of early detection and response to communicable diseases. This strategy aimed at optimizing the use of scarce resources targeted for surveillance. This eventually gave rise to the current Integrated Disease Surveillance (IDS) system in all districts of Uganda. The national health policy of Uganda provides for the establishment of a Health Management Information System and a national health database (MOH, 1999). This is in the hope that the system will provide an objective basis of monitoring the achievements in disease prevention. This could also improve monitoring of epidemic and disaster preparedness, intervention against diseases targeted for eradication, control of communicable diseases, monitoring and evaluation of overall sector performance. The first Health Sector Strategic Plan (HSSP I) translated these policy objectives into specific guidelines for action. As a strategy for epidemic and disaster preparedness and response (E/DP&R), the Plan prescribed IDS and community-based surveillance as measures to control, manage and prevent health emergencies on a continuous basis (MOH, 2000). The main objectives of E/DP&R are detection, and prompt response to health emergencies of public health importance. Its target is to have a functional IDS system in place by integrating disease surveillance into community health, building capacity for surveillance and maintaining a system for surveillance of endemic and epidemic emergencies (MOH, 2000). The restructuring of the national health system has left it with an array of levels of administration ranging from the national to the village level. Health units at all levels collect weekly and monthly surveillance data and prepare reports on specific pre-designed forms, which are sent to the Health Sub-District (HSD) and later to the District office. The District office then sends these reports to the MOH. For the data collected to be useful, they should be analyzed and interpreted at every level, especially at the point of collection. They should be reported to the higher levels in time for appropriate and timely actions as may be required. Disease surveillance in Arua district
Arua district, located in the north-western West Nile region of Uganda, had seven HSDs (Ayivu, Vurra, Arua Municipality, Maracha, Koboko, Terego, and Lower Madi) and 62 health units at the time of the study. In order to strengthen disease surveillance, the district had undertaken specific capacity building measures at the different levels of the health system like training HMIS focal persons for each HSD and some health unit staff, and recruiting Records Assistants for the health units. Specific budgetary provisions were also made to ensure the availability of some resources for surveillance activities. Problem statement
Although there were significant improvements in the reporting of HMIS data nationally, with the national average scores of the weekly surveillance being 82% for timeliness and 86% for completeness, Arua district was performing far below the national target of 80% (MOH, 2002). Between March 2001 and March 2002, only 39% of the Weekly Surveillance Reports from of the health units in Arua district had reached the MOH. Although the reporting structures for surveillance existed, the District Health Management Team (DHMT) had expressed dissatisfaction with the reporting of HMIS data during their supervision meetings. Money had been spent on the training of health unit staff and district focal persons and data was being collected in health units. The performance scores above seemed to suggest some operational difficulties. There was the risk of an epidemic occurring unnoticed and taking the district health authorities too long to respond. It was thought that information obtained with this study could be useful for better management of the district disease surveillance system, especially because there were already other initiatives and programs aimed at eradication of diseases such as polio, guinea worms, onchocerciasis, etc. The aim and objectives of the study
The study aimed at assessing the reporting component of the disease surveillance system in the district (HMIS and weekly surveillance) in the financial 2001/2002. Assessing the timeliness, completeness, accuracy and the reasons for the poor performance in these parameters could help the district tackle their root causes and help improve their preparedness. The objectives were
Methods
At health unit, Health Sub-District and District levels, we reviewed the records of two HMIS reports (monthly report and weekly surveillance report) for the year 2001/2002 and interviewed the health workers responsible for the HMIS to identify the factors influencing data reporting. Assuming 60% of the units to be reporting to the District level and accepting a margin of error of 5% at the 95% level of confidence, we determined that the acceptable minimum number of records representing the entire study population of records would be 384 records of each report by using the formula [sample size = P (100-p)/d2]. Since we had seven Health Sub-Districts, we got a minimum of 55 monthly reports and 55 weekly surveillance reports per Health Sub-District for the whole year, or a minimum of 5 records per HSD per month. We analysed 6 records of each form per HSD per month. The study variables were timeliness, completeness, accuracy and the factors that affect data reporting as detailed below. We assessed performance in each of these variables against the standards set by the Ministry of Health. Regarding timeliness, the ministry required that 80% of the expected weekly surveillance reports should have reached the district by Tuesday of every subsequent week and that 80% of the expected monthly reports should have reached the district level by the 14th day of every subsequent month. For completeness, the ministry expected two approaches. First, there was completeness in the sense of having enough reports and, second, there was completeness in the sense of having the report forms fully filled in. The first parameter measured completeness at the district level (80% of expected reports received from health units by dates above) while the second parameter measured completeness at health unit level (80% of the forms completely filled in at the health units). We assessed accuracy by comparing the individual reports with the data sources (case registers) at the health units for concordance. For the accuracy of the monthly reports, we used records of two common and killer diseases (malaria and diarrhoea) and the records of two common notifiable diseases (dysentery and measles) to verify the accuracy of Weekly Surveillance Reports. We randomly selected two months (October 2001 and April 2002) and three HUs per HSD for this exercise. We obtained the factors influencing data reporting by interviewing key people involved in the management of data at all levels in the district using an interview guide and checklists. We interviewed all the members of the District Health Team and the individual Health Sub-District Management Teams. We modified Table 2 of the WHO checklist for surveillance and used the modified version to guide the interview. While at the HSD, we tracked the late reports earlier identified at the district office in order to verify the points of delay in the health system. We tracked one late report per randomly sampled health unit and interviewed the person in charge of the unit in charge, the senior nursing officer and the records assistant for an explanation for the delay. We studied late reports from 21 lower level health units (3 per HSD) and all hospitals and HC IV. Findings
Completeness at district level
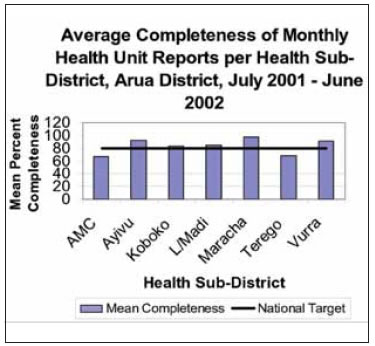
The number of monthly reports received was expressed as a percentage of the reports expected from the health facilities in that month. However, during data collection, the reports for the month of June had not been received at the district. The district an overall mean completeness of 83% (median 100%). The worst performer was Arua Municipality. The District had had its best performance in completeness during the months of September 2001, April 2002 and May 2002 (Median 100%) and the worst performance in July 2001. Against a national target of 80% Completeness per month at the district office, the performance by the HSDs is shown in Graph 1 below. Most of the sub-districts met the national target for completeness at 80%. Table 1: Percentage completeness of monthly reports per HSD (July 2001 to May 2002)
For completeness of the Weekly Surveillance Forms submitted to the DDHS' office, we counted the reports received per month and expressed them as a percentage of those expected in that month. This is summarised in table 2. Table 2: Completeness of weekly surveillance reports per HSD
Over the study period, the overall mean monthly completeness of the Weekly Surveillance Forms was 27% ranging from 1% in the month of February to 81% in May 2002. There was a general tendency to improve in reporting to wards the end of the financial year as shown by the moving average in Graph 2 below. In general, the compliance of the individual HSD in submitting the Weekly Surveillance Forms was not only very poor but also fluctuant, with a mean of 27% (range: 21% - 36%) and a median of 24% (range: 18% - 40%) Completeness at health unit level We assessed the completeness of the monthly reports using the second aspect of completeness, the filling in of all the provided spaces at health unit level. Table 3: Completeness of weekly surveillance reports per HSD
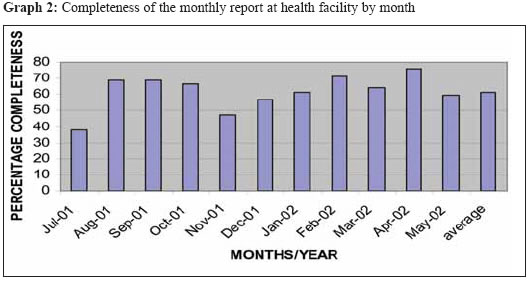
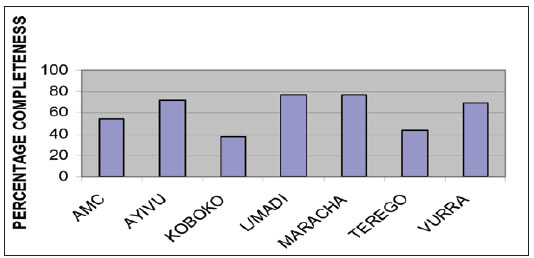
On average only 62% of the reports sent by health facilities were complete, varying between 38% and 76% throughout the year.Graph 2 illustrates monthly variation. The level of completeness varied greatly among the HSDs. A wide difference existed between them, ranging from 38% to 77% as shown in Graph 3 below. There were more serious variations in the completeness of the weekly report over time as shown in Graph 4 below. There was even a total breakdown of the weekly surveillance system in the month of February 2002. Timeliness at district level
We assessed the timeliness of reporting to the district by determining the percentage of of the monthly reports received at the District office by the required date as shown in Table 4 below. Table 4: Timeliness monthly reports at the district office
On average, over the study period, 55% (range: 38 - 76%) of the monthly reports arrived at the district in time as expected. There was no particular monthly trend in timeliness. However, the timeliness per subdistrict varied greatly with average timeliness ranging from 24 to 88%. Arua Municipality HSD had the worst timeliness average despite being at the District headquarters. We also assessed the timeliness of weekly surveillance
reporting by comparing the date of receipt of the report at the district to the date on which the reports Table 5: Timeliness of weekly surveillance reports per HSD at the district
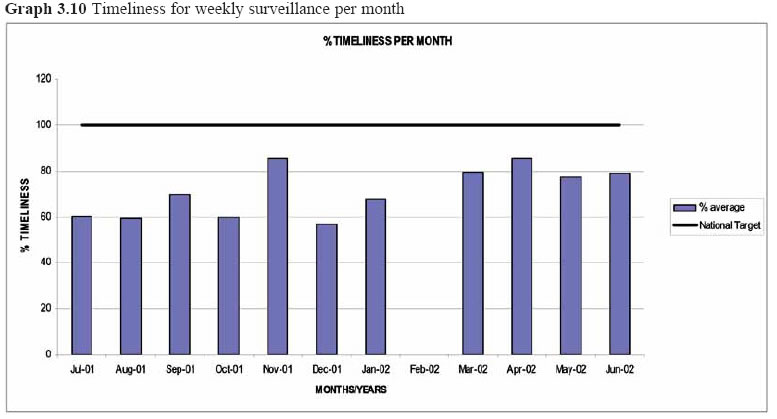
The timeliness of this report was generally poor. Compared to the national target of 100%, the timeliness per HSD was only of a median of 69% (range: 44 - 100%) and an average of 65% (range: 42 -83%), with Maracha HSD being the slowest reporter . The median is a more reliable indicator because there were extreme values (0 to 100) observed. During the month of February 2002, there was a complete break down and no report was received on time from all the HSDs. These trends are shown in Graph 3.10 below. Accuracy of reporting
The accuracy of a report tells the manager whether selected HUs (3 per HSD) by cross-checking the the report should be acted upon or not. It makes the reported records against the registered records of two manager decide whether to deploy resources to indicator diagnoses responsible for the highest contain a situation or not and whether any action morbidity rates. There were general inaccuracies in should be taken or not. The accuracy of reporting the reporting. The findings per HSD were aggregated was assessed in the OPD records of 21 randomly and are presented in Table 6 below. Table 6: Accuracy of the monthly report for two diagnoses
+ sign = over-reporting There was a general tendency for over-reporting cases in all HSD for the selected indicator diagnoses. For both, there was an average inaccuracy of +8% (or the reports were only 92% accurate). In general, Lower Madi HSD tended to over-report while Terego HSD tended to under-report. For weekly reporting, the numbers of reported cases in the reporting forms were to be matched with the numbers in the case register at the facility. However, in most units we could not trace source registers and the validity of the reports were highly doubtful. Attempts to triangulate the reports with the OPD registers were not successful because the numbers of cases were so few that the percentage errors appeared exaggerated. Hence, collection of this data proved difficult and was subsequently abandoned. What factors influence the reporting system?
As shown above, data reporting in the district was below the national target of 80% for both timeliness and completeness and in some months there was a complete break down of the system. We sought for the factors that constrained the process of data reporting by interviewing the health workers. These were mainly the shortage of personnel leading to an overall heavy workload, poor managerial skills, lack of accommodation, lack of transport, lack of an innovative spirit, lack of computer training and lack of funds. Workload: When interviewed about the ability to fill the forms, the staff reported finding no difficulties with filling any of the two forms under study. They affirmed that the forms were easy to understand and simple enough to fill. However, the health units are under-staffed and have difficulties in coping with the workload of the health facilities. Due to the shortage of staff, a single health worker often has to register patients, take history and examine them, dispense drugs, give injections and dress wounds etc, all by himself or herself. With no Records Assistants in some of the HUs and no specific incentives to do the duty, surveillance is often looked at as an extra burden. Besides the time spent on compiling the reports, most HSDs spend one day collecting the weekly surveillance reports from the health units and one other day to take them to the office of the DDHS; hence two person-days per HSD per week. Given that the position of 'HMIS focal person' is not established, it means that this is a duty combined with other official duties of the person. This and other issues individually or in combination take away critical staff from the clinical care of patients. This worsens the already constrained staffing situation in the health units. The clinical staff not involved in surveillance activities expressed their frustration at the amount of work they have to do alone, since selection of focal persons has been classified as 'technical work' requiring somebody with a technical background in health issues. Managerial factors: In most of the units visited, the forms were only filled by either the person in charge of the health unit or the Records Assistant. The duty was never delegated to any other person and whenever they were out of station, the reports were never compiled. This could have a bearing to the perception of heavy work involved or to the expectation of allowances for the task. This ultimately affected the timeliness and completeness of reporting. In some cases, there was clear evidence of procrastination. We found that in 75% of the units studied, records were not analysed on daily basis as recommended. Tallying was only done at the end of a month at the time of preparation of the report. This was done hurriedly and probably contributed to the tallying errors because of the heavy workload to be completed in a short time. Staff accommodation: Two of the health units (10%) studied had no accommodation for staff at all. The staff were staying about 10 Km away from the health facilities and a substantial amount of their time was spent on travelling to the health units and back home. This affected the output at the workplace in clinical work and in data management. Means of transport: Of the health units studied, only 35% had means of transport in form of a car or motorcycle. However, all the HSDs have either a car or a motorcycle that could be used for surveillance. The main problem with transport was therefore the fear of excessive running costs for the HSD if the vehicles were regularly used for reporting and data collection. In a few units, the means of transport were used for multiple purposes, competing more favourably against disease surveillance. In any case, most of the vehicles were old and had frequent breakdowns and frequently led to simultaneous breakdown of the reporting system e.g. Koboko, Terego and L/ Madi HSDs. The HSDs also cited irregular and unreliable supply of fuel by the district headquarters as a common constraint. Communication: Transmission of the surveillance reports from one level to another was by hand delivery. No health HSD used any other means even when the option for doing so existed to varying extents e.g. telephone, radio, mail. All the HSDs had networks for mobile cellular telephones in their catchment area and 5/7 (71.4% ) had radio call facilities. None of the HSDs had ever used either the telephone or the radio call to communicate surveillance data to the district. Use of these facilities would be cheaper, faster and markedly improve the performance of data reporting in the district. This option could be used with the aim of improving timeliness but not as a replacement alternative to the use of reporting forms, which could still be sent for record purposes. Apart from the communication media, some HSDs lacked a clear policy on the flow of reports covering compilation of the data for the reports and collection of the reports after they were filled. In some HSDs, some units would take their reports directly to the district office, bypassing the HSD and there was no agreed mechanism for the HSD to get its copy. Financial resources: Given the procedures for data reporting in the district there was little need for the individual health units to budget for reporting, as their role is limited to data compilation within the facility. The stationery was provided by the district and was never out of stock in all the units for all the study period. The data were collected by the HSD. Therefore, there should have been few financial constraints for that level. In fact, the staff at the lower level health units raised no complaint about finances being a barrier to data reporting. The budget for the activity should have been at the HSD level. However, none of the HSDs had a budget specific for disease surveillance activities. However, they had budgets for disaster preparedness and response which where in practice reallocated for surveillance. For the most part, these were small amounts of money, which could not sustain the surveillance activities throughout the financial year. The highest amount was Uganda Shillings 890,000/= (about US $ 520) budgeted by Lower Madi HSD. The budgets of the other HSDs were much lower. In Lower Madi itself, the shortest distance possible to be covered by a focal person collecting reports and delivering them to the district office was 370km. Staff training: About 80% of the people involved responsible for filling the forms in the health facilities studied had received some training in the exercise. Exceptions were in Arua Regional Referral Hospital and Oriajini Hospital. However, some of the people who had been trained were not involved in compiling the surveillance forms. The consequences of not training the Records Assistant for a big hospital such as Arua could probably explain the high level of inaccuracy (+15%) seen in the hospital data - the highest among the sampled units. Some irregularities were observed in the selection of the health units and the participants for the training. Two of the sampled units (10%) were not involved in the training at all, e.g. Ludara and Oriajini. This could not be explained by a limit in the number of participants the district was capable of training because some neighbouring health units (Koboko HC IV and Wandi HC III) had sent three participants each. In fact, staff reported lack of skills in analysis of data and drawing of graphs as their major weakness. This could have suggested a weakness in the curriculum of the training but it was not possible to get a copy of it. Although all the HSD offices in the district had computers, none was used for data management, not even at the district office. Lack of computer skills was reported to be the main reason for not using them. Staff attitudes: Many staff saw disease surveillance as a vertical program and extra work that should be done for an allowance. This was mainly observed in Maracha and Vurra HSDs but could have been prevalent in others areas as well. In fact, all the HSDs reported cases where at some health units, staff were reluctant to fill the forms and the focal persons had to fill them out themselves when they arrived for data collection. This delayed the focal persons and prolonged the data collection process. It had a significant effect on the timeliness of reporting to the district. For some, reports of 'zero' cases were given to 'make life easy'. Such an attitude would have a profound effect on accuracy of reports and detection of epidemics. Finally, due to the geographical distribution of the units, some units reported directly to the district office, by-passing the HSD. This meant that, unlike the HMIS focal person for the entire HSD who was paid an allowance, the health unit staff did not receive any payment. Such irregularities in payments were found to be silently eroding the morale of the staff. On their part, Records Assistants complained of unclear job descriptions and lack of a clear career path. Demarcation of the HSDs: Finally, owing to the large size of some of the HSDs and the difficulties faced in managing them from the HC IV, some HSDs were re-demarcated. The HSDs of Vurra, Madi, and Terego did not correspond to their political constituencies. Partly due to this, we found that some of the HSDs did not to have a good mastery of the HUs under their care. For instance, Siripi HC originally under Terego but now under Lower Madi had accumulated weekly surveillance reports for three months. Neither HSD had collected them. This raised questions of who supervised the unit in other matters. Data Management at higher levels of the District Health System
Despite the presence of HMIS focal persons at the HSDs, there was no attempt at that level to combine the individual health unit reports to get the overall picture. At district level, this was done, though to a limited extent. The manner of filing the reports at the district made their retrieval difficult, with many reports getting lost. This was beginning to raise complaints especially from staff in Terego and Vurra HSDs. Handling of reports at the higher offices affects the quality of the eventual feedback given to the HSDs and the health units. Points of delay
Of the reports, which eventually reached the district office, 29% were late despite favourable dates of compilation at health unit level. Exploration suggested that significant delays were occasioned by the health sub-district level, which either failed to collect the reports from the health units or failed to submit the reports to the district office at the right time. In general, we observed a lack of capacity to handle data collection and reporting at the HSD level. In addition, some HSDs were too large to be covered in one day. Most have between 8 and 14 health units and, that apart, the units were widely scattered geographically and did not lie along a single common route for easy collection of the forms. DISCUSSION Completeness of the reports
In general, the completeness of monthly reporting was better than that for weekly reporting and the completeness of monthly reporting was better than for weekly reporting. However, we observed some occasional irregularities in this positive trend. Although the completeness of reporting at HSD was generally acceptable, the performance of two HSDs of Terego and Arua Municipal Council, which missed the HSSP target for most of the year, deserved investigation. The management of data even at district level was not as good as should be expected, for, data from one HSD were missing despite evidence of the reports having been received. The completeness of the reports at facility level was much lower than that at district level because of a number of factors. First, they measure different aspects of completeness. Completeness at district level refers to the number of health units which have reported for that month. At health unit level however, 'completeness' refers to the parts of the report that are filled. Second, the range of activities required for completeness at health unit level may not all be conducted at a particular health unit and, third, the workload of completing the report at health unit level may be too much. The monthly report (HMIS 105) has eight parts to complete: OPD and Laboratory tests, OPD diagnosis, ANC and FP activities, essential drugs, vaccines and contraceptives, outreach activities, financial summary, comments, and monthly monitoring. Some units do not provide some expected services. Activities that were not carried out by a unit either due to its level or due to lack of equipment or staff should have been indicated on the reporting forms. Failure to do so meant incomplete reporting. In fact, the section on financial reports was excluded in the assessment since the majority of the units either did not handle cash or left it blank. However, one cannot escape the fact that even when services were provided, the appropriate sections were not filled in some units. There was no uniform understanding of how to fill the form and this could leave the filling open to multiple interpretation. For instance, putting a dash sign (-), a zero, or just leaving the section blank could all mean the same thing or carry significantly different meanings to different people in different units. In most units, the dash on a form could mean that the services indicated on the form were not offered at the facility. Zeros could mean that the services indicated were available but had not been consumed in the reporting period. A blank space was the one most open to multiple interpretations since it could mean any of the two former signs. In reality, all the three responses could mean any one of the three situations. Such a detail, trivial as it may sound, grossly affected the interpretation and therefore the quality of the feedback to the health units from the higher levels of surveillance. Theoretically, incomplete reports from health facilities can be corrected at the level of the HSD by the focal person after thorough verification with the source unit. In practice, however, these people were also the data recording persons for the HSD units and given a tight due date schedule, did not do thorough scrutiny of the reports from units other than theirs. For the weekly surveillance report, a monthly average completeness of 27% for the district was far below the national HSSP target of 80%. Even the best HSD in completeness (Koboko) did not reach this target. However, a dramatic improvement was seen in the last four months of the financial year, thanks to the training of focal persons and record assistants and the graphic feedback given to the HSDs by the District office. We learnt two practical and important lessons from the improvement seen above, namely, that training improves performance and, more importantly, that feedback given influences reporting by setting a spirit of competition and motivation. In fact, the units wanted unit specific feedback in a graphic manner where they can compare their performance against that of other units and against themselves over time. Before March 2002, no HSD met the completeness criterion in the district and, in fact, there was a total breakdown of the surveillance system with 1% of the units reporting in the month of February. Surveillance reports for the first quarter of the financial year were not received for Maracha HSD. This was partly blamed on the loss of reports resulting from the filing deficiencies at the district level. Timeliness of reports
The principle behind timeliness of reporting is timely detection and response of the health authorities to the identified health event. The indicator of good performance for timeliness is that at least 80% of the reports are received timely at every level of the health system (HSSP 1999). In Arua, only 55% of the reports were received in time for timely transmission to the Ministry. Most HSDs hardly reached the 40% mark in timeliness and yet the timeliness of reporting to the district is the determinant of the districts' completeness at the national level. The findings above suggest that a lot of effort was still required to rectify the timeliness of reporting in the district in order to achieve the said purpose. On average, the district received only 65% of the weekly surveillance reports in time, which is below the HSSP target for timeliness of 80%. It raises false hope to imagine that 65% is near the target. However, the critical point is that the district receives only 27% of the expected reports from the health units, and only 65% of these (27%) reports arrive in time. This means that, on average, only data from a mere 18% of the health units could be immediately useful for planning response to epidemics in time. Accuracy of Reporting
If health data are late or incomplete but accurate, a health manager can still use them for other purposes. However, if they are 'dirty' by virtue of inaccuracies, then they are useless, misleading and could be dangerous. Using only two common diagnoses, we found that most data were inaccurate by a significant margin. One therefore wonders what the correlation would be if we were to verify the records of less common diagnoses or to go further and verify the correctness of the diagnoses. In Arua District, the management of records was quite poor. Retrieval of the old registers for the selected months was a big constraint in some HSDs. Most registers had already been dismantled and used for other purposes and as a consequence, in one HSD the verification exercise was limited to one health unit out of the expected three. Some health facilities used more than one register at a time. This posed a difficulty in retrieving them. Despite the difficulties faced the results were very revealing; agreeing very closely with the averages of the other HSDs where the required records were assessed. In general, the accuracy of reporting by the HSDs and the units was low with an average error of 7%. Over-reporting was the commonest type of error found in the health units which were sampled except in Vurra where there was under-reporting. There were no reliable sources to even test the accuracy of the weekly surveillance forms. This shows the great danger in which the district was at the time of the study, of being caught unawares by an epidemic. If there were no reliable data sources for this report, we doubt if the report itself was reliable. A composite comparison parameter
A good surveillance system should have complete reports, which are received in time at every level, and the reports should be accurate. From the preceding, we saw that HSDs differ in performance on all the parameters. Furthermore, within a HSD the performance with respect to the parameters assessed varies greatly from health unit to health unit. However, in order to compare the different HSDs (and later the different health units), a composite measure for all the aspects of reporting above needs to be obtained and used to rank them into positions- a form of league table. We attempted this by multiplying the average scores obtained by each HSD in each parameter and dividing the product of these scores by the product of the maximum score obtainable i.e. 100%. The final quotient is then expressed as a percentage (the efficiency). We do not claim that the effect is necessarily multiplicative, for it could be additive or otherwise but this was the only reasonable mechanism we thought could capture synergistic parameters of the same effect - the efficiency. We do not even claim that the three parameters have the same weight. The values obtained can be a measure of efficiency of data reporting. Owing to the irregularities in the collection of data for accuracy for the weekly surveillance, the accuracy data of the monthly HMIS 105 form were used for both reports. After all the degrees of error demonstrated were minimal and would not have changed the over all scores significantly. This could be modified in districts with good data sources. Table 7: Estimated HSD Efficiency in monthly reporting (HMIS 105)
Using the same reasoning as above, we worked out the ranks for weekly reporting. Table 8: HSD Efficiency in Weekly reporting
'Completeness' in both cases refers to completeness at the district office. These tables highlight the strengths of the HSDs with respect to data reporting. We think that this could be a useful tool to be used for effective feedback to the HSDs and which could serve as a guide to the revitalisation of effective data reporting. Conclusions
This study set out to establish the performance of the integrated disease surveillance system in Arua District, with respect to the reporting of the two commonest surveillance forms: the monthly (HMIS 105) and weekly surveillance forms. We assessed some parameters of performance such as, completeness, timeliness and accuracy as well as the factors affecting them. We observed that whereas the completeness of the monthly form at the district was acceptable, that of the weekly surveillance form was unacceptably low and with occasional breakdowns. The majority of the reports were received at the district in time but were inaccurate, with a tendency for over-reporting figures. However, there were wide differences between the HSDs of the district with respect to completeness, timeliness and accuracy. Multiple factors affected the performance of data reporting in the district, the majority being financial and administrative. However, even with the resources available then, there was still room for improvement. As a general conclusion, the integrated disease surveillance system of the district was ineffective and placed the population in danger of an undetected disease outbreak if left unaddressed. The key issues to be addressed were human resources, planning, and management. There was a need for recruitment or designation and training of staff as Records Assistants in all the health units. The available means of communication needed to be fully exploited and utilised for timely transmission of reports. There was a need for rendering somebody responsible for data aggregation, analysis and feedback at district level. In order to improve on data storage and retrieval at all the levels of the district, there was a need for training HSD HMIS focal staff in computer literacy and skills to be able to enter, retrieve and analyse HMIS data. References
Copyright 2005 - Department of Health Sciences of Uganda Martyrs University The following images related to this document are available:Photo images[hp05009g1.jpg] [hp05009g3.jpg] [hp05009g4.jpg] [hp05009g310.jpg] [hp05009g2.jpg] | |||||||||||||||||||||||||||||||||||||||||||||||||||||||||||||||||||||||||||||||||||||||||||||||||||||||||||||||||||||||||||||||||||||||||||||||||||||||||||||||||||||||||||||||||||||||||||||||||||||||||||||||||||||||||||||||||||||||||||||||||||||||||||||||||||||||||||||||||||||||||||||||||||||||||||||||||||||||||||||||||||||||||||||||||||||||||||||||||||||||||||||||||||||||||||||||||||||||||||||||||||||||||||||||||||||||||||||||||||||||||||||||||||||||||||||||||||||||||||||||||||||||||||||||||||||||||||||||||||||||||||||||||||||||||||||||||||||||||||||||||||||||||||||||||||||||||||||||||||||||||||||||||||||||||||||||||||||||||||||||||||||||||||||||||||||||||||||||||||||||||||||||||||||||||||||||||||||||||||||||||||||||||||||||||||||||||||||||||||||||||||||||||||||||||||||||||||||||||||||||||||||||||||||||||||||||||||||||||||||||||||||||||||||||||||||||||||||||||||||
| |||||||||