 |
| About Bioline | All Journals | Testimonials | Membership | News |
|
||||||
|
||||||
Health Policy and Development Journal, Vol. 3, No. 1, April, 2005, pp. 68-76 USING HMIS FOR MONITORING AND PLANNING: THE EXPERIENCE OF UGANDA CATHOLIC MEDICAL BUREAU Andrea Mandelli1, Daniele Giusti2 1AVSI Data Management Advisor Code Number: hp05010 Abstract
Uganda has been successful in implementing the national "Health Management Information System" (HMIS). This is attributed to the combined efforts of different providers operating jointly in the health system. Disease surveillance reports and monitoring of key output indicators within the health sector seem to be the areas with the most remarkable advance. But little mention has been made on the importance of the use of information for monitoring performance indicators and for management/decision making purposes. The existing HMIS makes this possible. In this paper, the authors present the contribution of the PNFP health sector to the operationalization of the HMIS and of its use as a tool geared towards performance assessment and informed management decision-making. Introduction
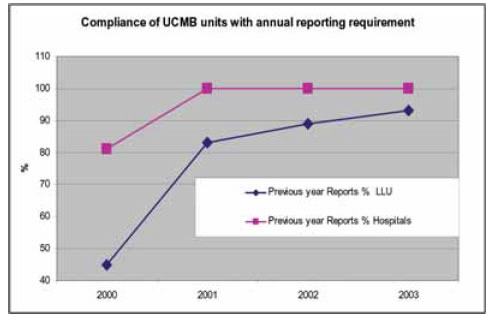
The first attempt at establishing a Health Information System (HIS) in Uganda dates back to 1985. This was mainly designed for capturing and analysing data concerning specific communicable and noncommunicable disease. It was still a vertical - or disease oriented - approach, which soon appeared to be too narrow and specific. The need for collecting and generating more useful information with a broader impact on management aspects called for a first revision of the HIS in the year 1992. This first revision process introduced an integrated horizontal approach whereby more information on management aspects could be also collected and analysed. This comprised data on human and financial resources, drugs and medical equipment in addition to the routine disease and activity reports. This new system, after a pilot phase of one year in two selected districts, was launched nationwide in the year 1997. The 1997 HMIS version required a plethora of different forms with different formats. The large amount of forms to be filled and forwarded to the centre made the process too cumbersome to reach a good level of implementation. Another review was then commissioned in the year 2000. This review coincided with other important events in the health sector: the revolution brought about by the spreading of Information and Communication Technology (ICT) and the consequent development of computerised database and databanks on one hand and the development of the first Health Sector Strategic Plan (HSSP) on the other. The review was well coordinated by the Ministry of Health with major contributions from the donor community. Under the wise guidance and long standing experience of WHO, the process received major inputs from DANIDA and USAID. The revised HMIS was launched nationwide in the year 2001 through dissemination workshops with the participation of representatives from all districts and from the Ministry of Health (MoH). A series of tools, mainly consisting of manuals and guidelines, were also distributed. The revised HMIS was clearly modified with the specific objective "to provide an integrated system of relevant and functional information on a routine basis" (Ministry of Health, 2001). It was also designed with a specific scope aiming at "reducing the number of form for monitoring the HSSP implementation and its indicators and helping as a surveillance system tool" (Ministry of Health, 2001). Another revision process, in which also the Private not-for-Profit (PNFP) sector has been heavily involved, started in the year 2004 and is in its final stages. The new version of the HMIS should be ready for use by July 2005 with the beginning of the new Financial Year and with the launching of the HSSP II (2005/09). The process of fine-tuning and introducing a final version of the HMIS in Uganda has been long and very dynamic. Despite all the changes introduced in time, the implementation of the 2001 version is well established in the health national system. The contribution of the PNFP sector is known and further documentation is offered in this brief paper about the experience of one of the umbrella organisations of the PNFP sector, the Uganda Catholic Medical Bureau. Timeliness and completeness of HMIS submissions Two main indicators prove the success in the HMIS implementation: completeness and timeliness of Out Patients Department (OPD) monthly reports. These indicators, considered key process indicators for the implementation of the HSSP I, have shown a high level of uptake of the reporting mechanisms as far as the specific OPD monthly reports are concerned (Kintu P et al, 2004). At the Central level, "Timeliness of reporting" is defined as reception of the reports, sent from the District Director of Health Services (DDHS) to the MoH Resource Centre, by the 28th day of the month, which follows the period covered in the report."Completeness" is defined as the proportion of facilities submitting reports out of the total number of units in the districts. Currently reports come from the different 56 Districts where the different District Health Teams (DHT) receive and collate reports from a total of 214 health sub-districts; in turn, these latter consolidate reports coming from the different health facilities at all levels (about 2,500, both government and PNFP). In the past two years, the two indicators mentioned have also been captured in the Annual Health Sector Performance Reports as a component of the District League Table in which districts are attributed scores according to their level of performance against a set of identified indicators. The trend of the past five years has shown a remarkable increase for both indicators: timeliness rate has moved from a national average of 21% in 2000 up to 79% in 2003; completeness rate has moved from 72% in 1999 up to 92% in 2003 (Kintu P et al, 2004). Anyhow, while the definition of timeliness is clear and easy to be monitored, the definition of completeness has opened a debate about its appropriateness. In fact, it has been observed that a lot of reports submitted are often only partially completed and show very low quality and accuracy of data. We feel that the definition so far used is a definition of "submission rates" rather than "completeness". Completeness should have to deal with the submission of HMIS monthly reports completed in all the 9 parts constituting the report's structure. This is what the Bureau has opted for as a definition of completeness: total number of forms with all necessary data, in all fields provided in the form. Success of a HMIS
As Kintu et al. 2004 have described in the already quoted document, the experience of Uganda in the implementation of a sound HMIS can, indeed, be quoted as a successful story. This is testified to by the availability of data describing the degree of compliance with regard to the two selected key indicators of timeliness and completeness (this, only limited to OPD monthly and annual reports). We need to take caution, however, that this in itself does not suffice to make an information system a tool for management. The relationship between the health information system and the health system at large
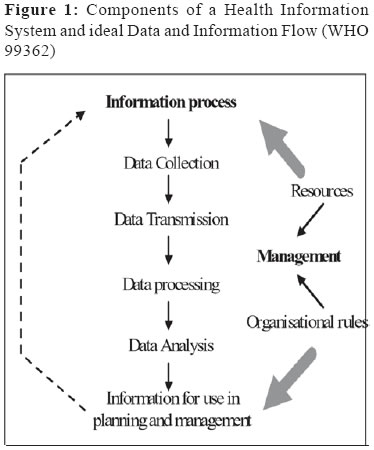
We share the view of some authors (Lippeveld T and Sauerborn R, 2000), who emphasise that a Health Management Information System is fully operational only when a set of critical factors are kept into account and reflected in practice. These factors are described by conceptual links between the health information system and the health service system at large. The HIS in the first instance is a "system" and, like each system, it has an organised set of interrelating components that can be grouped under two entities: the information process and the health information system management structure (see fig. 1). Through the information process raw data (inputs) are transformed into information in a "usable" form for management decision-making (outputs). The information process can be broken down in the following components: (i) data collection, (ii) data transmission, (iii) data processing, (iv) data analysis and (v) presentation for use in planning and management of the health services (see box). The five steps of the information process represent a set of critical pre-requisites for a well functioning HMIS. A critical review of the current situation in Uganda, with regards to these five critical aspects, may help us to understand what is still lacking to establish a fully operational HMIS. The beginning of the process is represented by the data collection exercise. This takes place right at the health facility levels and is done by health units' personnel. Currently there are a limited numbers of record assistants at the health facilities, who do not have a medical records training background. Some health units, especially level 2 and 3 do not have records assistants (Kintu P et al. 2004). The second step is represented by the mechanisms through which data collected are transmitted from the collection points to the next level. Transmission of data takes place primarily via ordinary mail, hand delivery and in few instances via fax machines. The last three steps can be lumped together and represent the core activities in terms of use of data to generate information ready to be used for monitoring, appraising, planning and managing health services at large. The exercise of data processing and analysis should take place both at (sub)district and national level to respond to different needs. But what is more important for us is the use of the generated information right at the level of the health facility. What usually happens is that the information generated out of the data submitted by units to the health (sub)district is only (and partially) used to produce reports to the MoH. In the reverse flow, only very little information is used to provide feedback to the lower level health units. Despite a well-established database that exists at the Resource Centre, a number of limitations of the system have been identified (Ministry of Health, 2003). The Resource Centre has changed 5 different types of custom written HMIS software in the last 8 years. Currently "the Computer Based System is not functional and has been so for an extended period. The currently used system, developed in 2001, cannot support analysis of data already entered and analysis/reporting format have not been adequately designed" (Ministry of Health, 2003). At district level, no uniform computerised system exists to ensure proper data management and feed back mechanisms and processes. Indeed, computerised HMIS systems could be of great help to achieve the objective of a fully-operational HMIS. They can help with regards to the critical tasks of data analysis and consequent dissemination, particularly from the centre to the periphery in order to improve the feedback, monitoring and planning mechanisms. Implementation of HMIS by Uganda Catholic Medical Bureau
In 1999 the Bishop's Conference re-defined the Mission and Policy of Catholic Health Services and mandated the Uganda Catholic Medical Bureau (UCMB) to facilitate implementation and to ensure the monitoring of catholic units with regards to faithfulness to the stated mission and to the policy compliance. At the same period the establishment of Public Private Partnership for Health was in its early stages. In both cases, these processes required a high degree of accountability. UCMB perceived then the need for establishing a database for the affiliated units in order to monitor, at macro level, variations in parameters of inputs and outputs of the units. Affiliated units were requested to submit, at annual intervals, information on a selected set of 32 parameters (26 related to inputs - 13 for financial inputs, 12 for human resource inputs, 1 for beds - and 6 related to outputs). All information could be drawn from the existing HMIS. Although 100% compliance - especially timeliness - was not reached immediately, by the FY 2000/01 a sufficient mass of information had been gathered. For few years UCMB had been insisting with its own institutions on the need for using data and information to document the PNFP contribution in terms of volume of services delivered in the national health system and thereby account to the stakeholders (Giusti D et al., 2002). At the same time, the need for moving the same type of accountability one step downwards had already become very evident. This was to make the management capable of using the information already available in a critical way to ensure a broader accountability vis-àvis access, equity and efficiency (important performance indicators for both the Mission of the RCC Health Services and the HSSP). This could not happen without the improvement of management and organisational processes. The ICDM project
This further step necessitated an extra effort. Since 2002 UCMB has been implementing a project with direct Technical Assistance and financial support from an international NGO (AVSI - Associazione Volontari per il Servizio Internazionale) aiming at improving data management and information exchange in the affiliated health institutions. The Information, Communication and Data Management Project (ICDMP) is targeting 27 Hospitals and 19 Diocesan Health Coordination Offices (these latter coordinate the work of the 230 lower health units) under the UCMB umbrella. The project's core activities focus on improved use of ICT for a sound implementation and use of a national HMIS. This has been coupled with extensive training programmes implemented in collaboration with the MoH Resource Centre and with training institutions like Uganda Management Institute and recently, Uganda Martyrs University. The initiative has three major components delivered through a technical assistance (TA) to the Bureau: (i) deployment and use of appropriate ICT solutions, (ii) use of proper data management tools and (iii) formal training of records' personnel. Another side activity worth to be mentioned has also been the production and dissemination of HMIS tools: pre-printed HMIS forms and OPD registers (during the last two financial years 36,000 HMIS forms have been printed and disseminated and 500 OPD registers have been bought and distributed to UCMB health facilities). The support of the Bureau started with ICT equipment distribution to the hospitals and the diocesan coordination offices. At the same time affordable solutions have been identified in order to improve the communication gap between UCMB and the affiliated health institutions. An e-mail network system has been developed on the GSM network, which allows e-mail connectivity to 46 remote sites. The deployed ICT has been dedicated to data management using a computer based HMIS, using the MoH format. The system, designed to improve the data entry, data processing and data analysis mechanisms, is based on four key reporting formats reproduced using MS Excel: HMIS 105 (OPD health unit monthly report), HMIS 108 (In-patients monthly report), HMIS 109 (health unit population report) and HMIS 106 (health unit quarterly assessment report). In addition to the emphasis of MoH on information produced by OP departments of health units (Kintu P et al. 2004), UCMB has insisted on the submission of monthly In-patients department reports (HMIS 108) and on the use of quarterly assessment reports (HMIS 106). These are very useful in assessing the health units' performance against the national HSSP targets and indicators. All this process has been facilitated as the Excel based HMIS programme is built using multiple sheets and multiple links that auto-generate reports, graphs and charts, beside the main HMIS and HSSP indicators and the main Hospital utilisation indicators. The graphs generated show the HMIS indicators like OPD utilisation, deliveries, ANC attendance, Immunisation, IP attendance, ALOS and BOR and also allow monitoring information on the financial flow. This approach places a lot of emphasis on the dynamics of processes taking place in the units: while it is important to have a snapshot at given point in time of what is done by the unit, things become much more interesting when the same information is placed on a time scale. The observation of trends is an easy and intuitive way of assessing performance of the health institutions and helps the management to develop a critical approach in response to sudden or apparently unjustified patterns changes over time: the information system is not exclusively used to monitor disease's trends but also offers a major impact on management processes. The production of graphs and charts does not demand any manipulation of the forms or calculations. Everything is done automatically by the Excel based programme. Capacity Building: finding the way: In the frame of the ICDM project a quick impact extensive training programme has been undertaken. Along with short training on ICT use to familiarise end users with ICT, formal training of records assistants and officers have been offered. Currently in Uganda there is no clear indication of which kind of curriculum a "Records Assistant" or a "Records Officer" should have. As a consequence, there are no formal training course offered for such positions. Through a consultative process with the MoH Resource Centre the Bureau decided to start a collaborative process with Uganda Management Institute (UMI), ICT Department, for the development of tailor-made courses on HMIS and Information and Records Management. Courses are organised combining specific modules on the HMIS, designed and facilitated by UCMB Technical Assistants on the use of the computer-based programme, with the modules already offered by the institute. There are two different modules of different duration: a first module of two weeks and a second one of three months. The first is identified as Basic training module for Records Assistants and the second one is at Certificate level, allowing Records Assistants to upgrade their skills and qualify as Records Officers. Since 2002 to date the Bureaux, with support coming from different donors, have deployed ICT equipment to all affiliated hospitals (44 in total of which 40 are also connected with e-mail) and have been able to train 40 e-mail system operators, 24 Records Assistants and 24 Records Officers. Collaboration with other umbrella organisations:
During recent years, the Private Not For Profit Bureaux have had several collaborative efforts aiming at improving the PNFP health sector performance. In the course of such collaboration it became evident that the health units of both the Uganda Protestant Medical Bureau (UPMB) and Uganda Muslim Medical Bureau (UMMB) were still a step behind their UCMB counterparts in improving their HMIS. For this reason, arrangements were made to extend a similar approach to the units of UPMB and UMMB. As result the UMMB's 3 main Hospitals and UPMB's 12 affiliated Hospitals have been equipped with ICT. These are currently using the same computer based HMIS system developed by UCMB. Formal training at UMI was organised for the concerned staff of all these Hospitals. UPMB Hospitals have also adopted the same e-mail system used by UCMB affiliated Hospitals and Dioceses. CME for management: Recently UCMB has started another project to further improve the use of the HMIS in the affiliated health institutions. This time the focus is on data and information management processes for improving Continuous Medical Education (CME) programmes. UCMB strongly believes that CME is not only strictly related to medical and clinical issues but as well as to health management issues. The joint collaboration for the establishment of the Masters degree and the Diploma in Health Services Management at Uganda Martyrs University, Nkozi, a few years ago and the recent introduction of a Certificate course in Health Services Management testifies the attention the Bureau is putting on management related issues. The experience of the Bureau has been used to develop a training module for Hospital Managers and Lower Level Health Units In-charges on "Use of Information for Planning and Management". Feedback using appropriate tools
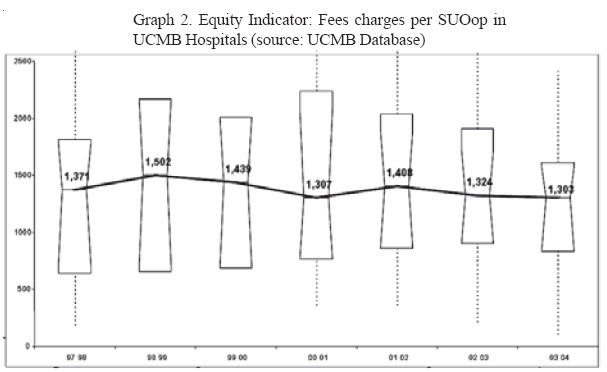
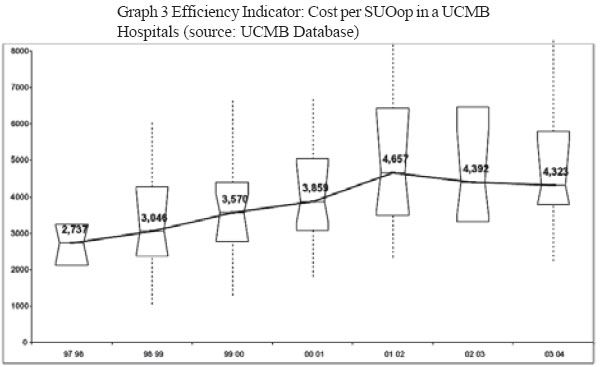
From macro to micro: So far, we have described the ongoing effort to improve use of information at unit level. There remains to explain how the existing HMIS can be utilised at macro (central) level to generate information that would not be available at peripheral level and/or that requires a certain degree of skills not widely possessed by middle level managers. It is also pertinent to clarify the methodological approach for this feedback and the important focus on the links between inputs and output, so critical for managers. As earlier said, in the course of the last 7 years UCMB has gathered raw information from all 27 hospitals (and more recently also from the largest majority of lower level health units) concerning both inputs and outputs. The availability of a fairly complete database has allowed comparisons, for selected indicators, between different hospitals, dioceses and units. This information, once analysed, has been provided to the Hospital Managers (and more recently to Diocesan Health Co-ordinators and Lower Health Units) and used to provoke discussions. For this purpose, UCMB has organised regular workshops where the results of the analysis of the information gathered is presented to the Hospital Management Teams, along with the questions raised by the analysis and the possible answers the Bureau could offer. Management Teams are challenged to provide alternative interpretations, based on their management experience. The tool used: The tool used for comparative analysis in the past three years by the Bureau (applied retrospectively on information gathered earlier on) is the "Comparative Descriptive Analysis" developed by J.W. Tukey (1915-2000). The method is known as "Box Whisker Plot Representation" and is defined as: "a way of showing a distribution on a line, so that distributions can be compared easily in a single diagram; it is used more in statistics than in econometrics. A thin box marks out the 25th to 75th percentiles; a dash within that box marks the median; a line marks the outer part of the distribution, and outside dots or stars mark outlier". The use of this analysis tool applied to the data set (using Analyse-it for MS Excel, http://www.analyseit.com) provides information about the central location (median) of a set of parameters and the distribution of the observed parameters for the set of hospitals centred on the median value. When looking at the graph, a hospital is able to identify the median value and then the position of the hospital for that parameter. The hospital is able to see if its position is just around the middle, above or below, but it is possible to compare each hospital's position with regards to the distribution of the observations from all the other hospitals. The graphic representation of the interquartiles is an easy way to appraise if the hospital falls in the mainstream, which denotes the common pattern, or if it parts far away from the mainstream, either above or below. The approach has two main advantages. On one hand, it helps to identify extreme results that could possibly suggest an error. The special marks (dots or stars) will suggest doubtful data: either extreme value thoroughly justified by the peculiarity of each hospital, or a possible error. Only the management can answer if it is an error or a justified extreme value. This point constitutes the valuable managerial application of this approach. It is also clear how this management tool can be a good example of an internal process to account to the respective boards. Accountability is exactly giving account for what happens, for good or bad, with reasonable explanations. If the explanation is that a mistake in reporting has been "allowed to pass", then the next reasonable step is to ensure that this does not continue to happen. On the other hand, and this what is more relevant, it gives a way to each of the hospitals to position own data within the range shown by all the other hospitals' data. This, in a certain way, has helped the Bureau and the managers to identify examples of "best practices" in the absence of "gold standards" for most (if not all) the parameters observed. The ultimate aim for the use of such a tool is to stimulate the desire of management to use information right at their level for the purpose of accountability and decision-making. From snapshots to aggregation: the challenge of comparability of input/output indicators: As earlier said, the static observation of any parameter, in itself, does not yield much information but trends analysis is definitely more interesting. Better still, things become much more interesting when the parameters are compared with the same in other hospitals. UCMB since 2001/02 has been providing Hospitals Managers with series of feedback on different parameters and indicators, and their respective trends, making them an object of pondered consideration and discussion in the course of the technical workshops for managers. These parameters and indicators are:
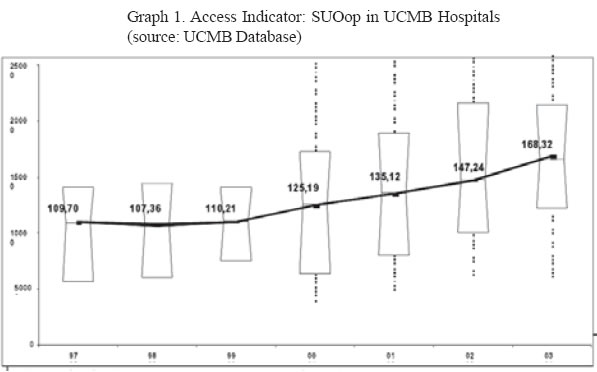
In order to go beyond and extend the comparability to input/output indicators (and respective trends) it was necessary to develop first a "composite activity index" (see box) as an aggregate output index: the Standard Unit of Output (SUOop). With this composite index available it has become possible to calculate specific indicators and subject them to the same Comparative Descriptive Analyses described earlier on. Examples of the main indicators used are:
The SUOop
The Standard unit of output (SUOop), is a composite index, that keeps into account various types of output. It provides a general idea of the volumes of the main services produced by a health unit. The choice of the parameters to be used in the calculation of the index is determined by the information routinely generated by the HMIS: Inpatients episodes (Ip), Outpatient contacts (Op), Deliveries, Immunisation doses administered, Antenatal - Mother and Child Health - Family Planning contacts. The formula used for the calculation of the SUO(op) is: 1 SUO(op) = [15*Ip episodes + 1*Op contacts + 5*Deliveries + 0.2*Immunisation doses + 0.5*ANC/ MCH/FP contacts]. The relative weights of each of these activities were drawn partly from the literature and partly from a cost analysis exercise carried our by one of the authors (Giusti D, 1993). A critical analysis on the effects of the biases introduced by the choice of relative weights has so far demonstrated that the formula developed can comfortably be used to compare the majority of hospitals in UCMB network (Beekes A, 2003). Some caution is called for in the applicability of the formula to large size hospitals. Use of information for the management of health units
Monitoring performance and faithfulness to the Mission: UCMB is aware that the PNFP health system is in a delicate transition phase, when major problems or glitches are to be expected. The development of "early warning systems" is desirable in such a complex and difficult scenario: for this the observation of trends is essential, as we have already seen. The list of parameters and indicators used by UCMB in the past three years is extremely useful and important but is quite long and may result in managers loosing focus on the key issues to be monitored. For this reason the Bureau has decided to narrow down the selection of indicators whose trends help the managers to get a clear and focussed vision of the dynamics evolving in their respective hospitals and units, assess performance and monitor faithfulness to the Mission. Four key indicators have been identified for their indirect (proxies) links with access, equity and efficiency. They are:
Concerns for improved access is intuitive and does not require extensive explanations. Equity concerns are very high both in the Mission of RCC health services and in the political agenda. Efficiency is a fundamental concept and efficiency gains must be a clear management objective in a situation of stagnating or altogether dwindling financial and human resources. Keeping these indicators balanced, maintaining positive trends or correcting negative trends is the essence of the art of management (see box). A clear example of how monitoring information can be used as management tool, is well described by UCMB past experience. At the end of Financial Year 2001/02 the following trends could be observed: the volume of service (outputs) offered by hospitals was increasing steadily, but so was the cost of the services produced and the productivity of staff was just remaining stable, when not showing declining trends. Fees, which had been decreasing for three years, had started increasing again. On the basis of this observation and banking on sound positive experiences in some of the hospitals, the Bureau launched, in the middle of 2002, a "strategy for accelerated reduction of user fees", proposing to the management of the affiliated hospitals to: (i) pay a closer look at fees actually paid by patient, with a systematic approach (baseline survey and follow-up), (ii) reduce and/or flatten fees for children and women/mothers and (iii) monitor utilisation and provide information to UCMB (see Odaga J et al. 2003). The consensus on this approach was reached at a managerial level workshop in September 2002 where managers and hospital board chairpersons agreed on the adoption of the suggested policy: after two years the results are clearly indicating that a change in a positive direction has occurred and trends are still showing a wise managerial steering process (see Graphs 1, 2, 3, 4 below): access dramatically increasing, equity improving (fees charges reducing) and efficiency increasing. It is also important to notice that the dispersion of the observation is decreasing (dimensions of the boxes around the median) meaning that a common policy implementation pushes hospitals patterns to get closer. Checks and balances between boards and managements: Corporate governance and management are two distinct and complementary functions in the life of every organisation. Without entering a more in depth discussion about checks and balances demanded by organisational life, it suffices here to mention that it has been a growing concern of the Bureau to activate the correct and complementary relationship between boards and management of health services. The HMIS and the tools developed by the Bureau through the HMIS are increasingly being used to configure the functions of Boards and Management around what is most pertinent for their distinct roles. The capacity of managements to produce meaningful and understandable information (quite often in graphic form) has made it possible to ask the Boards (often composed by non-technical persons) to exercise their powers. More and more Boards are now able to ask their respective managements questions such as:
and understand the answers given. This is a step forward in building the capacity of Boards to influence allocative decisions of managements (which quite often go unchallenged by Boards) and address with more knowledge organisational issues, as portrayed in Figure 1. Conclusion
Implementing HMIS does not only mean keeping track of the main output produced in the health system. This is what a simple Health Information System (HIS) does, while the potential use of a sound HMIS is much powerful. Its functionality is fully established when it is possible to keep track of the output produced and relate them with the inputs used in a chronological sequence (trends). The existing HMIS can be used for this and can be a tool to monitor the effects of managerial (and political - allocative) decisions. UCMB experience so far has shown that this is already possible and that the evidence produced can, in its turn, influence further managerial (and organisational) decision making, with positive effects on the life of individual health services and of the system as a whole. References
Copyright 2005 - Department of Health Sciences of Uganda Martyrs University The following images related to this document are available:Photo images[hp05010g4.jpg] [hp05010g3.jpg] [hp05010f1.jpg] [hp05010g2.jpg] [hp05010g1.jpg] [hp05010f2.jpg] |
| |||||||||