 |
| About Bioline | All Journals | Testimonials | Membership | News |
|
||||||
|
||||||
Health Policy and Development Journal, Vol. 3, No. 2, August, 2005, pp. 129-143 USING THE CATCHMENT POPULATION OF LOWER LEVEL HEALTHUNITS AS A BASIS FOR ALLOCATION OF PHC FUNDS: THE CASE OF PADYERE HEALTH SUBDISTRICT - NEBBI DISTRICT Jakor Oryema Trans-Jordan Medical Center, P. O. Box 182 NEBBI Tel. Mobile 077-619078 Code Number: hp05021 Abstract Most of the lower level health units do not have accurate records of their catchment areas and catchment populations. Yet, resources for health care are allocated to the units basing on their level or the population within a given administrative area which they serve, basing on existing political boundaries. In many places, this basis for allocation leaves the health units unable to meet the requirements of their population. Its effect is very marked in border areas like Padyere Health Sub-District, where there is a significant cross-border inflow of patients. A descriptive, cross sectional study was done with the aim of determining the actual catchment population of each lower level health unit in the HSD for FY 2002/2003 and comparing it with the figures used for resource allocation in order to study the influence of population figures on the resources allocated. If used, the population information could be aggregated with other factors that determine the cost of service delivery in order to generate a formula for a more equitable allocation of PHC Funds to the LLHUs in the HSD. The main findings were that the true catchment populations of the units varied a lot from those used for resource allocation, even among units with the same workload and level of activity. In addition, the allocation of PHC funds did not reflect the true catchment population, workload and level of activity. A new formula for allocation is proposed, that uses the catchment population (instead of the population of political entities), workload, level of activity and the distance of the HU from the HSD headquarters. Intorduction Health needs all over the world are greater than the available resources. Therefore, managers of health services are faced with the challenge of making equitable resource allocation for service delivery. To be able to achieve this, the size of the catchment population served by a health unit is one of the factors that need to be known in order to equitably determine the resources required to provide health care. Population size is an important determinant of the demand for health services, and hence the demand for resources in form of personnel, health goods and commodities necessary to provide the services. In the process of allocation of health care funds, the Ugandan Ministry of Health uses a number of criteria like population size, distance from the city, the state of the roads from the city to the recipient district, the level of development of the district, the number of hospitals in the district etc. The use of these allocation criteria has over the last five years resulted into progressive increase in the funds allocated to marginalized areas and, thus, has been a welcome step in the right direction to address the question of equity in health in Uganda. Remote areas now get reasonably more funds than urban and central districts. However, the criteria still need to be refined in order to address the problem of equity even more, and more especially within the district. There are local intra-district factors which should influence the allocation of funds within the district but which are not taken care of by the allocation working party at the central ministry headquarters. Such factors include the distribution of the population and crossborder movements. Padyere Health Sub-District (HSD) is one area affected by the insensitivity of the centrally-determined allocation criteria. It is one of the three HSDs in Nebbi District, in the West Nile region of Uganda. It comprises six sub-counties and one Town Council, having, in total, 36 parishes with 391 villages (Nebbi District Planning Office Database, 2003). Apart from hosting the district headquarters, it borders Vurra/ Upper Madi HSD of Arua District to the north, Junam HSD to the east, Okoro HSD to the west, and forms part of the national border with the Democratic Republic of the Congo (DRC) to the south. The HSD has 20 health units, of which 4 are private-not-for-profit (PNFP) and 16 belong to the government. Two of the health units are hospitals, and the rest are health centres of either level II (9) or III (9), with none at level IV. Ten of these twenty health units are close to the district's borders with either the DRC or Arua district. However, within either Arua District or the DRC, there are very few functional health facilities within 10 km to the border with Padyere HSD. In the DRC, the nearest functional units of Mahagi, Logo and Nyarambe are all located over 10 km from the border and, in Arua District, the nearest units of Anyiribu, Ofakka and Okollo HC are all also over 10km from the HSD border. As a result, many of the people from these neighboring areas and other HSDs of Nebbi District get their health services from Padyere HSD, just as well as a few from Padyere find their way to neighbouring HSD. Though recognised at HSD level, the magnitude of this cross border flow has been difficult to quantify. It has always, therefore, been difficult to justify requests for a higher budget for the HSD on this basis. It has been hard to convince district authorities about this fact without hard evidence. Apart from casual cross-border entrants who come for care and go back, there are also some refugees and internally displaced people (IDPs) staying within the HSD, fleeing the armed conflicts in the DRC and the neighbouring and insecure Gulu District. All these have not been captured in the catchment population of the HSD. Like everybody else, the displaced and refugees need and are entitled to health care. Moreover, their health needs may be more than those of the indigenous population because of the environmental changes, and the poor conditions under which they sometimes live, in addition to the physical and/or mental trauma faced before or during their flight. The presence of these displaced people and refugees therefore does not only alter the catchment population of the health facilities of the areas in which they settle, but also causes competition for the available health services with the indigenous population (MSF, 1997 a). This is important where estimates for resource allocation are based on population figures. Therefore, lack of information on the catchment populations makes equitable planning and, resource allocation for health service delivery difficult. In reality, the true catchment population of a health unit is influenced by factors such as geographical barriers, the quality of care, the range of services offered by the health units, among others. It is usually made up of more than the population within the officially recognised political boundaries of the area served. In Uganda, as a way to further strengthen decentralisation, the government will soon more power over resource allocation to the districts under the so-called Fiscal Decentralisation Strategy (FDS). Currently, funds for health care are released to the districts as a conditional grant that must be used for health care activities, the Primary Health Care Non-Wage Conditional Grant (Delegated Funds). The district only serves as a channel to direct them to the functions pre-determined by the central level. It may only add more funds if new needs arise or the budget is insufficient. However, under the FDS, the district will have the power to reallocate the funds obtained from the central level for district activities. The health sector will compete with other sectors for a share of the same block of funds. It is important therefore that the health sector prepares itself adequately with the necessary negotiation skills and should be able to demonstrate their need for adequate resources. Knowledge of the catchment population is one such crucial data necessary to negotiate for an appropriate level of funding for a HSD under the FDS. Other crucial factors will include the workload, the range of services offered, and should take into consideration the presence of displaced people, refugees and cross border flows. This study was meant to generate information that, if used, could help the district improve the intra-district allocation criteria for PHC Non-Wage Conditional Grant funds. After the FDS, it could also help in the allocation of the now non-conditional grants. The study restricted itself to establishing the catchment populations of the lower level health units in Padyere HSD. Its objectives were:
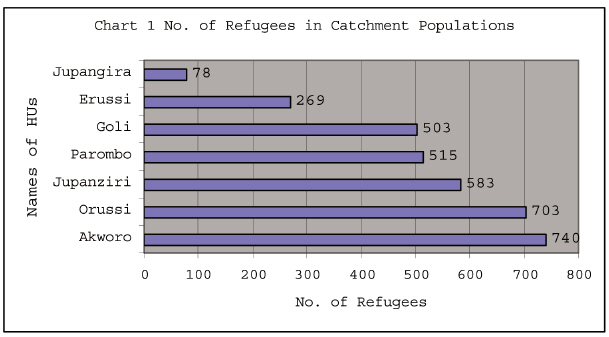
To the best of our knowledge, no study of this nature had been done in rural Uganda and we felt that the study could contribute to the knowledge about the equitable allocation of resources for health. In addition, the findings could be used to monitor the performance of the health units in the HSD. The district could also use the findings to lobby for extra funding from the central level. Finally, we thought this study could serve as an incentive for the district to have the catchment population of all the health units in the district re-determined, so that catchment populations are used for resource allocation instead of the populations of political boundaries. Definitions The Macmillan English Dictionary (Macmillan, 2002) defines catchment area as "the area for which a school or hospital provides a service". Others define it as the "region from which the clients of a particular health facility are drawn", and add that "… such a region may be well or ill defined" (Last, 2001). The popula-tion of such an area or region will then be considered as the catchment population of the school, hospital or other health facility. These definitions bring out the importance of the knowledge of catchment populations in effective planning for and management of health services, including resource allocation. However this information is not always available. The Uganda Ministry of Health also acknowledges that the most important factor determining health care needs, and costs is the size of the population (MOH, 2003). However, even at the ministry, we could not find a document detailing the catchment areas and populations for the different health units in Uganda. The ministry's Guidelines for Health Sub-District Planning (MoH, 2004) define the roles of the HSD headquarters, which among others includes assisting the HCs II and III in planning, including defining their catchment populations. For health units under the Catholic Church, the Policy for Catholic Health Services in Uganda states that, each health unit accredited to it should have a well defined catchment area and population (UCMB, 1999). The target of the first Health Sector Strategic Plan (HSSP I) was to have a health centre in each and every parish (MOH, 1999). In Nebbi district, while this target has not been achieved yet, it is assumed that each health unit is responsible for preventive health care services in the administra-tive parish in which it is located. Those parishes without health units are then covered by the HSD referral facility, or assigned to another LLHU depending on proximity or the wish of the community after discussing with the community leaders. The HSSP I quotes the Uganda Health Facilities Inventory (MOH, 2000a) to say that only 42.7% of the 4,517 parishes in Uganda had any health unit in the year 2000 (MOH, 2000 b). In Padyere HSD, only 17 (47%) of the 36 parishes had a health unit in FY 2002/ 2003. Two of these health units were hospitals. Two parishes had two health centers each and two entire sub-counties with an average of 5 parishes had one health center each. Phillip, (1990) outlines two simple models of determining catchment areas of health facilities. One of the models suggests the catchment area of a health facility can be estimated by imagining a circle with a radius of eight kilometers and the centre at the health unit. On a map, this could be drawn to scale. A radius of eight kilometers is suggested on the assumption that in developing countries, this is a manageable walking distance for patients to seek health care. However, this model does not take into consideration the local circumstances such as physical barriers like terrain, presence of rivers, swamps and bridges. The second model of Phillip suggests a simple allocation of the entire villages around health facilities as their catchment areas. However, even this does not guarantee that the population will use the facility. Utilisation of a health facility depends on many factors, including the perceived quality of the care offered. If the care is perceived to be of poor quality, even the immediate neighbours of the health unit will not seek it. This is the method commonly used in assigning areas for preventive services, including in Nebbi District. However, it assumes that all the members of a village use the services at the unit, yet distance may be a barrier for people at the end of a village, far from their village health unit. Amonoo-Lartson, (1996), suggests another method of determination of catchment area and population that involves mapping the village of origin of either samples or all health unit attendees. Then the villages are arranged in descending order of frequency of their contribution to the attendance at that facility. To establish the catchment area, a kind of Pareto analysis is done to determine the villages that contribute the highest 80% frequency. The total of their entire population is then considered to be the catchment population of the health unit. Alternatively, any village that contributes at least 5% of the population attending the health unit is considered to form part of the catchment population of the health unit. This latter method seems to be better than the first two because it shows the real location of those attending any health facility. However, it too does not take into considera-tion the population densities of the different villages and the reasons why some health units are bypassed. Cross-border flow is an important factor in resource allocation in a decentralized health service delivery system. This is because, people coming from outside the catchment area of a health unit or HSD will compete for resources originally meant for the indigenous population, unless this was provided for in the allocations. Other factors that determine the cost of service delivery include the health needs of the specified population, differential costs of providing different services, differential costs in different areas and costs associated with non-service delivery such as teaching costs (Green, 1999 a; Witter, 2000). The Maryland [USA] Health Care Access and Costs Commission, in its report on health service utilization by the residents of the state reported that cross-border utilization is influenced by proximity to places of residence and work, and demand and supply factors. Its proximity to Washington DC meant that many of its residents worked in Washington DC and had easy access to the health services in that state. Some of those services were also not easily available within Maryland (MHCACC, 1999). Residents of Arua District, D. R. Congo and the neighboring HSDs who are closer to the health units in Padyere HSD than to those in their own HSD, district or country would therefore use the nearest service even if it is in Padyere HSD. The Mt. Currie health district of Kwa-Zulu Natal province (South Africa) was reported to have a lot of its services used by people from the neighboring Eastern Cape Province as it had better facilities (Valentine, 1999). Wherever there is conflict and services have been disrupted as is the case in D. R. Congo and Southern Sudan, the population from such areas will seek services from wherever they can find them. In planning for health services in conflict areas and their neighbourhood, the presence of refugees and other displaced people needs to be kept in mind. Refugees from Mozambique were reported to have placed significant burden on the existing health infrastructure in Malawi, calling for international intervention (Phillip, 1990). The situation in Nebbi district may not be very different from that. In May 2003, the number of refugees in Nebbi district was estimated to be about 15,000 (Orach, 2003; Gamba, 2003). Their presence therefore stretches the resources originally planed for the local population. In May 2003, there were about 5,000 refugees from Congo in Zeu sub-county of the neighbouring Okoro County. The local health units run out of stock of nearly all drugs (Gamba, 2003). Though drug stock-outs are a common occurrence in Uganda, this was an exceptional situation as the other health units in another neighbouring HSD, Okoro, were not equally affected. It has been observed that delivering a sustainable health service is a fine balance between the needs of the community and the health resources available. That means it is very important to allocate the resources available in such away that the health needs of the community are met (Engelbrecht, 2000). In the case of Nebbi District, this means catering for the local, displaced and refugee populations. Resource allocation methods: The South African Guidelines for District Health Planning and Reporting- Part D: Planning Tools mentions three methods of resource allocation (South Africa MOH, 2003):
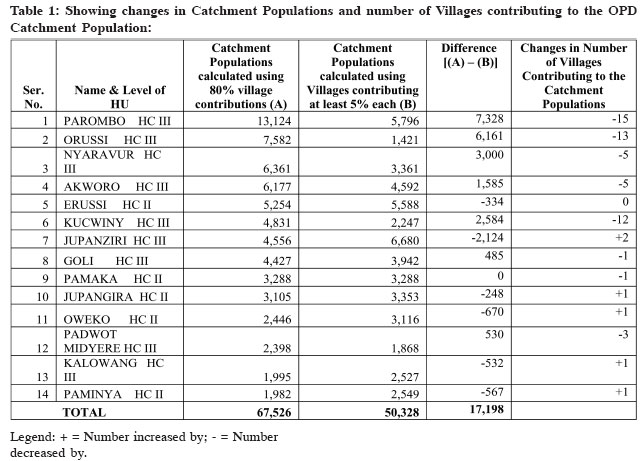
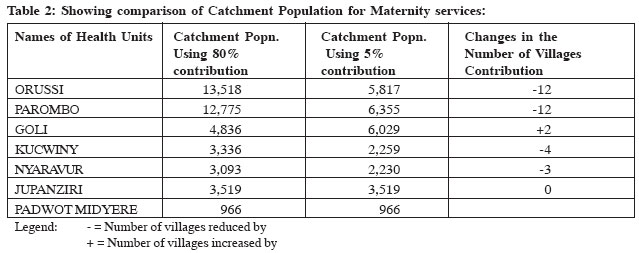
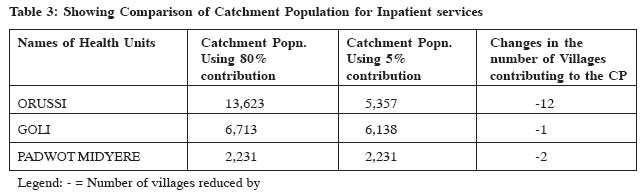
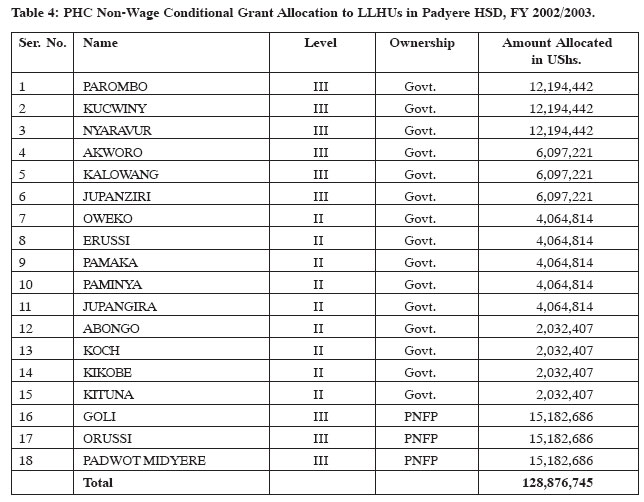
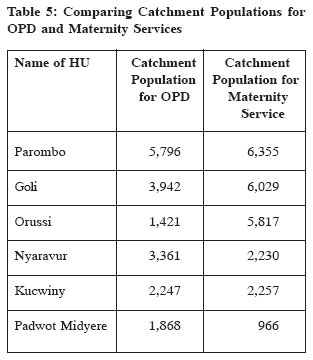
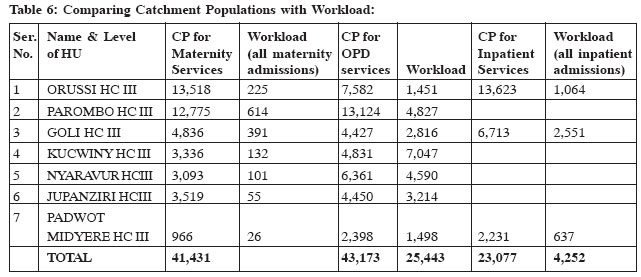
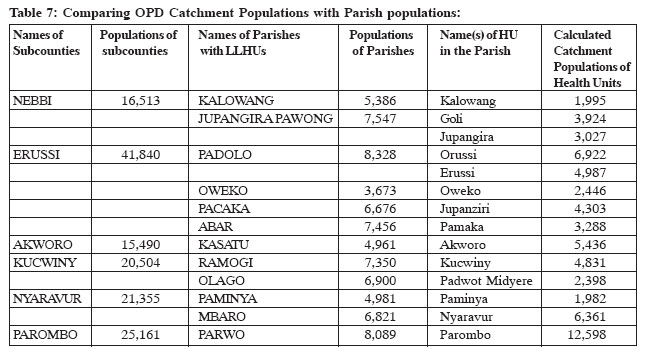
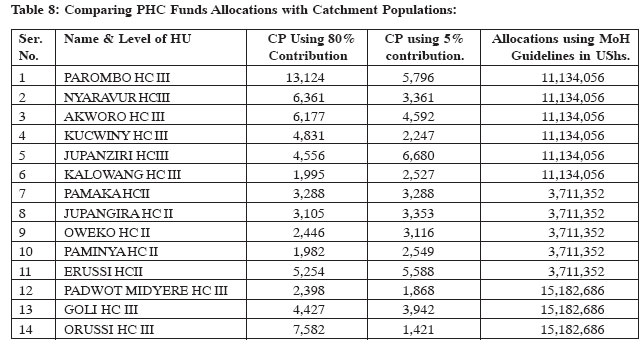
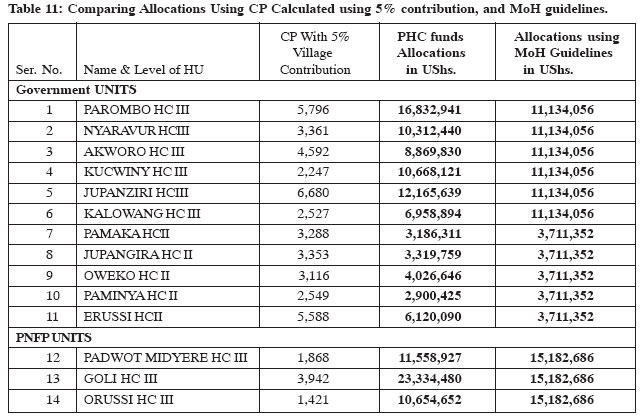
However, the distribution of facilities and resources is usually determined using a formula based approach. Until now, the allocation of funds to LLHUs in Uganda was mainly historical in nature. The main criterion used to make the allocations was the hierarchical level of the health unit within the health system. This study contends that the results of the allocation were not equitable, and suggests that the population-based formula approach be used instead, in a bid to increasing equity. It is hoped that this will set a background for even more equitable resource allocation after the introduction of the FDS. Population size and other factors affecting the cost of services would be reviewed regularly to determine their relevance in deciding upon the amounts to be allocated to each health unit. In Uganda's case, the Service Platform Approach is not applicable because there was no initial central planning of the distribution of health facilities. It requires a rationally distributed system which is not the case in Uganda. The formula currently used by the MOH for the allocation of Delegated Funds is based on five categories of factors. These are the population size and its inflators, the poverty level in the district, special health needs in the district, the district coverage with hospitals and the presence of health projects in the district. Each of these criteria is weighted and allocated a score. The final score obtained by the district is then applied to the total PHC budget granted by the Ministry of Finance, Planning and Economic Development. The score is obtained as follows: Weighted population = 2002 census population * Average (i) *Average (ii) * Average (iii) * Average (iv) * Average (v) Where: Average (i) is the average score for the poverty level for the district Average (ii) is the average score for population inflators like presence of refugees and internally displaced people; Average (iii) is the average score for special health needs (diseases like sleeping sickness, cholera, plague, malaria epidemics; and varying cost drivers of service delivery such as topography, infrastructure, islands, access to national grid electricity etc); Average (iv) is the coverage of hospital services. Districts with several hospitals have their scores deflated by this factor; and Average (v) covers for presence of project funding which deflates the score if it is implementing activities in line with the HSSP framework. After performing the above calculations, needy districts tend to have weighted populations greater than their census populations, and the reverse is true for richer, less needy districts (MOH, 2003). However, it is not possible to adopt the MoH allocation formula for the allocation of funds to individual health units. This is because the parameters used are not easily applicable to that level. Data on poverty levels and special needs are not available up to sub-county, parish and village level; the morbidity pattern is assumed to be the same throughout the HSD; project funding does not exist at individual HU level (except for some few PNFP units). Therefore, the only option available for lower level units seems to be population-based, keeping in mind that there is no ideal formula for resource allocation suitable for all circumstances for all the time. All formulae have to be improved with time. In its simplest form, the catchment population is used to allocate resources without considering any other factor besides it (Green, 1999). In Brazil, resource allocation to Municipal Health Systems was restruc-tured several times between 1999 and 2003 as a result of the poor performance of the previous formula, which left a lot of room for lobbying and negotiations (Melesse, et al., 2003). In South Africa, the regular District Health Expenditure Review (DHER) is aimed at empowering health managers to improve services and financial planning, and strengthen management support systems (Engelbrecht, 2000). This is to keep up-to-date with the changes in health expenditure, and the changing health needs of the population. In Uganda, the formula for allocation of Delegated Funds has also been changing every year in an attempt to attain equity, and address effectiveness and efficiency. Methodology We did a descriptive, cross sectional study, covering the 14 functional lower level health units in Padyere HSD during FY 2002/2003, the 6 Sub counties and one town council that make up Padyere HSD. We excluded the 2 hospitals in the HSD for lack of adequate time and funds for the study, which was part of a dissertation project for a Masters degree at Uganda Martyrs University. The patients who attended the lower level health units for OPD, in-patient and maternity services in the FY 2002/2003 constituted the study units. Due to the large amount of data to be analyzed about the OPD attendance, multi-stage sampling of the data was done to get four months in the year. Data of four months were considered manageable in the given time and financial framework and yet representative enough of the seasonal variations in utilisation. The financial year was divided into four cluster quarters i.e. July to September 2002, October to December 2002, January to March 2003 and April to June 2003. Then, one month (July 2002) was picked randomly from the first quarter to be the starting month. Thereafter, all the attendances of every third month constituted a sample. Therefore, the sample was made of data for the months of July 2002, October 2002, January 2003 and April 2003. For the in-patient attendance and maternity services, all patients who were admitted in the FY 2002/2003 were analysed. Using a village tally sheet, the data were collected through review of out-patient, inpatient and maternity attendance records, specifically to look for the villages and parishes of origin of the patients. To obtain information about the numbers of refugees from D. R. Congo, registers from the sub-counties, Resident District Commissioner's office, Uganda Red Cross- Nebbi, World Vision- Panyimur were studied. We studied the HSD work plan and budget for FY 2002/2003 to find out the amounts allocated to the entire HSD, and the lower level health units for the FY 2002/2003. The data were processed and analyzed manually, and by use of MS Excel computer program. The attendance plotting method as described by Amonoo- Lartson, et al. (1996) as described above was used. For comparison, the catchment population was then calculated using villages that contribute at least 5% to the attendance of the health unit. The 2002 census populations of these villages were deemed to constitute the catchment population of the health unit. Where a village appeared in the utilisation of two or more health units, its census population (and that of refugees where they exist) was shared among the affected health units according to the proportion attending each. For the HCs III, three sets of catchment populations were determined; one for the OPD attendance, another for their inpatient admissions and finally one for maternity services where all these services are provided. The cross border component included all patients coming from outside the HSD. Results and Analysis: For outpatient services, the majority (92.4%) of the patients came from within the HSD, and only 7.6% came from outside the HSD. For maternity service utilization, 71.6% of the mothers came from within the HSD, and 28.4% came from outside the HSD. Of the mothers who came from outside the HSD to attend maternity services, the majority (59.4%) came from D. R. Congo followed by 29.7% from Okoro HSD. Most of these (48.2%) attended Goli HC, followed by 40.0% at Parombo HC. For the inpatient services, 62.3% of the patients came from within the HSD, and 37.7% from outside. Of those coming from outside the HSD, the majority (79.2%) came from Okoro HSD and 18.1% from D.R. Congo. Most of these (95.8%) attended Goli HC. No records of internally displaced people existed in the HSD. However, there were some records about refugees. The catchment of Akworo HC had the highest population of refugees. The other health units had the following: Catchment Populations of the Lower Level Health Units. We studied the catchment populations of the health units using the two methods suggested by Amonoo-Lartson et al. The results were to a large extent different, depending on the method used. Among the government health units, some HCs II had higher catchment populations than some HCs III like Kalowang. Changing the criteria led to a change in the catchment population of all health units except Padwot Midyere and Jupanziri HCs. Orussi and Parombo, had the largest reductions from 13,518 to 5,817, and 12,775 to 6,355 respectively. Both HUs had the number of villages contributing to their catchment population reduced by 12. Goli HC got an increase from 4,836 to 6,029, with the number of villages contributing to the CP increasing by two. Catchment Populations for Maternity Services The table below shows the catchment population of LLHUs for maternity services 4.2.3 Catchment Population for Inpatient Services:Next page is a table comparing the catchment populations of the LLHUs for inpatient services. The catchment population for Padwot Midyere HC III remained the same, but that of Goli HC reduced by 575 after losing one village as a result of the adjustment. Orussi HC had the number of villages contributing to its catchment population reduced by 12, leading to a catchment population drop from 13,623 to 5,357. 4.3 PHC Non-Wage Conditional Grant Allocations to Lower Level Health Units in Padyere HSD for FY 2002/2003. Having expected that the new HC II and the upgraded HCII would be operational by the middle of the FY 2002/2003, allocations were made for the PHC Non-Wage Conditional Grant for FY 2002/2003 following the guidelines from the MoH, which indicated that the allocation should be done basing on the level of the health unit i.e. a ratio of 3:1 for HC III : HC II. Lower level government health units received UShs 85,361,096, and the Lower level PNFP health units received UShs 45,548,058. Akworo, Kalowang and Jupanziri were upgraded with the intention that they would be fully operational HCs III by the middle of FY 2002/2003. That explains why their allocation is between that of HCs III and HCs II. Koch, Abongo, Kituna and Kikobe were new HC IIs expected to open by the middle of FY 2002/2003, such that they would be operational for only half the financial year, hence half the budget. The PNFP health units- Orussi HC III, Goli HC III and Padwot Midyere HC III received the same amounts by virtue of being at the same level. However we have seen that their catchment populations were completely different. For all services, Padwot lagged far behind the other two PNFP units. 5.1 Discussion of Results:Origin of the patient Although there were inaccuracies in the data, the results showed that there were three broad categories of patients: the indigenous population from within the HSD, refugees, and those from outside the HSD. The majority of the patients- 92.39% for OPD attendance, 71.63% for maternity services and 62.32% for inpatient services- came from within the HSD. However, a larger proportion of those attending maternity and inpatient services came from outside compared to outpatient services. Possible explanations could be the bigger catchment area or that fewer patients from within the HSD were using these services. However, the effect of cross-border movements cannot be ignored and much as the MoH has included cross-border utilization in its allocation formula of PHC Non-Wage Conditional Grant to the districts, Nebbi district could justify a demand for a fairer share by using the results of this study. The results show that the catchment populations for OPD services varied a lot from one health unit to another (1,995 to 13,124), and between health units of the same level (1,995 to 13,124 for HCs III, and 1,982 to 5,254 for HCs II). If we are to take the size of the population as the main determinant of health needs as stated by the MoH, then it means the MoH allocation guidelines have not resulted into equitable allocation of resources at the lower unit level. This is a situation that needs to be corrected. The findings from this study could give us a more accurate picture of the sizes of the populations being served by these health units. The catchment populations for maternity services also showed a wide range from 966 for Padwot Midyere HC to 13,518 for Orussi HC; and for inpatient services from 2,741 for Padwot Midyere HC to 13,623 for Orussi HC. In theory, the catchment area of a health unit for OPD services, and therefore its catchment population for that service is supposed to be smaller than the catchment area and therefore catchment population for its referral functions- such as maternity admissions and inpatient services. This is meant to reflect the effectiveness of the referral system. As the referral functions are offered at fewer facilities, the population using them is supposed to be greater. As shown in the Table 9 below, for Goli HC, Orussi HC and Parombo HC, catchment populations for OPD services were lower than catchment populations for maternity services. Table 6 next page compares workload with catchment populations for the various services. What comes out clearly is that the health unit with the highest catchment population is not necessarily the one with the highest workload. It is therefore necessary to use both factors in resource allocation to get a more equitable allocation to the health units. Using new cases as a measure of workload is good for the calculation of per capita utilization of the OPD. However, the actual workload for any HU includes OPD new cases and re-attendances, inpatient admissions and readmissions, and attendances for other services like immunizations. It shows that catchment population is not necessarily proportional to workload. Some health units with big workloads such as OPD for Kucwiny had small catchment populations, and some units with small workloads like Jupanziri maternity had bigger catchment populations. This brings out the need to include both parameters when thinking of resource allocation. In theory, each parish is supposed to have a health unit. Health Centers II are supposed to provide primary services for the parish they are located in, and provide services for a parish population of about 5,000 people. And HCs III are to cover subcounties with populations of approximately 20,000 in addition to providing primary services for the parish in which they are located. And HCs IV are to serve counties/ constituencies that have populations of about 100,000 people (MOH, 2000b). In practice this is not the case because many parishes do not have health units yet. In Padyere HSD, only 14 of the 36 parishes had a health facility in FY 2002/ 2003, and two parishes had two health units each (see table 11). One would therefore expect that the few health units cater for more patients than originally planned. Akworo and Parombo HCs seem to have catchment populations greater than their parish populations, but they were the only health units in whole subcounties of Akworo and Parombo with populations of 15,490 and 25,161 respectively. So, one would expect them to attend to more patients than they have. It may just mean that many people do not have access to health services for one reason or another. Geographical access may be a problem in that there is just not enough health units close enough to people for them to attend. The HSSP (MOH, 2000b) puts "reasonable access" as living within 5 kms of a health facility. However this may not explain the whole story. We have seen that, seven of the 14 health units (Goli, Paminya, Pamaka, Oweko, Jupangira, Jupanziri and Kalowang HCs) had their catchment populations made up of villages within the parish in which they are located, and the population living within about 5 kms of the health units; yet their catchment populations and workloads are less than the populations of the parishes. This could mean that there are some factors other than proximity that are influencing utilization of the services. 5.1.1 Influence of Refugees on health services:There is no indication as to when the problems in the D. R. Congo that led to the flight of the population could end. The refugees in Nebbi are not in camps, and it could be more difficult to move them to refuge camps in the future. However, they would continue to have health needs that have to be met. Literature shows that United Nations High Commissioner for Refugees (UNHCR) has provided for self settled refugees in other places such as in Guinea between 1990 and 1996. On the other hand, health unit registers indicate that refugees from camps in Arua district in Madi Okollo are using services from Nebbi Hospital and the newly opened health unit at Kikobe. The main challenge remains in keeping track of the numbers of refugees, so that they can be used for planning. This will need a lot of vigilance and cooperation from the LCs, especially as the situation keeps changing on the D. R. Congo side of the border and the refugees keep coming and going. 5.1.2 Comparing the PHC Allocations for FY 2002/ 2003 with the Catchment Population that has been determined. The PHC Non-Wage Conditional Grant Allocations to the HSDs and health units need to be improved. The results from this study show that the allocations based on MoH guidelines were not equitable since neither catchment population nor workload was used to determine the amounts each health unit was to get. With the FDS coming into effect, the district could take the initiative to improve the allocations using evidence-based decisions which we hope this study could contribute to. The main factors of catchment population, workload and level of activity as determined by the range of services offered reflects the real need for resources to offer the services. The table below compares PHC Non-Wage Conditional Grant allocations using three parameters: the MoH Guidelines as used in FY 2002/2003; allocations using the population of the villages that contribute the 80% of the utilisation and; the population of the villages contributing at least 5% of the population using the health facility. The figures for villages contributing at least 5% each to the catchment populations could be more realistic because they remove the inconsistency of having very high catchment populations as a result of having many villages that contribute only small percentages to the catchment populations of health units. The effect of this was seen on the catchment populations of Orussi HC and Parombo HC for both OPD and maternity services which dropped drastically with the use of the 5% contribution. It could be argued that using the catchment population as the main factor in a formula for resource allocation may help maintain the status quo. Those with small populations gets less, and those with bigger populations getting more. However, it is up to the allocating authority to ensure that the ground is level for all by ensuring that all other resources are allocated equitably, and the standard requirements for all levels are met in terms of personnel, and range of services offered. Even then, it is unlikely that the performance of the HUs will be the same so that they will deserve the same amounts of funds. 5.2 Conclusions:We therefore make the following two conclusions from this study:
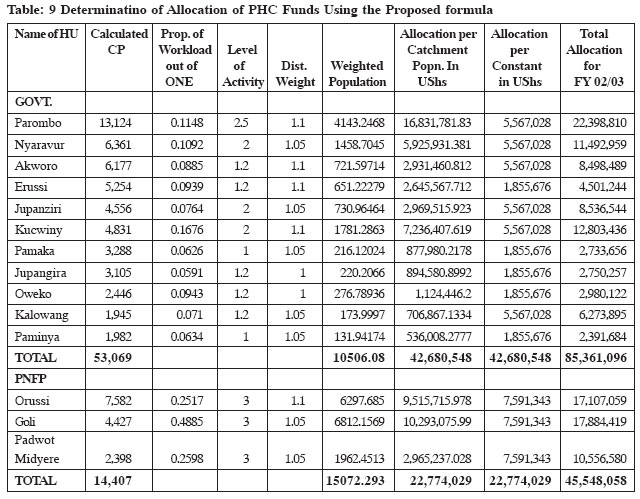
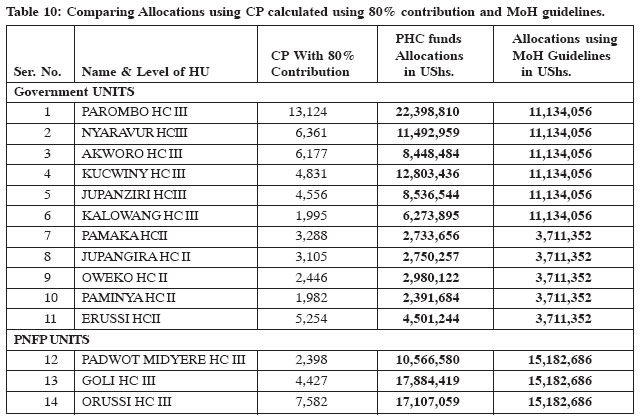
We make the following recommendations based on the conclusions we have drawn above: 1-The district and the Ministry could consider using the true catchment population as a basis for resource allocation of resources to the lower level health units so as to ensure equity in the allocations. 2-The district could justify its demand for a fairer share of the allocated funds by getting a more complete picture of the district through a catchment population study of the whole district. 3-The allocations could take into consideration the range of services being offered by the health units as these determine the cost of service delivery. 4-Regular update of the refugee populations would be necessary. This information could be made available to the health department during the planning period for incorporation into the allocation formula. 5-Finally, we would like to propose and recommend an allocation formula for the PHC Non-Wage Conditional Grant, which contains components of the recommendations made above. This could serve as a basis for further consultation and discussion. It could also be improved upon to get a formula that is flexible enough to accommodate changes in the various factors that affect the cost of service delivery. The main components of the formula would be: i. The Catchment Population of the Health Unit, ii. Workload iii. Level of activity as determined by the range of services offered by the Health Unit. iv. Distance from the HSD headquarters We would therefore like to propose a formula based on the catchment population as follows: POPULATION (Pw) = Catchment Population (Pc)* Workload (W)* Level of Health Unit (L)* Distance from HSD Headquarters (D) thus {Pw = Pc*W*L*D} where W= Proportion of New OPD cases in the whole HSD in the past year seen in the Health Unit, D= Distance of the unit from the HSD headquarters in Kilometres. We propose to weigh the distance on a scale of 1 to 1.1, where 1 is equal to no additional funding, and 1.1 is equal to 10% of the total allocation to the health unit. We would recommend that for the beginning, we take 50% of the allocation and distribute it based on the old MoH guideline of the ratio of 3:1. This could be phased out as the quality of data improves and the formula is developed further. Table 9 demonstrates the calculation of the allocations using the proposed formula. Column three, the proportion of workload could be calculated out of ten instead of one. However the figure ultimately used for the allocations is the Weighted Population in column six, taken as a proportion of total for the category (government or PNFP). Column seven is the allocation of 50% of the grant using the catchment populations, and column eight is the allocation of 50% of the grant using the MoH guidelines. Tables 10 and 11 above compare the PHC funds allocations using catchment populations determined using villages contributing the highest 80%, and 5% each with the MoH guidelines. We would recommend that, for determination of catchment areas and populations, the method of using villages that contribute at least 5% each to the catchment population be adopted, instead of using the villages that contribute 80% after arranging all the villages in the order of magnitude of their contributions. We would recommend that data collection is done as close to the time of budgeting and allocations as possible to make the data that is used as realistic as possible. Finally, regular updating of catchment populations could be necessary as new HUs are put up and old ones upgraded. References:
Copyright 2005 - Department of Health Sciences of Uganda Martyrs University The following images related to this document are available:Photo images[hp05021t7.jpg] [hp05021t8.jpg] [hp05021t10.jpg] [hp05021c1.jpg] [hp05021t1.jpg] [hp05021t11.jpg] [hp05021t6.jpg] [hp05021t5.jpg] [hp05021t9.jpg] [hp05021t4.jpg] [hp05021t2.jpg] [hp05021t3.jpg] |
| |||||||||