 |
| About Bioline | All Journals | Testimonials | Membership | News |
|
||||||
|
||||||
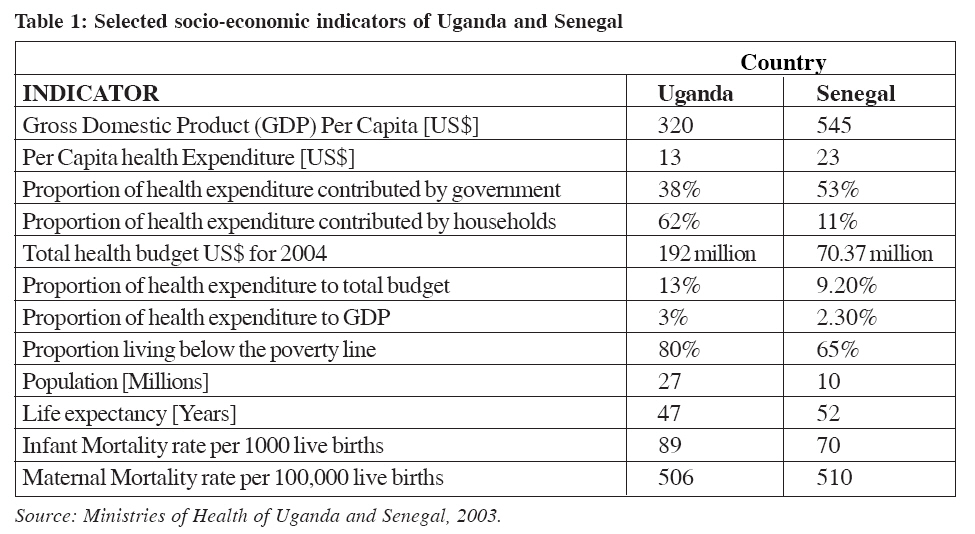
Health Policy and Development Journal, Vol. 3, No. 2, August, 2005, pp. 154-164 PROSPECTS FOR FINANCIAL SUSTAINABILITY OF SCALING UP ANTIRETROVIARAL THERAPY PROGRAMS IN UGANDA AND SENEGAL LENNIE S.B. KYOMUHANGI Private Sector Advisor, PHR-plus, Uganda Abstract Uganda's HIV prevalence is currently estimated at about 6% while that of Senegal is at about 1.5%. Currently, an estimated 1.2 million and 83,000 are living with HIV/AIDS in Uganda and Senegal respectively (UNAIDS 2004). Approximately 33,000 and 2,300 HIV+ patients were on antiretroviral drugs as per estimates of December 2004. Both countries have started scaling up antiretroviral therapy programs hence the need for the current study. The annual and lifetime incremental costs of antiretroviral therapy programs were analyzed using the Cape Town Antiretroviral Costing Model developed by Boulle et al, (2004). Annual average per patient costs increased from US$ 541 in 2004 to US$ 687 by the end of 2008 for Uganda, and US$ 622 to US$ 912 for Senegal. Antiretroviral drugs accounted for the largest proportion of the average per patient costs, accounting for 68% in Uganda and 81% in Senegal. Second line regimens were found to be more expensive than first line regimens thus leading to increasing average per patient antiretroviral therapy costs with the years as the proportion of patients on second line increased from 9% in 2004 to 22% by the end of 2008. The program total costs by the end of 2008 for starting 18,500 patients in Senegal and 82,000 patients in Uganda were estimated at US$ 20.5 million and US$ 68 million respectively. From the study results it has been concluded that the per patient lifetime costs of antiretroviral therapy are influenced by the costs of Antiretroviral drugs, Laboratory tests and service utilization while the total program costs depend on the number of people started on antiretroviral therapy. Introduction HIV/AIDS prevalence rates have continued to rise despite numerous strategies to combat this pandemic. Globally, there are an estimated 39.4 million people living with the Human Immunodeficiency Virus (HIV). About 95% of these are in developing countries of which 70% are in Sub-Saharan Africa (SSA). Acquired Immunodeficiency Syndrome (AIDS) killed about 3.1 million people in 2004 alone and there were an estimated 5 million new HIV infections (UNAIDS, 2004). SSA has an estimated 25.4 million people who are HIV positive. In this region alone, AIDS killed approximately 2.3 million people in 2004 while 3.1 million were newly infected with HIV (UNAIDS, 2004). The era of Antiretroviral therapy (ART) has brought hope for the millions of People Living With HIV/AIDS (PLWHAs). In SSA about 4 million people are in need of ART and only about 70,000 (2%) are currently accessing this treatment hence the need for scaling up ART programs in SSA countries. However, this requires the mobilization of financial resources that most SSA countries do not have (Thompson RJ, et al, 1990). With average per capita GDP of US$ 330 and US$545 respectively, Uganda and Senegal are classified as some of the least developed countries, having more than 50% of the people living below the poverty line. However, the two countries are also the only two African countries said to be `success stories' in the control of HIV/AIDS _ Uganda, because it has managed to lower the prevalence rate from 30% to just over 6% and Senegal, because it has managed to contain the spread, having never exceeded a prevalence rate of 2%. Table 1 (below) gives a summary of other socio-economic indicators of the two countries. Problem statement The expected life expectancy of someone who is started on ARVs is 5-7 years (World Health Organization, 2003). Patients on ART should have an uninterrupted drug supply for life so as to avoid developing resistant strains of the HIV virus (UNAIDS, 2002). Uganda and Senegal are one of the poorest countries in the world with an annual per capita health expenditure of US$ 13- 23. The annual per capita cost of providing ARVs is estimated at about US$ 500 with minimal laboratory testing. Currently an estimated 12,450 PLWHAs in Senegal and 100,000 in Uganda are in need of ART although the two countries can only afford to provide them to a few. A key concern is: what are the financial cost implications of scaling up the provision of ARVs in the two countries? This study, which was carried out in both Uganda and Senegal, had the following objectives:
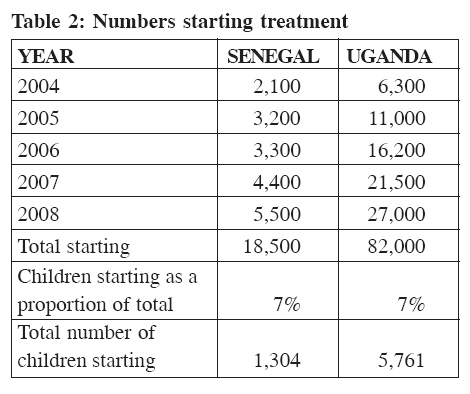
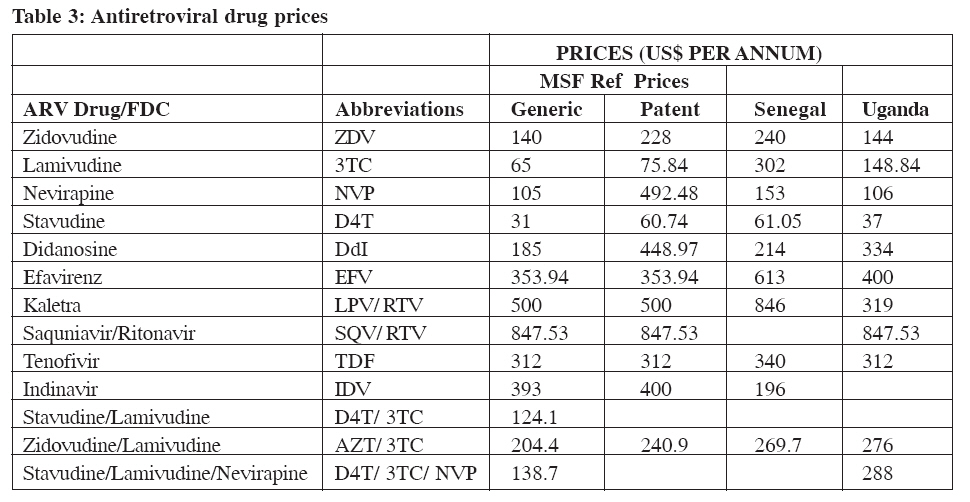
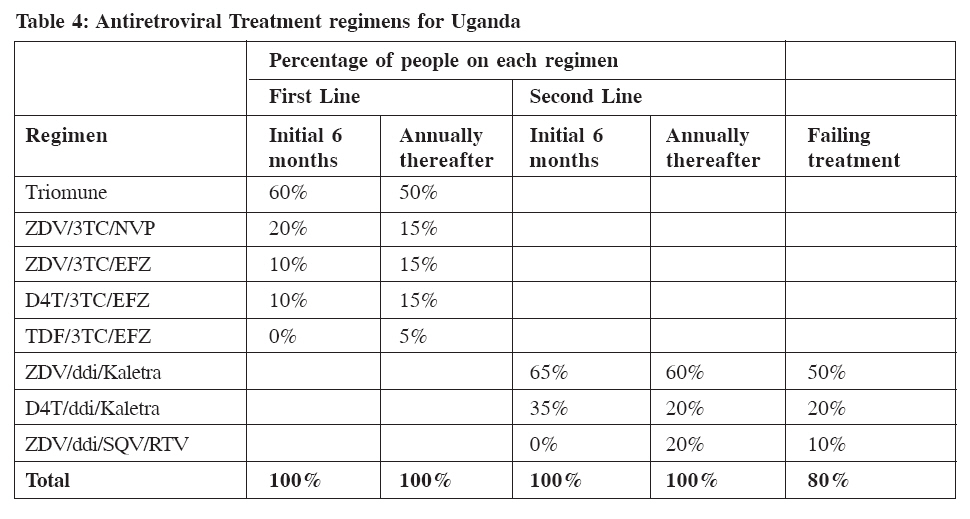
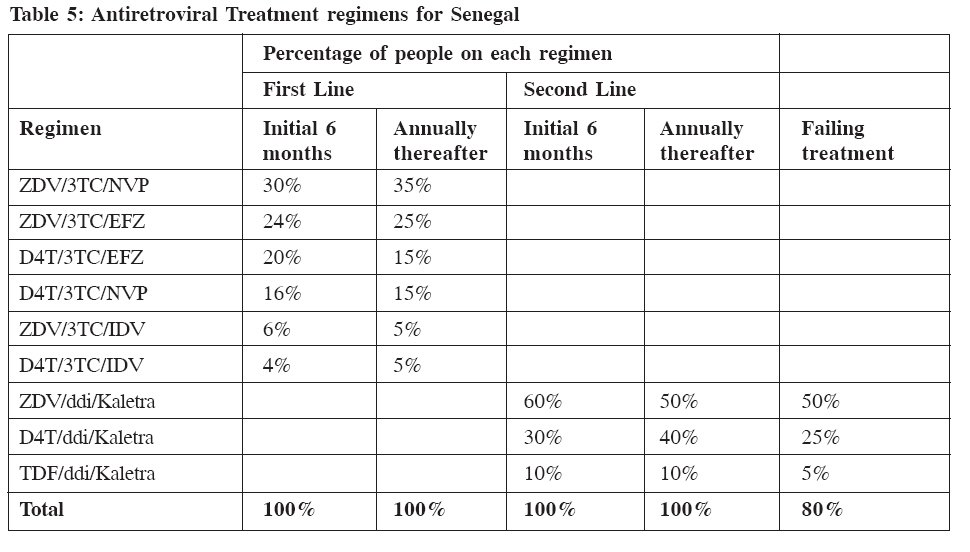
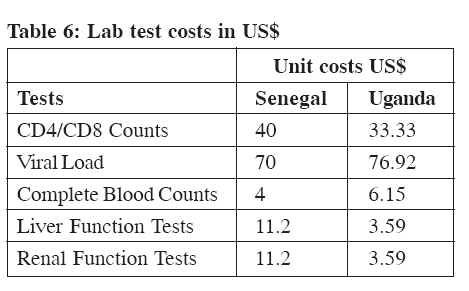
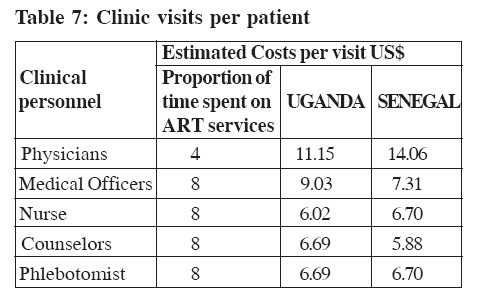
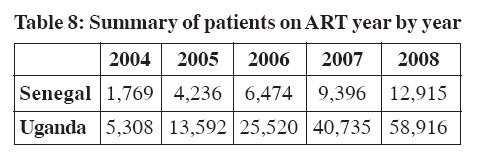
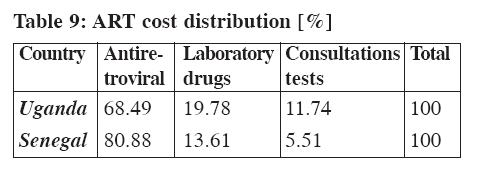
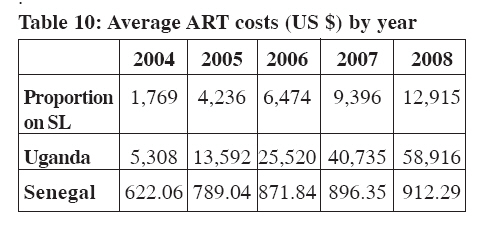
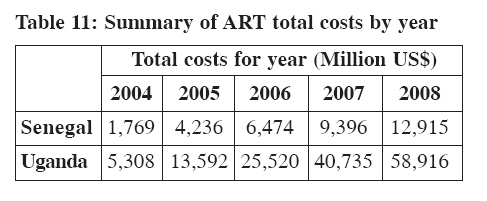
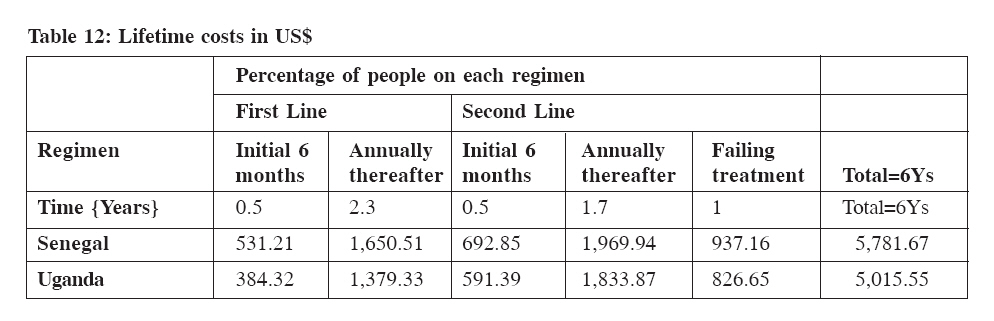
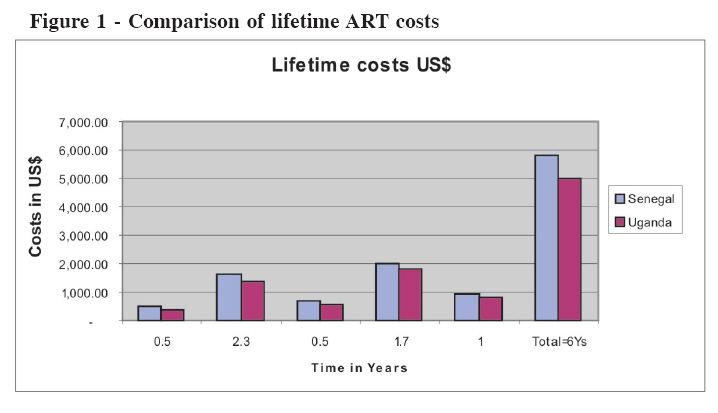
METHODS AND MATERIALS This was a cross sectional study capturing the HIV/AIDS cost data in each country up to December 2004. The costs of scaling up the ART programs in Uganda and Senegal were estimated using the Cape Town (CT) Antiretroviral Costing Model (Boulle A, et al, 2004). Information relating to the scaling up of ART programs was obtained through oral interviews using semi- tructured open-ended questionnaires with key informants carried out in December 2003 -January 2004 in Uganda and August-September 2004 in Senegal. Purposive sampling was used to select the 2 countries. This is because of the fact that they present different HIV/AIDS prevalence levels, which would help give a comparative analysis. Costing approach and assumptions This study focused on the incremental costs associated with scaling up access to ART that would not typically be included in the government's health budget. Therefore, certain costs have been excluded since they would be incurred whether the ART program exists or not. Such Costs included capital costs associated with the construction of buildings since all the three ART programs are run within the existing general outpatient facilities. The treatment of opportunistic infections (OIs) was not included since these are provided as part of the general medical services. Model for estimating costs of scaling up Costs of scaling up ART in Uganda and Senegal have been projected for five years from 2004 to 2008. This is for budgeting purposes and allows planning for the program since most countries plan their health expenditures on a five-year basis. HIV/AIDS disease is also an evolving paradigm and thus one cannot be sure of what will happen further ahead in the future. The estimation of the ART costs using the CT Antiretroviral Costing Model is based on estimating the utilization of health services by patients, the costs of these services and the average time on ART. To do this a number of assumptions are made and are divided into four main components (Boulle A, et al, 2004) as follows: 1: Demographics:– The demographic data help define the potential users of the ART program services The numbers of patients starting ART are based on the estimated number of patients who are in need of ART in each country. Table 2 (below) shows the number of patients that have been assumed to be starting ART each year. 2: Survival assumptions:- The number of patients started on ART who would still be in care at the end of each year and at the end of the implementation were projected by the use of the median survival assumptions inbuilt within the model. They are based on the UNAIDS and WHO estimates that have been estimated at 6 years on ART (Boulle A, et al, 2004).Using these survival assumptions the model helps us to project the numbers remaining on ART, proportions on first and second line regimens and those who would be expected to have clinically progressed due to treatment failure despite being on ART. 3: Clinical protocols:- These include ARV treatment regimens, laboratory test schedules and clinic visits per patient. The ARV treatment regimens and laboratory test schedules that were used are those recommended by each country based on the WHO recommendations. The blood monitoring tests for assessing the toxic reactions of the ARVs are incorporated within the CT Antiretroviral costing model depending on the treatment regimen that the patient is on. It is assumed that the clients would have two scheduled laboratory tests for CD4/CD8 counts and one viral load test per annum. 4: Costs - These represent those for ARVs, laboratory tests, and clinic visits. The ARV costs used are those obtained from recommended prices for each country. These costs will be compared to those negotiated for developing countries in the sensitivity analysis (Médecins Sans Frontières 2003). Table 3 (below) presents the ARV prices used. Antiretroviral drugsInformation on proportions of patients on each ARV and treatment regimens for first line (FL), second line (SL) and failing treatment was obtained from the National Treatment ART guidelines of each country and are given in Table 4 and 5. Treatment regimens for Senegal are slightly different due to the presence of HIV-2 in the country and are presented in Table 5 (below). From Table 4 and 5 (above) treatment regimens are specified for the first six months and annually thereafter for both first and second line regimens. This is based on the assumption that most changes due to toxicity will occur within the first six months of treatment (Boulle A, et al, 2004). It has been assumed that 80% of the patients failing treatment on second line (SL) regimens would be maintained on treatment whereas 20% would be put off treatment (Boulle A, et al, 2004). Laboratory monitoring costs The costs used to feed into the model were those obtained from the National ART treatment guidelines for the two countries and are presented in Table 6 (next page). Clinic visit costs On average, eight visits are recommended during the first six months. Thereafter the patients are seen about 8 times in a year. The clinical visit costs were based on the average remunerations for each category of health worker and the estimated proportion of time spent on ART services. Table 7 (below) shows a summary of the clinic visit costs for each country. Where necessary, the exchange rate that has been used to translate the local currency is as follows: UGS 1,950 to US$ 1 and Senegalese CFA 536 to US$ 1. RESEARCH RESULTS Survival estimates Using the previously mentioned survival assumptions, the total number of patients on ART at the end of each year is shown in Table 8. From Table 8, at the end of each year a proportion of the patients starting ART are projected to die despite being on treatment. Looking at Table 2, 3, 4, 5, 6, 7, 8, by the end of the projected five years 70% [Senegal] and 72% [Uganda] of the patients started on ART would still be alive and in care. Average ART Costs The average ART costs consist of ARVs, laboratory monitoring tests and consultations. Table 9 (below) shows the distribution of these costs From Table 9, ARV drug costs account for the largest proportion of the total ART costs in both countries. Using costs relating to ARVs, Laboratory monitoring tests and service utilization by patients, the average ART costs per patient and proportions on SL regimens are given in Table 10 From Table 10, as the proportion of patients on SL increases with the years, there is an increase in the average per patient ART costs because of the higher costs of SL regimens as compared to FL regimens. From Table 10 (above), Senegal has the highest costs due to the fact that it uses mostly branded ARVs. Using the above numbers for the patients on ART and various costs, the expected total costs for the ART programs in each country are given in Table 11 (below). From Table 11, the total numbers of patients started on ART influence the total ART costs for each year. By the end of the projected five years, Senegal’s total ART costs would be estimated at US$ 20.53 M while those for Uganda would be estimated at US$ 68.55 M. Comparison of Lifetime costs for patients on ART Using median estimates of time spent on FL regimens, SL regimens and failing treatment, lifetime costs for patients on ART in Uganda and Senegal were estimated and are presented in Table 12. From Table 12, ART costs are divided into the initial six months for FL and SL regimens and annually thereafter. This is due to the fact that most toxic reactions are assumed to occur within the first six months on treatment. Thus patients have to be monitored more closely and in some cases treatment regimens changed and this affects the ART costs. Patients have been assumed to stay on ART for about one year after failing to respond to ART (Boulle A, A et al, 2004). A diagrammatic representation of the lifetime costs is presented in Figure 1 The time spent on FL regimens has been assumed to be about 2.8 years, and on SL regimens 2.2 years. Senegal has higher lifetime costs due to the fact ARV prices used are for branded ones that the country currently uses. Sensitivity analysis The results obtained by estimating the costs of scaling up ART led to the conclusion that ARVs and laboratory monitoring tests were the highest cost drivers. The baseline scenario for the ART programs used current prices for ARVs in each country. It was also assumed that there would be no price changes for ARVs and laboratory tests. The ART costs relating to these were varied using different scenarios to find out their effects on the total program and average per patient costs. The following scenarios were considered:
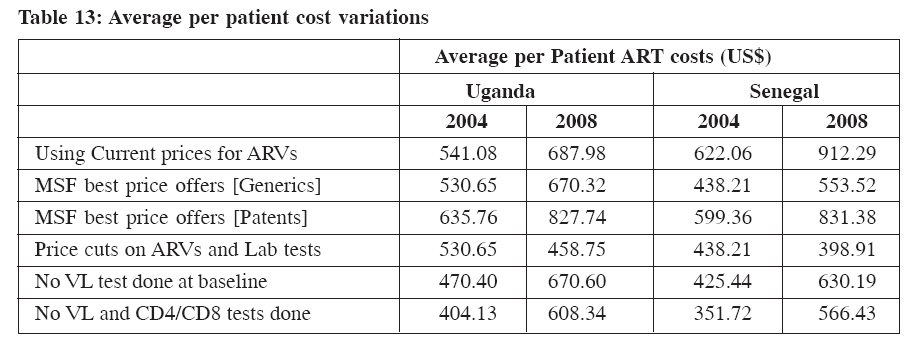
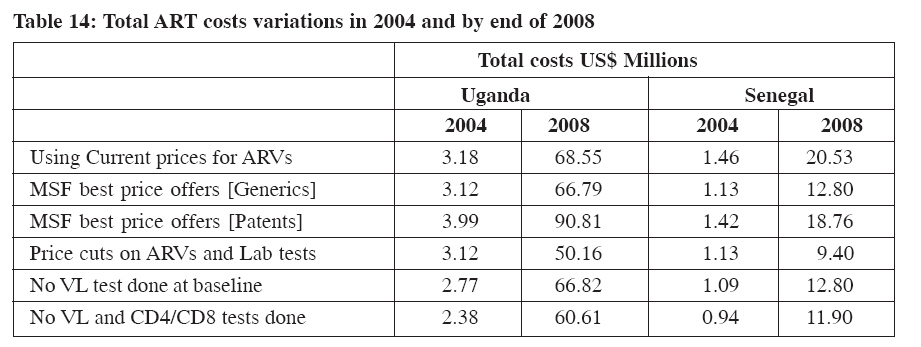
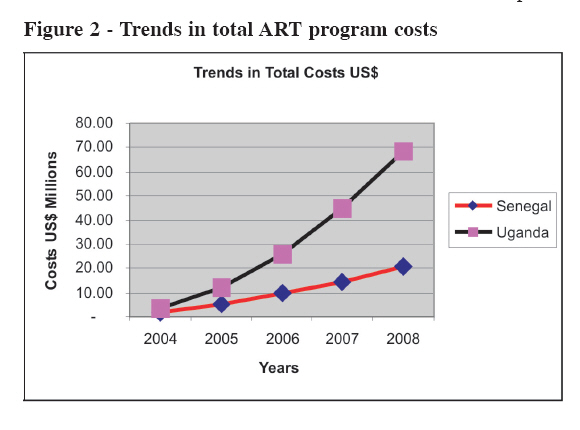
A one-way sensitivity analysis was carried out whereby one item was varied at a time in order to assess its impact on the total and average ART program costs. The main changes were observed in the average per patient annual costs and on the total costs. The changes in the average per patient costs are given in Table 13. From Table 13, the use of patent ARVs drives up the average per patient costs upwards. The use of MSF reference prices gives lower ART costs so the ART task forces should try to access these prices as negotiated for developing countries The main changes in the total costs at the end of each year and after the projected five years are presented in Table 14. From the sensitivity analysis results presented in Table 13 and 14, current retail ARV prices in both countries gave higher costs than the MSF best price offers for generic ARVs. The use of patented ARVs significantly increases both the average per patient ART costs and total ART costs. Even if one viral load test was done as a baseline, not doing any at all still impacts the ART costs by lowering the average per patient and total ART costs. If both CD4/CD8 and viral load tests are excluded, the ART costs are significantly reduced. If anticipated reduction in the prices of ARVs and Laboratory tests are realized then the ART costs will decline in future. DISCUSSION OF RESULTS The provision of ARV drugs is the main concern of any ART program. From the cost analysis ARVs contributed the largest proportion of costs accounting for 68% of the total costs in Uganda and 81% in Senegal. This is consistent with results from other studies done in the recent past. Previous studies using the ATC model, found that ARVs contributed 50% of the total costs in Zambia (Kombe G and Smith O, 2003). In the Mexican study, ARV costs took up more than 75% of the total treatment costs (Sergio, et al, 2003). In Nigeria, ARV costs contributed 50% of the ART costs (Kombe G, et al, 2004). The prices of ARVs are anticipated to decline as a result of current negotiations between the pharmaceutical companies and various international agencies. This was taken into account by carrying out a one-way sensitivity analysis by looking at various price changes. It has been assumed that prices for FL regimens may not change much since they may have reached their lowest levels, while those of SL regimens are expected to reduce a little more (Lucchini, et al, 2003). Taking this into consideration in varying ARVs prices, higher percentage price reductions were considered for SL than for FL regimens and this led to cost reductions on both the average and total ART costs as shown in Table 11, 12, 13, and 14. SL regimens were on average more expensive than FL regimens. The average SL regimen cost ranged between US$ 833 to 884 as compared to US$ 303 to 437 for FL regimens. These are not significantly different from those obtained in a study in South Africa by Boulle A, et al (2003), where the costs of SL were estimated at US$ 865 and FL at US$ 500. Since SL regimens are more expensive than FL, in this study as the proportion of patients on SL regimens increases from 9% in 2004 to 22% in 2008 there was a concomitant increase in the average ART costs with the years as shown in Table 8 above. Laboratory monitoring test costs contribute the second largest costs accounting for 13.6% and 19.8% of the total costs of the ART costs in Senegal and Uganda respectively. Looking at the sensitivity analysis results, if no viral load test were performed there would be a reduction in the average ART costs of about US$ 60, and if both viral load and CD4/CD8 tests were not performed, there were significant reductions in the average per patient by US$ 86.5 to US$ 126 as shown in Table 9, 10, 11 above. In comparison to these results, a study in Zambia reported a reduction in the laboratory tests of about US$ 80 if more basic laboratory tests were used for monitoring patients on ART instead of using viral load and CD4/CD8 tests (Kombe G and Smith O, 2003). Some clinicians in Uganda have argued that patients on ART can be safely monitored clinically and by the use of lymphocyte cell counts in order to lower the costs of ART (Ministry of Health of Uganda, 2003). The number of viral load and CD4 tests performed should be kept at the minimal safest levels or completely stopped so as to reduce the costs of laboratory monitoring tests. The use of other laboratory tests, such as lymphocyte counts, is recommended in order to reduce on the costs of ART services. Lifetime costs are crucial for planning purposes. This study estimates lifetime costs for a patient on ART at US$ 5,781 for Senegal US$ and US$ 5,015 for Uganda. A study in South Africa by Cleary, et al (2003) reported lifetime costs for ART patients of about US$11,071, using the exchange rate of R8.4 to US$ 1. This difference is attributed to the difference in the cost and price structures of the different countries. Costs for ART are projected to increase on an annual basis as coverage increases. This is because patients on ART live longer and thus as more people are brought into the ART program, the costs of ART would grow accordingly (UNAIDS, 2002). Figure 2 shows the projected total ART costs for Uganda and Senegal for the next five years (2004 to 2008). From Figure 2, the total ART costs are projected to increase exponentially to about US$ 20.5 M for Senegal and US$ 68.5 M for Uganda by the end of 2008. The total ART costs are influenced by the numbers started on ART, thus, Uganda with more patients starting ART each year has higher total ART than Senegal. Thus preventive efforts should be maintained so as to reduce those in need of ART, as Senegal has been able to do. CONCLUSION From the study results, ARV prices are of great importance as regards the costs of the ART programs. The national ART task forces should endeavor to negotiate better ARV price offers by the various pharmaceutical manufacturers and take advantage of the MSF best price offers that have been negotiated for developing countries. Countries could consider using generic ARVs that have been certified by the WHO as these give lower ART costs. This may be possible, since most of SSA countries are classified as least developed countries, and not have to implement the Trade Related Intellectual Property Rights (TRIPS) patent protection for pharmaceuticals till 2016 (Shaffer E, 2003). If HIV/AIDS patients are to benefit from the ART program, they need to be supplied with ARVs without interruptions in the treatment for the rest of their lives (Lawrence J, et al, 2003). This study has estimated lifetime costs of ART at US$ 5000 for Uganda and US$ 5,782 for Senegal, assuming a median survival time of 6 years. Thus, in planning for ART costs, governments need to look further than the yearly costs and consider these lifetime costs. REFERENCES
Copyright 2005 - Department of Health Sciences of Uganda Martyrs University The following images related to this document are available:Photo images[hp05023t12.jpg] [hp05023f1.jpg] [hp05023t3.jpg] [hp05023t14.jpg] [hp05023t9.jpg] [hp05023f2.jpg] [hp05023t7.jpg] [hp05023t2.jpg] [hp05023t5.jpg] [hp05023t8.jpg] [hp05023t11.jpg] [hp05023t13.jpg] [hp05023t10.jpg] [hp05023t6.jpg] [hp05023t1.jpg] [hp05023t4.jpg] |
| |||||||||