 |
| About Bioline | All Journals | Testimonials | Membership | News |
|
||||||
|
||||||
Health Policy and Development Journal, Vol. 6, No. 1, April, 2008, pp. 37-53 THEME TWO: HEALTH SERVICES MANAGEMENT Technical Efficiency in the Presence of Desirable and Undesirable Outputs: A Case Study of Selected District Referral Hospitals in Uganda Yawe BL and Kavuma SN, Faculty of Economics and Management, Makerere University, PO Box 7062, Kampala, Uganda. Tel: 256-41-530115/256-752-574651. Fax: 256-41-532355 Email: byawe@yahoo.com or byawe@fema.mak.ac.ug Code Number: hp08006 Abstract The general practice in technical efficiency measurement for health providers has been to ignore additional products of most transformation processes that can be classified as "undesirable outputs" — which are a subset of the output set. Traditional Data Envelopment Analysis (DEA) technique is modified to give a more realistic and comprehensive score of production efficiency considering both, desirable and undesirable outputs. This is applied to a sample of Uganda's district referral hospitals over the 1999-2003 period. The modified DEA credits a hospital for its production of desirable outputs but penalizes it for its production of undesirable outputs (patient deaths). Without the inclusion of these factors, the efficiency evaluation becomes a purely technical measure of the system alone, and does not account for the interaction of the system with the surrounding environment. In addition, there are also technological dependencies arising due to the relationships between the desirable and the undesirable outputs. Key Words: Data Envelopment Analysis; Desirable, Undesirable, Output, Hospital Introduction Not all of the output from any production process might be desirable. Thus, the inclusion of only desirable output might not provide a true picture of the technical efficiency of a decision making unit. Many production processes have a negative side effect, namely the production of undesirable byproducts. A typical example in health is the death of a patient in the course of administering treatment. Traditional production theory does not lend itself to modeling joint production of good and bad outputs. To address this issue, Shephard and Färe (1974), introduce the notion of null-joint production which explicitly allows for the joint production of desirable and undesirable outputs/products. They also introduce the idea that disposal of undesirable outputs may not be `free', which is the standard assumption made in traditional production theory. As an alternative, they propose the notion of `weak' disposability; that is, disposability of some outputs may be costly, at least in the sense that reducing them may require diversion of resources away from the production of good outputs. Modeling undesirable outputs, for instance patient deaths, pollution and other detrimental side-effects of production activities (such as noise) has attracted considerable attention among production economists. A common approach is to treat detrimental variables as inputs, based on the economic argument that both inputs and detrimental side-effects incur costs for a firm and one is thus usually interested in decreasing both types of variables as much as possible (Cropper and Oates, 1992). Borrowing from Cropper and Oates (1992), one can conjecture that healthcare providing institutions implicitly seek to minimize their usage of factor inputs as well as undesirable outputs (for instance, the death of their clients). This is because, although it is the case that some patients die in the process of getting medical care, the overriding motive of a healthcare providing institution is to improve the health status of the patients or save their lives. However, Färe and Grosskopf (2003), argue that the treatment of undesirable outputs as inputs is inconsistent with the physical laws and the standard axioms of production theory. These authors advocate an alternative approach that models undesirable outputs by imposing an assumption that these are weakly disposable. The purpose of this study was to measure hospital technical efficiency in the presence of both desirable and undesirable output, specifically, patient deaths for a sample of Uganda's district referral hospitals. This is performed by means of nonparametric Data Envelopment Analysis (DEA) technique. Modeling Technical Efficiency With Undesirable Output The measurement of hospital technical efficiency
when both desirable and undesirable outputs are
produced requires the explicit provision for their joint
production. This study adapts the methodology by Dismuke
and Sena (2001) to model deaths in hospital
efficiency measurement. Denoting desirable outputs (if a
patient is discharged alive) by T = {(x,y,b): x can produce (y,b,)} (1) The technology consists of all feasible input and output quantities, i.e., it consists of all desirable and undesirable outputs that can be produced by the given input vectors. It is convenient to model the technology of the joint production of the good and bad outputs in terms of the output sets, i.e., P(x) = {(x,b):
(x,y,b) The technology T can be recovered from P(x) as follows: T =
{(x,y,b):(y,b) Therefore, the technology is equivalently
represented by either its technology set T or its output
set One important feature from the viewpoint of healthcare organizations/institutions (hospitals in the context of this study) is that it is costly to reduce patient deaths or other undesirable outputs. This idea is modeled by imposing the weak disposability of outputs assumption, i.e.,
Equation (4) states that reduction of patient deaths (undesirable outputs) is feasible if good outputs arealso reduced, given fixed input levels. With respect to the good outputs, it is assumed that they are freely or strongly disposable, i.e., .
Therefore, it is not feasible to reduce the undesirable outputs only, i.e., if (y,b) is feasible and b' ≤ b then it may not be possible to produce (y,b') using x, i.e.,
This problem would not arise providing that undesirable outputs could be disposed of freely or costlessly. Desirable and undesirable outputs must be distinguished in terms of their disposability because on the one hand, desirable outputs have positive prices, while undesirable outputs are non marketable and thus do not have readily observable prices. The notion that desirable and undesirable outputs are jointly produced is modeled by what Shephard and Färe (1974) refer to as null-jointness. This means that if no bad outputs are produced, then there can be no production of good outputs. If a hospital wishes to produce some live discharges, then there will be byproducts of undesirable outputs (patient deaths). Formally, we have
That is, if (y,b) is a feasible output vector composed of both desirable outputs (live discharges) y and undesirable outputs (patient deaths) b, then if no undesirable outputs are produced (b=0) then by null-jointness, the production of positive desirable outputs is not feasible, thus y = 0. Equation (5), states that the desirable outputs are "null-joint" with the undesirable outputs if the only way not to produce undesirable outputs is by not producing desirable output. In other words, the hospital must risk having some patient deaths in the effort to produce live patients (live discharges). Incorporating Undesirable Outputs In Dea Models Data Envelopment Analysis assumes non-negativity of all inputs and outputs. This assumption is not, however, always satisfied as it was the case in our application to hospitals, which led to the development of alternative models aiming at assessing efficiency in the presence of negative data. For DEA efficiency valuations, it is crucial to choose appropriate inputs and outputs and make some general assumptions about the technology structure with regard to convexity, disposability and returns to scale. In the presence of negative data the use of radial measures of efficiency traditionally used in DEA is problematic. Classical DEA models as described in Charnes et al. (1994) rely on the assumption that inputs have to be minimized and outputs have to be maximized. DEA assumes that inputs and outputs are isotonic, that is, increased input use reduces efficiency, while increased output increases efficiency. However, this is not always the case for some input and output variables. However it was mentioned already in the seminal work of Koopmans (1951) that the production process may also generate undesirable outputs like smoke pollution or waste. The treatment of undesirable outputs has similarities with the treatment of negative outputs since both should be contracted rather than expanded (note that this wording is only valid when it refers to multiplying factors associated to negative data. Indeed, in the case of negative outputs one wants to increase good outputs, while at the same time decreasing undesirable outputs). Several approaches exist to deal with undesirable outputs as can be seen in the review by Allen (1999) as well as Dyckhof and Allen (2001). The approaches for incorporating undesirable outputs in DEA may be categorized into direct and indirect approaches (Scheel, 2001). Direct Approaches On the one hand, direct approaches use the original output data but modify the assumptions about the structure of the technology set in order to treat the undesirable outputs appropriately. The direct approach suggested by Färe et al. (1989) replaces strong disposability of outputs by the assumption that outputs are weakly disposable while only the sub-vector of good outputs is strongly disposable. Other direct approaches use the directional distance function, first proposed by Chung et al. (1997) to deal with negative output data. The main advantage of the directional distance approach over the existing approaches is that it is able to provide efficiency scores, similar in meaning to radial efficiencies traditionally used in DEA, while at the same time negative data are used without the need to subjectively transform them. Finally the approach yields targets that are, in general, easier to achieve than those resulting from the additive model. Indirect Approaches Conversely, indirect approaches transform the values of the undesirable outputs by a monotone decreasing function ¦ such that the transformed data can be included as "normal" (desirable) outputs in the technology set T (since, after retransformation, increasing these values means decreasing the undesirable outputs). The indirect approaches suppose that
their transformed data are meaningful (for
instance, consider the bad output "mortality rate" and
its translated additive inverse "survival rate"), the
direct approach uses the original output data by
assuming that it is not possible to decrease bad outputs
without simultaneously decreasing good outputs. Outputs
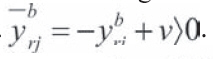
are strongly disposable if (y,x) Suppose B that represents the matrix of bad output data such that each row represents a given DMU whilst each column captures one bad output. In the presence of bad outputs, DMU k is efficient if there is no vector (x,b',y') or in the technology set such that x ≤ xk , b'≤ bk and y'≥ yk with at least one strict inequality. Data Transformation Traditionally negative data is handled in efficiency applications through some data transformation so that all negative data are converted into positive data (see for example, Pastor, 1994; Lovell, 1995). Such transformation of the data may have implications for the solution, classification, or ordering of the DEA results (Seiford and Zhu, 2002). There are some models whose solutions are invariant to data transformations, usually referred to as translation invariant. In the presence of negative data the most often used model is the variable returns to scale (VRS) additive model of Charnes et al. (1985), which is translation invariant as demonstrated by Ali and Seiford (1990). A translation invariant model is such that `an affine displacement of data does not alter the efficient frontier' (Ali and Seiford, 1990). The BCC model has been found translation invariant (Ali and Seiford, 1990). However, if the efficiency scores should in addition not be affected, then the BCC output-oriented model allows a translation of inputs and the input-oriented model of outputs (Lovell and Pastor, 1995; Pastor, 1996). The additive DEA model of Cooper, Thompson and Thrall (1996) is translation invariant. However, this model does not produce the usual efficiency scores (i.e., between 0 and 100 percent) and may not be as easily interpretable. An alternative is to recognize that the Banker, Charnes, Cooper (BCC) VRS input oriented DEA model is in fact invariant to any output translations. The additive model is not however, in its original form, units invariant (independent of scales of measurement). Due to this limitation Lovell and Pastor (1995) put forward a units invariant version of the additive model that uses a weighted sum of slacks where the weights are the inverse of the standard deviations of each input and output (see also Pastor, 1996; Thrall, 1996) corresponding to the slack. The main drawback associated with the additive model is the fact that it yields in respect of an inefficient unit the `furthest' targets on the production frontier, besides not yielding an efficiency measure. Thus the model does not yield very practical guidance as to how a unit might improve its performance nor does it make it possible to readily rank units on performance. The translation invariance of the additive model is subject to it being specified under VRS. Constant returns to scale (CRS) models are not translation invariant because they do not impose the sum of the intensity variables to equal unity (Banker et al., 1984). If data cannot be translated in a CRS model without changing the model's solution, then the issue is whether CRS models can be used in the presence of negative data. The other way of incorporating bad outputs suggested by Koopmans (1951) and applied by Berg et al. (1992) is based upon a transformation known as the additive inverse. The bad outputs are incorporated as good outputs with values ¦ (B) = -B. Apart from the sign of the bad outputs it generates the same technology set as incorporating bad outputs B as inputs. The classification of Decision Making Units (DMUs) as efficient or inefficient is the same when the bad outputs are transformed via ¦ or incorporated as inputs into the technology set. The classification is preserved if the values of bad outputs are "translated" in the sense of Ali and Seiford (1990). According to the methodology by Ali and Seiford (1990), one adds to the additive inverse of the bad output i a sufficiently large scalar li such that the resulting output values fk i (B) = -bk i +λ ii are positive for each DMU k . For the present study, suppose that yg rj and yb rj represent the good (desirable) and negative (bad
or undesirable) outputs, respectively (these can also
be termed `less-is-better outputs'). It is the case that
we wish to reduce yb rj while at the same time increasing yg rj in order to improve the hospital's performance.
In the output-based BCC envelopment model,
however, both yg rj and yb rj are supposed to improve
performance. To increase the good outputs and to reduce the
bad outputs, Zhu (2003) proceeds as follows: Each undesirable output is multiplied by "-1" and then a proper value vr is found to let all negative
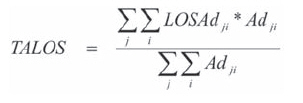
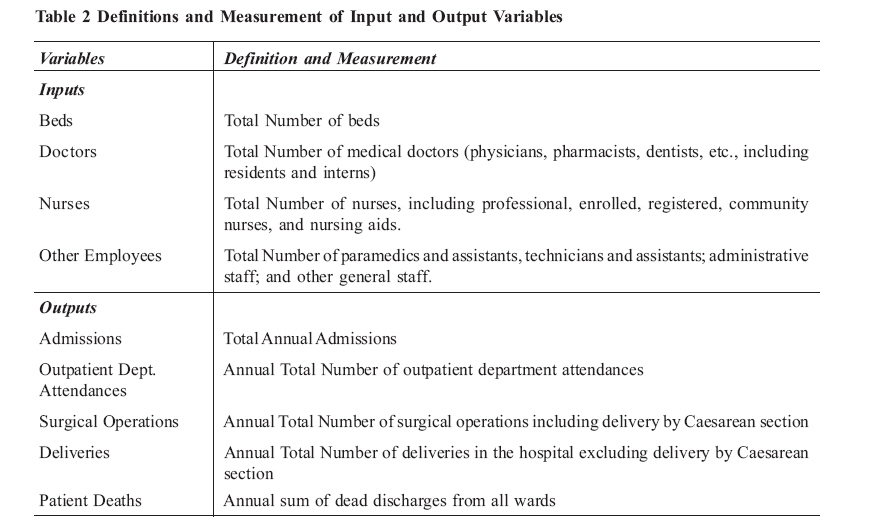
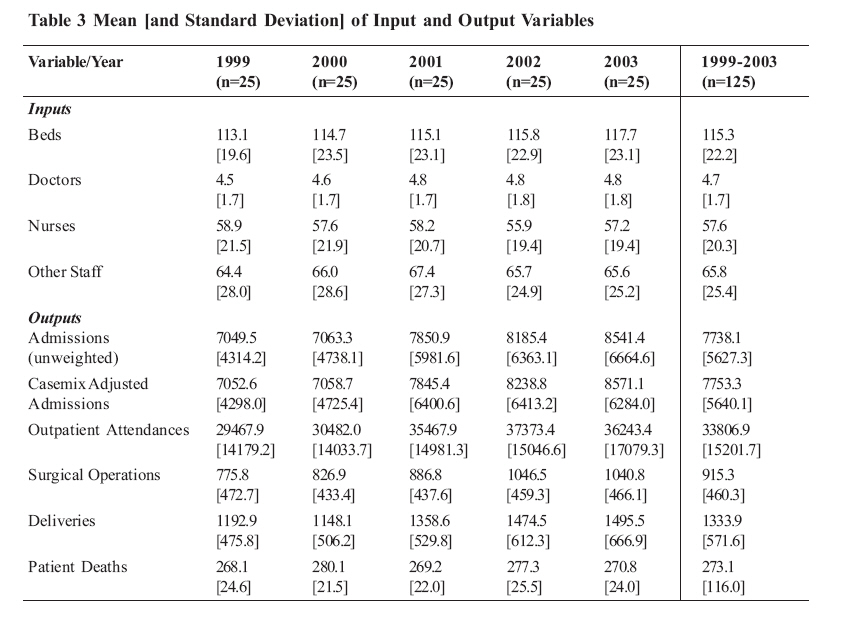
undesirable outputs be positive, i.e. Data and Modeling Choices The study investigated the technical efficiency of district referral hospitals. As such, the study's unit of analysis is the district referral hospital. A sample of twenty five (25) of the 38 district referral hospitals was drawn as follows: seven (7) from the Eastern, eight (8) from Western (except Bundibugyo district referral hospital which was also left out due, in part, to insecurity and poor accessibility during data collection) and ten (10) from the Central regions of Uganda. The Northern region was left out due to security concerns during data collection and because the operating environment of hospitals in this region is not comparable to that of their counterparts in the remaining regions, the reason being that the region has been insecure for the last 18 years or so and therefore including it would bias the sample. There is a conscious attempt to account for the heterogeneity of the hospital environment. The sample of hospitals is limited to district referral hospitals indicating that the `care mix' can be assumed to be fairly comparable. The assumption is that hospitals of similar organizational form produce similar types of health care. Because the sample hospitals have the same scope of service, it is reasonable to assume homogeneity in the range of health care services they provide. The choice of the sample size, number of inputs as well as the number of outputs was guided by the rule of thumb proposed by Banker and Morey (1989), that, n ³ 3(m+s) where: n is the number of DMUs included in the sample; m is the number of inputs; and s is the number of outputs included in the analysis. The rule captures two issues, sample size and number of factors [(m+s)]. However, Pedraja-Chaparro et al., (1999) note that the rule ignores two other issues, distribution of efficiencies as well as the covariance structure of factors. Nevertheless, we still use the rule of thumb as a guide in the absence of any a priori view on the number of factors. A schedule containing the data needed for the study (hospital inputs as well as outputs) was constructed. The schedule was piloted on three district referral hospitals which included Nakaseke, Kayunga and Entebbe. There was a discrepancy between the initial research instrument and the Health Management Information System databases. After the pilot study, the schedule was adjusted to the Health Management Information System (HMIS) databases. A panel data set was assembled and a common set of input and output indicators was constructed to support the estimation of Data Envelopment Analysis (DEA) models. Input as well as output data were gathered for the twenty five hospitals over the 1999-2003 period. The potential gains from using panel data to measure technical efficiency appear to be quite large. A panel obviously contains more information about a particular Decision Making Unit than does a cross-section of the data. The HMIS launched in 1997 is the source of the data for the present study. However, the study concentrates on the period 1999-2003 because this period yielded a balanced panel. Data on the hospital inputs and the outputs were sought from the HMIS databases of each hospital. Twenty five out of 38 district referral hospitals were selected in the regions of Western, Eastern and Central Uganda due to the decentralized delivery of healthcare services and their being conducive for data collection compared to the Northern region. Comparability of data across hospitals was ensured by a common database that all public district referral hospitals are required to submit to the District Director of Health Services on a monthly and annual basis. The HMIS captures data on a calendar year basis. Administrative data and annual reports were collected at each hospital to generate the dataset. Unfortunately, financial data on a majority of hospitals were not readily available and as a consequence, the variable total operating costs has been left out. Specifically, data on admissions, deaths, inpatient days by ward (inpatient days and admissions by ward were employed in the computation of the casemix index for each hospital ) as well as surgical operations, outpatient department attendances was collected from the Hospital Annual Reports. In-hospital mortality was used to account for quality of care whilst a length of stay-based case-mix index was computed to provide for the heterogeneity of admissions. DEA models to measure technical efficiency are estimated by means of DEAP version 2.1; a Data Envelopment Analysis (DEA) Program developed by Coelli (Centre for Efficiency and Productivity Analysis, University of New England, Australia). In order to check the stability and sensitivity of DEA results, a multi-pronged approach is adopted in the analysis of DEA results. This includes assessment of the efficiency of the sample hospitals, inclusion/exclusion of inputs/outputs, providing for case-mix in each hospital's patient load, analyzing the correlation between different models over time, running the models both on the cross-sectional and pooled datasets and assessing the performance of hospitals across all models based on their efficiency scores and rankings. Choice of Inputs and Outputs A typical healthcare institution like a hospital embraces a variety of resources (human, material and knowledge amongst others), which are used in a series of processes that ultimately aim to improve upon the medical condition of the patient and contribute to healthier communities. The estimation of technical efficiency requires the careful choice of the sample size as well as the number of factors (number of inputs plus the number of outputs). A Data Envelopment Analysis (DEA) study requires the careful selection of inputs and outputs. This is due to the fact that the distribution of efficiency is likely to be affected by the definition of outputs and the number of inputs and outputs included (Magnussen, 1996). Theoretically, improved health status is the ultimate output of hospitals or the health care system generally. Nevertheless, the measurement of health status poses difficulties because health is multi-dimensional and there is subjectivity involved in assessing the quality of life of patients (Clewer and Perkins, 1998). Because of the difficulty of accurately measuring improvement in health status, hospital output is measured as an array of intermediate outputs (health services) that improve health status (Grosskopf and Valdmanis, 1987). The measures used in the study represent the general areas of direct services which hospitals provide to patients. Attempts are made to incorporate a fairly comprehensive list of inputs and outputs which reflect the general scope of hospital activities in order to obtain informative and robust results. However, the fact that DEA operates more powerfully when the number of DMUs exceeds the number of the combined total of inputs and outputs by at least twice (Drake and Howcroft, 1994) restricts the input and output measures chosen for the study. Input Variables: Four inputs are constructed and include doctors, nurses, other staff, and beds. Due to lack of information on Full Time Equivalent staff, the study uses absolute numbers of human resources providing health care services to approximate the labor resources employed. Because there is some variation in how the hospitals record their staff in the registers, the study minimizes this by combining labor categories into three variables: `doctors', `nurses' and `other employees'. The variable "doctors" includes all senior medical officers, medical officers as well as dental surgeons. The variable `nurses' includes senior nursing officers, nursing officers, Uganda registered nurses, midwives, enrolled midwives, enrolled nurses, nursing assistants, and nursing aides. Finally, the variable "other staff" includes clinical officers, dispensers, anesthetics officers, radiographers, orthopedic officers, laboratory technologists and technicians, laboratory assistants, hospital administrator, accountant, clerical officers, supplies officers, stores assistants, telephone operators, stenographers, copy typists, records assistants, dark room attendants, mortuary attendants, drivers, kitchen attendants, security guards, artisans (carpenters), electrical technicians and plumbers. All the three staffing measures include only salaried hospital staff. It should be noted that the inclusion of only salaried staff might understate the hospitals' human resource complement. There were no data for capital inputs for instance buildings and equipment. As a consequence, capital is approximated by the number of beds per hospital. Beds are often used to proxy for capital stock in hospital studies usually because a reliable measure of the value of assets is rarely available. District referral hospitals are distinguished from other public hospitals as being 100-bed hospitals. Nevertheless, the bed stock has been on the increase in some hospitals as they try to cope with increasing numbers of admissions. Moreover, in most hospitals due to limited bed capacity, there are what can be termed "floor admissions" (hospital records do not clearly distinguish "bed admissions" from "floor admissions" which complicates its tracking across hospitals and through time for a given hospital. They are all lumped together as "admissions"). In the ideal situation no hospital would admit when its bed stock is exhausted. However, being the only hospital with relatively `free' healthcare in the district, admissions beyond available bed capacity are admissible given that patients may lack alternatives due, partly, to the high levels of poverty. These will unfortunately make some hospitals appear more efficient than others with respect to bed capacity as some of the hospitals' inpatients have no beds. This will also have implications for total factor productivity measures and in particular technology change. Output Variables: The output measures focus on the process type or production volume style estimates of hospital output. The study examines a number of measures of district referral hospitals' output. These include admissions, deliveries, operations, and outpatient department attendances. Inpatient Care Inpatient care output for each district hospital was measured in two ways: first as annual cases treated, specifically annual admissions, and then as "case-mix adjusted" admissions. Case-mix adjusted admissions are defined as annual admissions times the case-mix index. The index is the (normalized) weighted sum of the proportions of the hospital's inpatients in different wards where the weights reflect the length of stay of its patient load. Case-mix adjusted admissions transform admissions into ward homogeneous patient loads. For a given level of admissions, the adjusted measure captures output differences due solely to case-mix variation. In particular, it controls for the fact that hospitals whose wards exhibit relatively longer average length of stay may be due to a more complex mix of patients compared to wards with relatively short average length of stay. The adjusted measure captures output differences due to variations in average length of stay, and by proxy, case-mix. While the data prohibits more detailed estimation of case-mix differences, this approach attempts to adjust output into more homogeneous and comparable groupings. Deliveries: Deliveries include all deliveries in the hospital without adjusting for neonatal deaths because resources are expended irrespective of the status of the birth. Surgical Operations: Surgical operations include major operations, minor operations as well as Caesarian sections. Outpatient Department Attendances: Outpatient department attendances include new cases as well as re-attendances. Patient Deaths: Patient deaths denote the total of dead discharges across the four wards (male, female, maternity and pediatrics). A summary of variable definitions is provided in Table 2 while Table 3 contains descriptive statistics for the input and output variables for each sample year. The means and standard deviations reported in the table suggest that there are substantial variations across the sample with respect to the input and output variables. The mean and standard deviation of inputs and outputs analyzed by the study are shown in Table 3 whereas Table 4 presents the Pearson correlation matrix of input and output variables. The mean and standard deviation vary marginally by year across the study period and for the pooled dataset. This implies that on average the variables display some degree of stability on a year to year basis across the study period and for the pooled dataset. In Table 4, supply-side factors are correlated, as are some measures of outputs (as expected) and where possible we try to maintain parsimonious specifications to reduce double counting. Table 5 presents the six models estimated in the measurement of technical efficiency. Modes 1 to 5 incorporated desirable outputs while model 6 included both desirable and undesirable outputs. Modeling input-oriented DEA technical efficiency scores, model 1 includes four inputs namely beds, doctors, nurses and other staff, and four outputs: admissions (un-weighted), outpatient department attendances, surgical operations and deliveries. Model 2 keeps the same inputs and outputs as Model 1 but replaces admissions (un-weighted) with case-mix adjusted admissions. Model 3 includes the same inputs as Models 1 and 2, as well as two outputs, case-mix adjusted admissions and outpatient department attendances. Models 4 and 5 have two inputs, beds and all staff grouped together; Model 4 includes the same outputs as Model 3 while Model 5 includes the same outputs as Model 2. Models 1 to 5 were run for individual years and the pooled dataset over the 1999-2003 period in the estimation of technical efficiency. Model 6 differs from model 1 in only one respect that it replaces outpatient department attendances with patient deaths and it was run for 1999. This is because patient deaths are more correlated to the other outputs (un-weighted admissions; surgical operations and deliveries) than to outpatient department attendances. Models 2 to 6 are based on slight modifications of model 1. Each of models 2 to 6 contains a minor definitional change (such as the inclusion or exclusion of a variable from a model) to the specification contained in model 1. For instance, model 2 uses the same inputs and outputs as model 1 with the exception of a different definition of the admissions (which have been adjusted by means of the case-mix index generated in Chapter five). Model 2 was chosen as the preferred model because it was decided that case-mix adjusted admissions was conceptually a better measure of output than admissions (un-weighted). The model also gives a sensible spread of efficiency scores for the whole sample and contains a plausible number of variables or factors (input plus outputs) when compared with the size of the overall sample. In order to check the stability and sensitivity of DEA results, a multi-pronged approach is adopted in the analysis of DEA results. This includes simultaneous assessment of the efficiency of the sample hospitals and the inclusion/exclusion of inputs/outputs. In order to capture the variations in efficiency over time, Boussofiane et al., (1991) describe the following method. According to them, given units with data on their input/output measures in periods, then a total of units are assessed simultaneously. The study utilizes this method in its analysis. Following the methodology by Boussofiane et al., (1991), given 25 hospitals and data on their input/output measures over a 5-year period, a total of 125 hospitals are assessed simultaneously. This data pooling allows for a greater sample size and a comparison of efficiency estimates. Providing for Case-mix If the analysis to follow used inpatient days, deliveries, operations, as proxies for hospital output, a serious shortcoming in the analysis would exist: the failure to control for case-mix differences between hospitals. Specifically, while it might be the case that one hospital produces more outputs (e.g. inpatient days, operations, deliveries) for a given combination of inputs than another hospital, the first might be no more efficient if it consistently treats a relatively less sophisticated mix of cases, that is, a mix of cases requiring relatively fewer inputs per unit of output. Any study of hospital technical efficiency must then attempt to control for differences in the case mix between different hospitals. Lacking data on individual hospital case mix as well as billing or cost data; the study adapted the English Department of Health's Casemix index (Hernandez, 2002). The case-mix index () for hospital is approximated by means of the average length of stay to control for the case-mix among different hospitals as follows:
where: HIi = case mix index for hospital ;
And
where: LOSAdji = unit length of stay of
ward's admissions in hospital ;
And
where: LOSAdji = unit length of stay of ward 's
admissions in hospital;
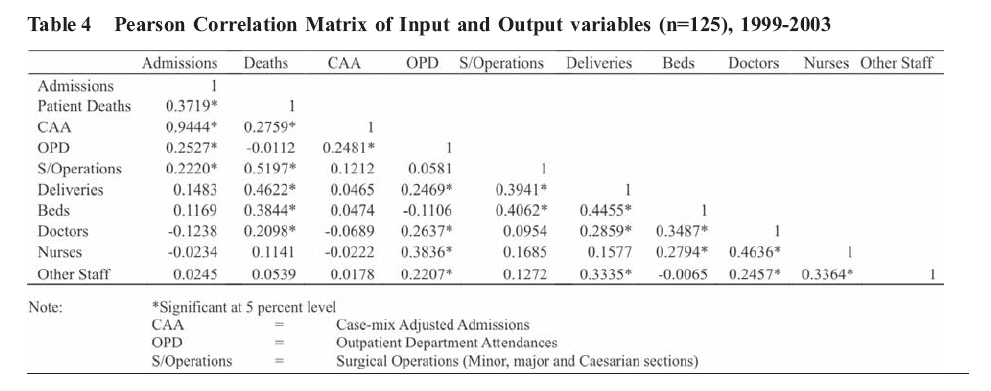
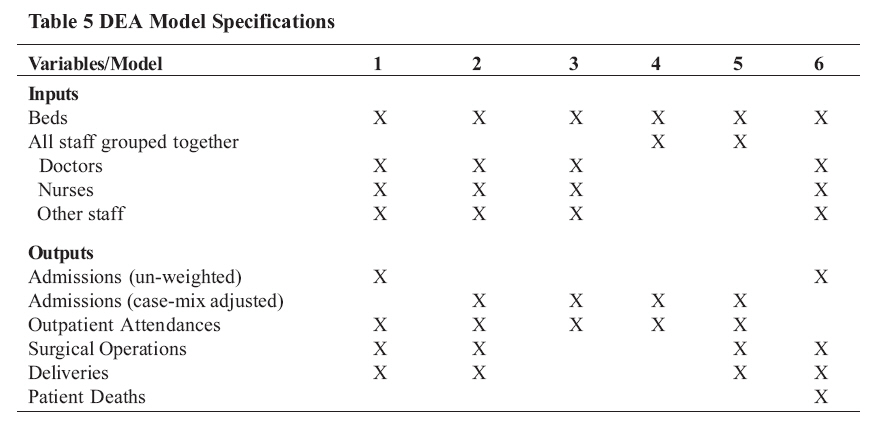
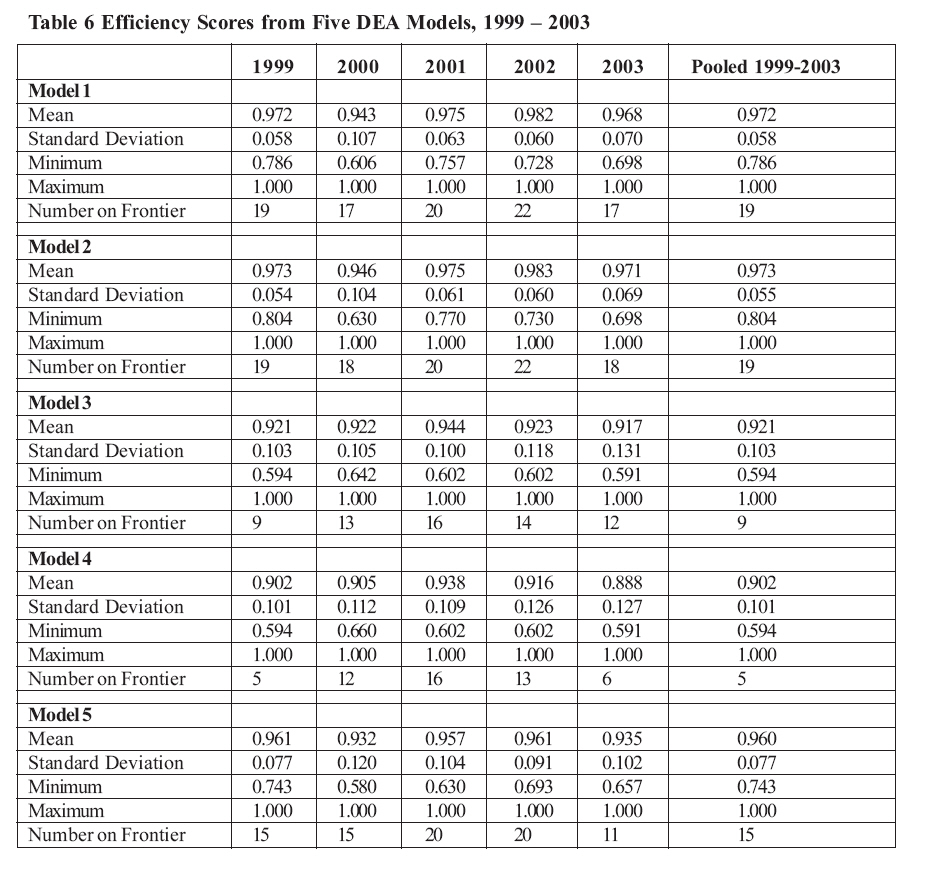
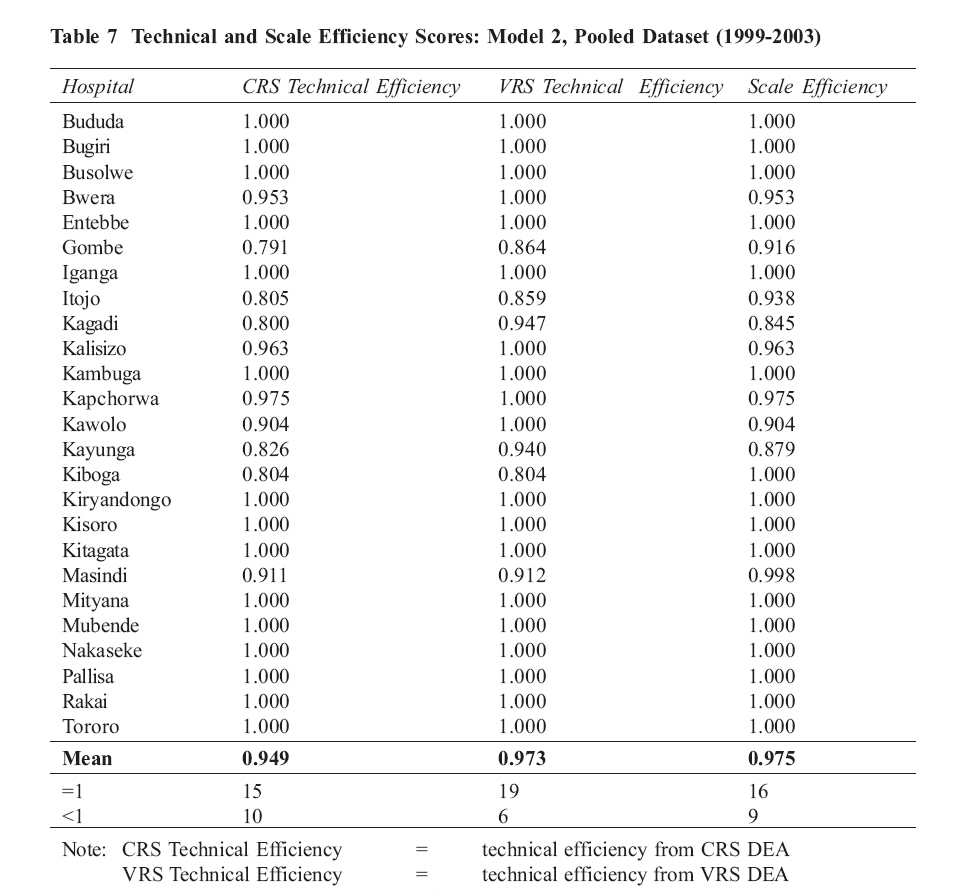
The above approach to approximating the case mix index for a given hospital is premised on the assumption that the wards produce very similar types of output across hospitals. However the length of stay-based case-mix index has a number of shortcomings which include but are not limited to: (i) it is not based on individual level patient data (it does not account for age, gender, complexity); (ii) hospital wards may not use homogeneous definitions across hospitals; (iii) there is a likelihood of different length of stay policies across hospitals; (iv) length of stay is susceptible to outlier data (hospitals provide more than curative care for instance palliative care, social care, etc.,); and (v) discharges might be linked to the degree of integration with community care in which case hospitals might keep patients longer if there are weak community health service links. RESULTSResults without Undesirable Output First, we present the empirical results obtained from applying the DEA technique to a number of model specifications (models 1 to 5) which exclude the undesirable output of patient deaths. The DEA method provides relative technical efficiency scores for the sample in question. One vital important consideration in this analysis is the sensitivity of efficiency estimates to the change in model specifications. Due to the non-parametric nature of DEA, it is not possible to test model specifications or goodness-of-fit in the usual parametric manner associated with regression analysis. Because of this, the study employed a number of models to analyze the sensitivity of DEA results to changes in the choice of input or output variables. Technical efficiency scores only refer to the relative performance within the sample. Hospitals with an efficiency score of 1.0 (one) are efficient relative to all other hospitals in the sample, but may not necessarily be efficient by some absolute or gold standard. This is important to note because inefficiency is inherently unobservable and all we can do is benchmark DMUs against each other, not against some absolute standard. The five models result in different measures of technical efficiency and Table 6 reports the efficiency scores from the six DEA models using annual data as well as the pooled dataset (1999-2003). The mean efficiency scores differ depending upon the model specification. To check for the robustness of the models to changes in the measurement of admissions, models 1 and 2 were run. Comparing models 1 and 2 we find that, in general, the efficiency scores of hospitals rise when the admissions are adjusted by means of the case-mix index. For instance, the mean efficiency score marginally rises from 0.972 (97.2 percent) for Model 1 to 0.974 (97.4 percent) for Model 2 in 1999. This, therefore, implies that not adjusting admissions to the structure of the patient load understates the efficiency scores of hospitals. Although the difference is small, model 2 is preferred to model 1 because this is better than no case-mix adjustment at all despite its being rather crude. Thus, in 1999, relative to the frontier of the sample hospitals, Uganda's district referral hospitals realized approximately 97 percent of their potential output. The same potential output is produced (97 percent) even when efficiency is estimated from the pooled dataset. On average 19 out of the 25 hospitals operated on the production frontier over the sample period when Models 1 and 2 are estimated. Comparing models 3 and 4 generally shows that lumping human resources into one variable reduces the efficiency scores by an average 1.6 percent and reduces the number of hospitals on the frontier from 19 to 9 (for Model 3) and to 5 (for Model 4). When models 4 and 5 are compared, it is revealed that incorporation of more output variables increases the efficiency scores by an average of 4 percent and increases the number of hospitals on the production frontier by 6 hospitals (for Model 3) and 9 hospitals (for Model 4). These results are driven by the choice of variables in the modeling process. Also in line with expectations (Smith, 1997), the models with larger numbers of inputs and outputs yield higher average efficiencies. As expected, the inclusion of additional variables or the disaggregation of existing variables (while holding the number of observations constant), has the effect of increasing efficiency scores for observations which were not previously efficient. This effect is seen by the difference in average efficiency scores between models 1 and 2 and models 3 or 4. Models 1 and 2 have the most factors, thus most hospitals end up on the frontier. This is in accordance with Nunamaker, who says that no firm can become `less' efficient by the addition of a variable, such that firms which were previously fully efficient will remain fully efficient with the addition of extra variables (Nunamaker, 1985). The only shortcoming of these two models is that they are less discriminating. It is noteworthy that models 1 and 2 perform as well as the corresponding pooled dataset both in terms of efficiency scores and hospitals on the frontier. The similarity between the results for models 1 and 2 (n=25) vis-à-vis those for the pooled dataset (n=125), shows that DEA models perform better with large samples (Pedraja-Chaparro et al., 1999). The technical and scale efficiency scores for individual hospitals, estimated with the preferred model (model 2, in which the admissions have been adjusted for the patient characteristics by means of the case-mix index generated via the average length of stay) using the pooled dataset (1999-2003) are presented in Table 7. On average, the sample hospitals had a technical efficiency (TE) score of 97.3 percent, while the scale efficiency (SE) score stood at 97.5 percent. Of the 25 hospitals (but the pooled dataset has 125 hospitals i.e. 25 hospitals over a five-year period. However, DEAP requires the number of DMUs as well as time periods to be specified and reports results on the specified number of DMUs), 19 (76 percent) were technically efficient since they had a relative technical efficiency score of 100 percent. The remaining 6 (24 percent) had a technical efficiency score of less than 100 percent, implying that they were technically inefficient. The TE score among the technically inefficient hospitals ranged from 80.4 percent in Gombe hospital to 97.3 percent in Masindi hospital. This empirical finding implies that Gombe and Masindi hospitals could potentially reduce their factor inputs by 19.6 percent and 2.7 percent, respectively while leaving their output levels fixed. Sixteen (64 percent) of the hospitals had a scale efficiency score of 100 percent implying that they had the most productive size for that particular input-output mix. The remaining nine (36 percent) hospitals have a scale efficiency score of less than 100 percent and as such they were not scale efficient. Constant returns to scale were exhibited by all the sixteen scale efficient hospitals. This implies that they were operating at their most productive scale sizes. Eight of the nine scale inefficient hospitals displayed increasing returns to scale (IRS) whereas one of the scale inefficient hospitals had decreasing returns to scale (DRS). To operate at the most productive scale size, a hospital with DRS should scale down its inputs as well as its outputs. In the same vein, a hospital exhibiting IRS should expand both its outputs and inputs.
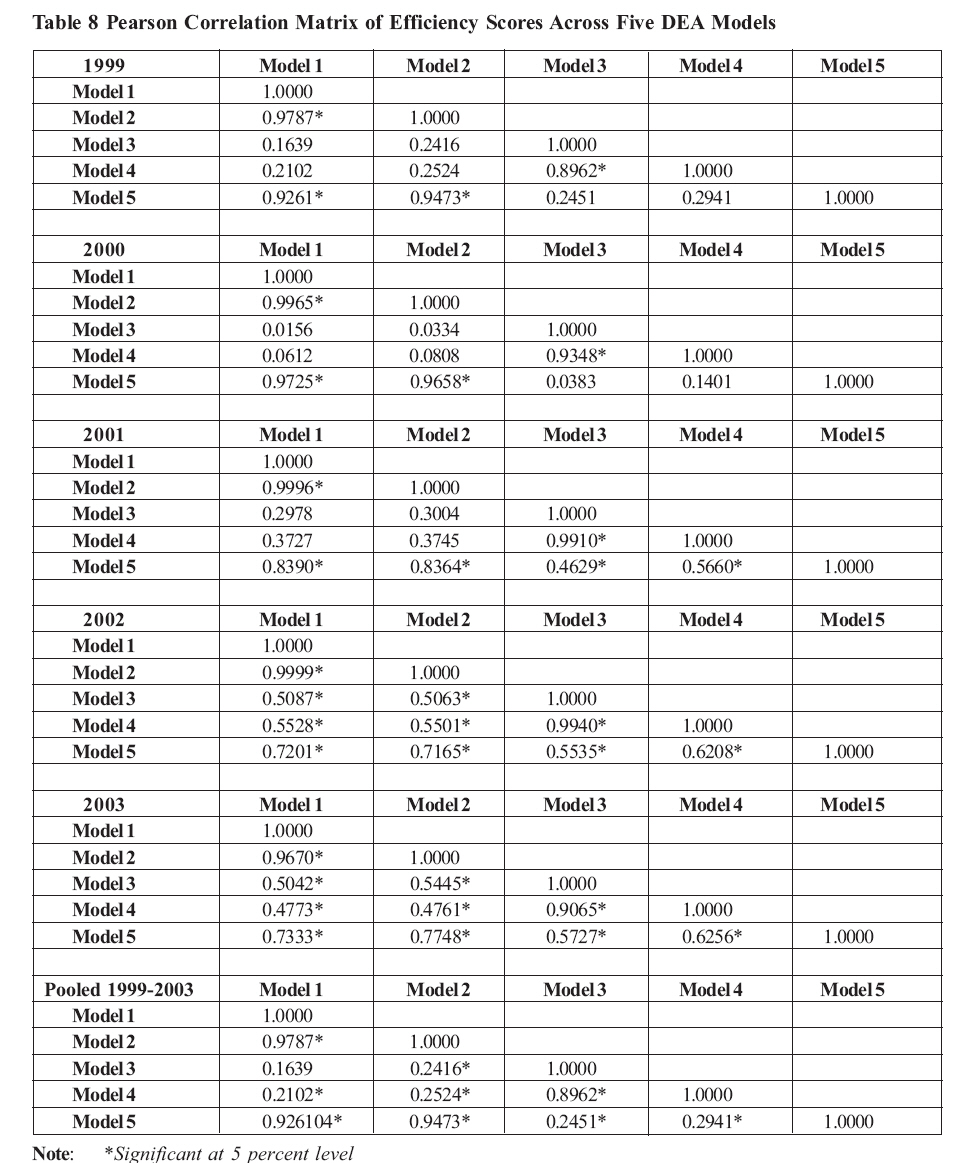
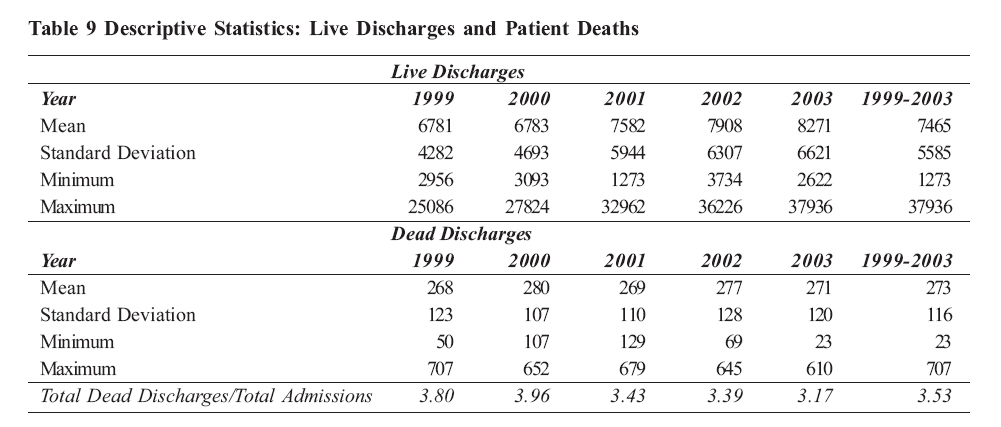
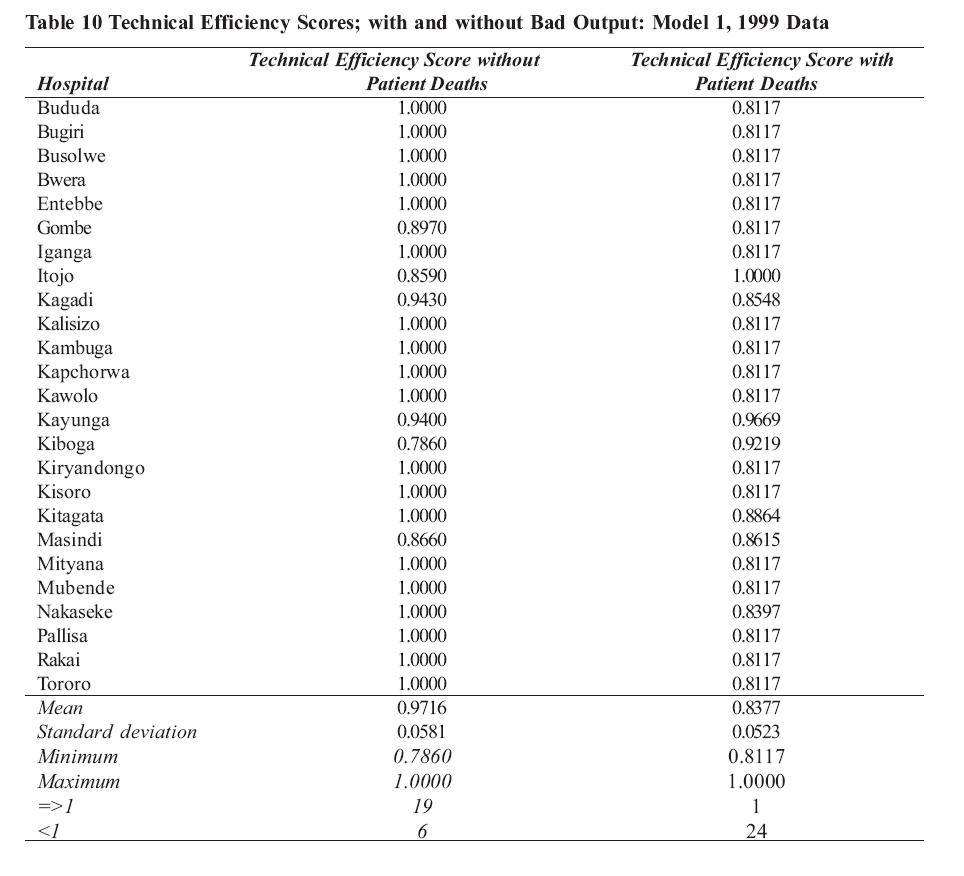
Table 8shows the Pearson correlation matrix of efficiency scores across the five DEA models for individual years and for the pooled dataset. This was done to check model stability over time. The year 1999 has the same number of significant Pearson correlation coefficients as 2000. Likewise, 2002 and 2003 have same number of significant coefficients. This, therefore, implies that the five models are reasonably stable for the years 1999, 2000, 2002 and 2003 but not for 2001 and for the pooled data (1999-2003). Caution has to be exercised in the interpretation of the results across models (i.e., consistency across model specifications) because some models are nested in other models. Results with Undesirable Output The production of desirable output is often accompanied by simultaneous or joint production of undesirable outputs. In a healthcare setting, the primary desirable output is the patient recuperating after receiving medical attention/care, whereas the undesirable output is the death of the patient. Obviously, there are patients who leave the healthcare institution worse off than they came. Therefore, it makes economic sense to evaluate the technical efficiency of hospitals by crediting live discharges (desirable output) while at the same time penalizing patient deaths (undesirable output). The study tries to evaluate the technical efficiency of hospitals by treating patient deaths as undesirable outputs while the desirable outputs comprise of admissions, operations, deliveries and outpatient department attendances. Table 9, presents the descriptive statistics of live and dead discharges, for individual years and for the 1999-2003 period. The proportion of dead discharges to total admissions is also indicated. It is apparent that the mean of live discharges lies between 6,781 and 7,908 with a standard deviation in the range 4,282-6,621. The dead discharges on the other hand, have a mean which lies between 268 and 280, with a standard deviation in the range 107-128. The proportion of dead discharges in the total admissions is in the range of 3.17 - 3.80. The deaths vary by ward or specialty. The output-oriented technical efficiency scores when the undesirable output (the bad output (patient deaths) are not translated are presented in Table 6.9 by means of model 1 (with admissions not adjusted by means of the case-mix index) with 1999 data. Patient deaths are incorporated into the technical efficiency analysis and model 6 is estimated by means of Zhu's (2003) DEA Excel Solver. Table 10 reveals that when all hospitals are credited for producing desirable outputs and penalized for producing an undesirable output by way of patient deaths, their mean technical efficiency score falls from 0.972 to 0.838 while the standard deviation also falls from 0.058 to 0.052. The environmentally-adjusted technical efficiencies are generally lower than the original The minimum technical efficiency score rises from 0.786 to 0.812. In addition, all hospitals attain an efficiency score of at least 81 percent. Therefore, the incorporation of patient deaths in the analysis impacts on the hospitals' efficiency scores by generally lowering them. The results thus indicate that excluding undesirable outputs generally overstates the technical efficiency of hospitals. Thus, it is important to account for quality of care provided. Discussion The technical efficiency of some hospitals in the sample is less than 100 percent and this should be of some concern to Ministry of Health policymakers and planners interested in good value for money. Given the existing levels of both technical and scale inefficiency, the attainment of the national Health Policy objectives as well as health-related global and regional targets such as Abuja targets and the Millennium Development Goals (MDGs) will be compromised. Therefore, the efficient use of existing resources should be the center piece of the national health policy. Nevertheless, the degree of inefficiency and policy response should be contingent upon the hospital's operating environment and appropriate action ought to be taken only after a thorough investigation. While DEA is a useful diagnostic tool, it might not be appropriate to base funding and resource decisions or efficiency targets on the basis of the resultant efficiency estimates. Technical as well as scale inefficiency is present in varying degrees in a majority of hospitals in both developing and developed countries (see for instance, Wouters 1993; Ferrier and Valdmanis, 1996; Ozcan et al., 1996; Ersoy et al., 1997; Rosko and Chilingerian, 1999). Nevertheless, in Sub-Saharan Africa, few hospital efficiency studies have been carried out using frontier models (see for example, Kirigia et al., 2000; Zere et al., 2000; Kirigia et al., 2001; Kirigia et al., 2002; Kirigia et al., 2004; Osei et al., 2005, and Renner et al., 2005). However, most of the African healthcare efficiency studies have mainly looked at public hospitals. Thus, there is no clear and quantifiable evidence on the type and degree of inefficiency given that the not-for-profit as well as private healthcare providers play a major role in healthcare delivery in Africa's healthcare systems. Additionally, none of the African studies have incorporated both desirable and undesirable outputs in the analysis of hospital technical efficiency, which the present study has attempted to do. Twenty-four percent of the sample hospitals were technically inefficient while 36 percent were scale inefficient. Similar hospital efficiency studies in Africa have found hospitals to be both technically and scale inefficient. For instance, Osei et al. (2005) found 47 percent of the public hospitals in Ghana to be technically inefficient while 59 percent were scale inefficient. While investigating the technical efficiency of peripheral health units in Pujehun district of Sierra Leone, Renner et al. (2005) found 59 percent of the 37 health units be technically inefficient, while 65 percent were scale inefficient. A similar study by Zere et al. (2000) and Kirigia et al. (2000), among 55 public hospitals in Kwazulu-Natal, South Africa, found 42 percent of the hospitals to be scale inefficient while 40 percent were technically inefficient. CONCLUSION Traditional practice in technical efficiency measurement for health providers has been to ignore undesirable outputs which are a subset of the output set. Nonparametric Data Envelopment Analysis (DEA) technique has been modified to give a more realistic and comprehensive score of production efficiency considering both, desirable and undesirable outputs. The modified DEA credits a hospital for its production of desirable outputs but penalizes it for its production of undesirable outputs (patient deaths). The incorporation of patient deaths in the analysis impacts on the each hospital's efficiency score by generally lowering them. The results indicate that excluding undesirable outputs generally overstates the technical efficiency score of hospitals. Additionally, the inclusion of patient deaths in the measurement of hospital technical efficiency is also recognized as an attempt to incorporate quality of care in the efficiency analysis. References
Copyright 2008 - Department of Health Sciences of Uganda Martyrs University The following images related to this document are available:Photo images[hp08006t5.jpg] [hp08006t9.jpg] [hp08006t8.jpg] [hp08006t6.jpg] [hp08006t1.jpg] [hp08006t3.jpg] [hp08006t7.jpg] [hp08006t10.jpg] [hp08006t4.jpg] [hp08006t2.jpg] |
| |||||||||
 . This can be attained for instance by
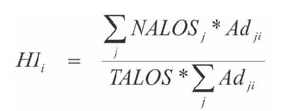
 = total number of admissions treated by
hospital
= total number of admissions treated by
hospital 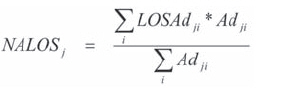