 |
| About Bioline | All Journals | Testimonials | Membership | News |
|
||||||
|
||||||
African Health Sciences, Vol. 2, No. 2, April, 2002, pp. 56-62 Spectrophotometric determination of sulphamethoxazole and trimethoprim (co-trimoxazole) in binary mixtures and in tablets S. Balyejjusaa, R.O. Adomeband D. Musoke c Department of Pharmacy, Makerere University, Faculty of Medicine, P.O.
Box 7072, Kampala, Uganda. Code Number: hs02040 ABSTRACT Background: The formulation of sulphamethoxazole (S) and trimethoprin (T) (CO-TRIMOXAZOLE) in a combination mixture is very good pharmacologically since it enhances the efficacy of the individual drugs. However in this combination, difficulties in analysis on ordinary UV spectrophotometry are introduced because the two components give overlapping spectral bands on zero-order. The United States Pharmacopoea (USP)-recommended HPLC analytical method is quite expensive. Key words: sulphamethoxazole, trimethoprim, derivative spectroscopy, simultaneous determination. INTRODUCTION The rationale for the combination of trimethoprim and sulphamethoxazole (CO-TRIMETHOXAZOLE®) for the treatment of infections caused by susceptible bacterial organisms, follows the practical application of the principle that if two drugs act on sequential steps in the pathway of an obligate enzymatic reaction in bacteria, the result of their combination will be supra-additive 1 . In the co-trimoxazole combination, sulphamethoxazole, a sulphonamide with a structure similar to that of p-aminobenzoic acid (PABA) - a template for folic acid, uses the Woods-Fildes theory of competitive antagonism against PABA, and thus inhibits the incorporation of PABA into folic acid 2 . Trimethoprim on the other hand prevents the reduction of dihydrofolate to tetrahydrofolate, which is essential for one carbon transfer reaction crucial for the synthesis of bacterial DNA 3 . While the mammalian cell relies on the ready-made and available folic acid, the synthetic step is necessary for the build-up of the bacterial cell, which assembles its own folic acid. The optimal ratio of the two agents for their synergistic activity has been found to be 5:1 4 . Pharmacologically, this combination has been found useful, and works satisfactorily to reduce both the toxicity of the individual agents and chances for the possible resistance of the organism to the agents, thus enhancing their therapeutic effect. However, analytical difficulties are immediately created since each component of the binary mixture must be ascertained. At present, the official USP method for the analysis of the combination Sulphamethoxazole–Trimethoprim drug in pharmaceutical preparations commonly utilized, is the High Pressure Liquid Chromatography (HPLC)5 , which for a poor country like Uganda, is expensive and hence not appropriate. There are a number of other methods for the analysis, but spectrophotometry seems to offer a very favourable alternative to HPLC. We recently successfully used 2 the principle previously described by O’haver and Green 6 , and later used extensively 7 , to quantify pharmaceutical mixtures of the anti-malaria combination drug sulphadoxine-pyrimethamine combination (SP). This method involves the measurement of the absolute value of the derivative spectrum of the binary mixture at a wavelength corresponding to the zerocrossing point of the derivative spectrum of the interfering component. First, second, third and even fourth derivative spectrophotometry have been used for the measurement of binary mixtures 8-10 . A first derivative analysis was used to monitor sulfamethazine in the presence of sulfadiazine 11 . Kostantianos Ioannoon and Efstathiou 12 employed a second derivative synchronous scanning method for the simultenous determination of acetylsalicylic acid (ASA) and salicylic acid, while third and forth order derivative spectra were used for determining sulfathiazole and sulfanilamide binary mixtures 13 . At the appropriate wavelength, the amplitude of the derivative signal of one of the two components passes through zero. Therefore the value of the derivative spectrum of a mixture, measured at the zero-crossing point of the derivative spectrum of one of the components, is a function only of the concentration of the other component. The objective of the present work, was to assess whether derivative spectrophotometry could be used to avoid the overlapping spectral bands of the components, which occurs on zero order spectrum, and hence use it for routine assessment of the drug co-trimoxazole. MATERIALS AND METHODS Apparatus A Camspec M350 UV-Visible double-beam spectrophotometer with matched 1-cm quartz cuvettes and a fixed slit width (2nm) connected to an IBM-PC Computer loaded with Camspec WindowsTM software and an Epson LX-300 printer was used for all the absorbance measurements and treatment of data. This system provides the capability for data manipulation including smoothing and construction of derivative spectra from zero-order spectral data. A special zoom in/out function allows data details and interpolation values to be analyzed. A Metrohm 692 pH/ion meter was used for the pH measurements. Reagents Ethanol (90%) and acetic acid (99.8%) of analytical grade were purchased from commercial sources. Double distilled water, freshly prepared was used for all the appropriate dilutions. Ten percent ethanol (10%) was prepared in our laboratory and acetic acid from BDH laboratories. Sulphamethoxazole powder (Glaxo Laboratories Limited, India, 99.46%) and Trimethoprim (Jiangdu Xinghai chemicals Co. Ltd, China, 100.0%) were used as supplied. Co-trimoxazole tablets (Farmaceutici Ecobi S.A.S Ronco Serivia (GE) – Italy, Lot No. 901E) were assayed. The declared contents were as follows: Sulphamethoxazole (400mg), trimethoprim (80mg), per tablet. Filter paper (Whatman No. 1) was used to filter the tablet solutions, and sodium acetate – acetic acid buffer (pH 4.5) was used. Procedure for preparation of standard solutions Standard stock solutions Sodium acetate-acetic acid buffer (pH 4.5) was prepared by dissolving 6.8g of sodium acetate and 3.0ml of acetic acid (37%), and diluting the solution to 1 litre with water. Suitable spectroscopic settings made were; scan over the range 200nm – 300nm, scan speed, 135nm/min, scanning data interval 0.2nm; and span 50s. Sulphamethoxazole and trimethoprim standard stock solutions (100ugml-1) were prepared in aqueous ethanolic solution (10%) and kept below 5oC in a refrigerator for not more than 10 days. Standard working solutions
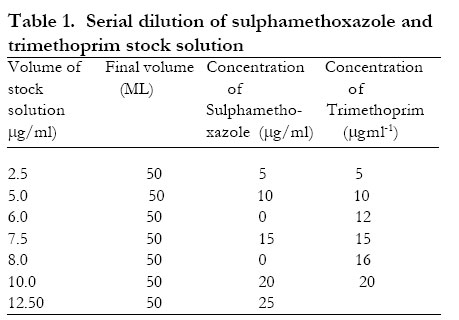
Samples were prepared in 50ml volumetric flasks containing appropriate volumes of the stock solutions. Ten millilitres of pH 4.5 buffer solution, and ethanol (90%) up to 5.5ml were added to the flasks, followed by dilution to mark with water to produce 5-25μgml-1 of Sulphamethoxazole and 5-20μgml-1 of Trimethoprim or their binary mixtures. Construction of calibration graphs
Five serial dilutions of sulphamethoxazole and trimethoprim, were prepared in triplicate, from the stock solutions as shown in Table 1 in the concentration range of 5-25μgml-1 and 5-20μgml-1 respectively. The curves of the solutions were scanned in the range of 200nm – 300nm against aqueous ethanol (10%, pH 4.5) as the blank. Procedure for determining sulphamethoxazole and trimethoprim in tablet formulation Tablet stock solution
Twenty tablets were accurately weighed and powdered in a mortar. An amount of powder equivalent to the weight of one quarter of a tablet was mixed with 35ml of ethanol in 100ml – calibrated flasks. The mixture was then sonicated for 15 minutes on an ultrasonic bath and subsequently made up to volume with ethanol, filtered through a Whatman No. 1 filter paper and the filtrate used for preparation of the tablet assay solution. Tablet assay solutions
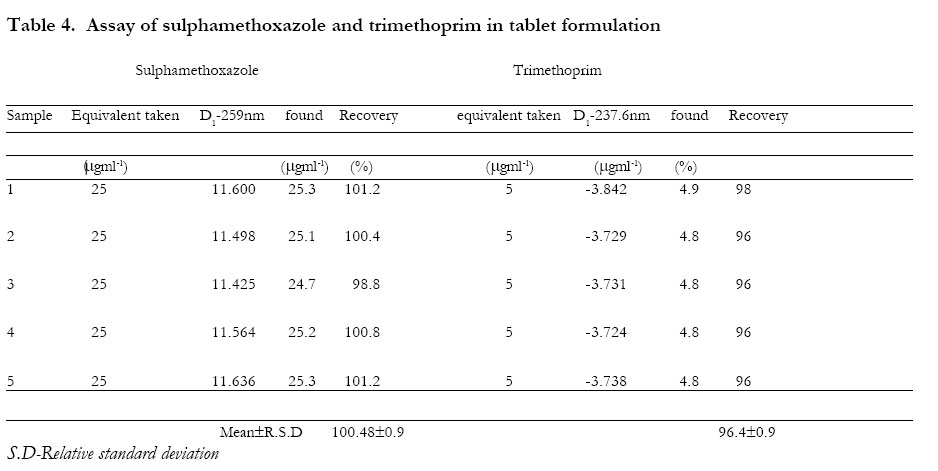
The tablet stock solution buffered to pH 4.5 and ethanol were added to produce an assay solution equivalent to sulphamethoxazole 25μ gml-1 and trimethoprim 5μgml-1. The D1-curve of the solutions (n=5) were obtained and sulphamethoxazole and trimethoprim determined as described above. RESULTS
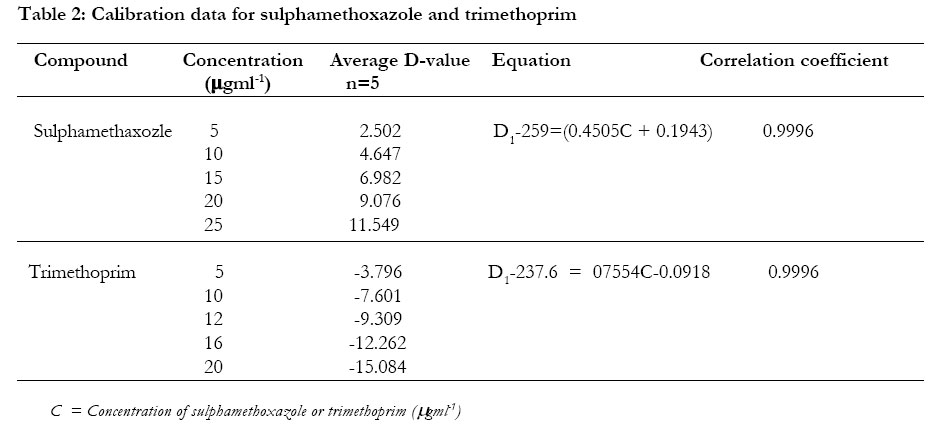
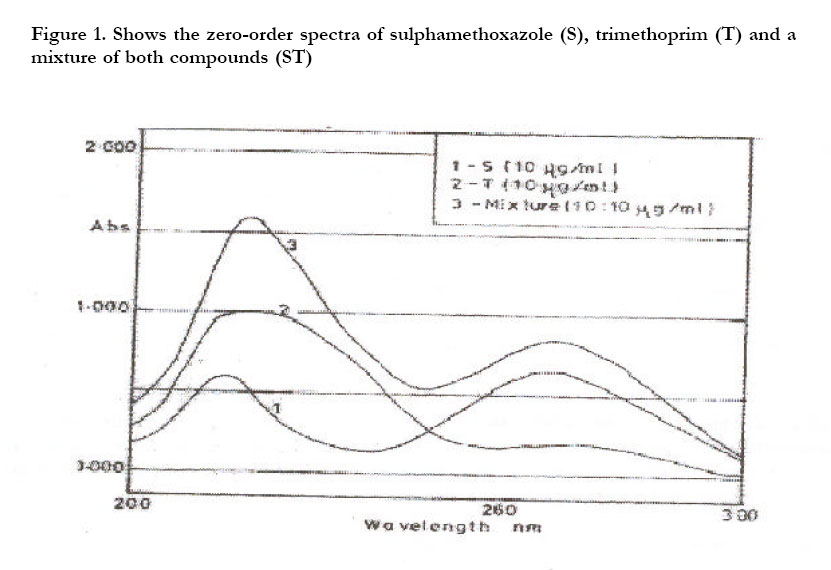
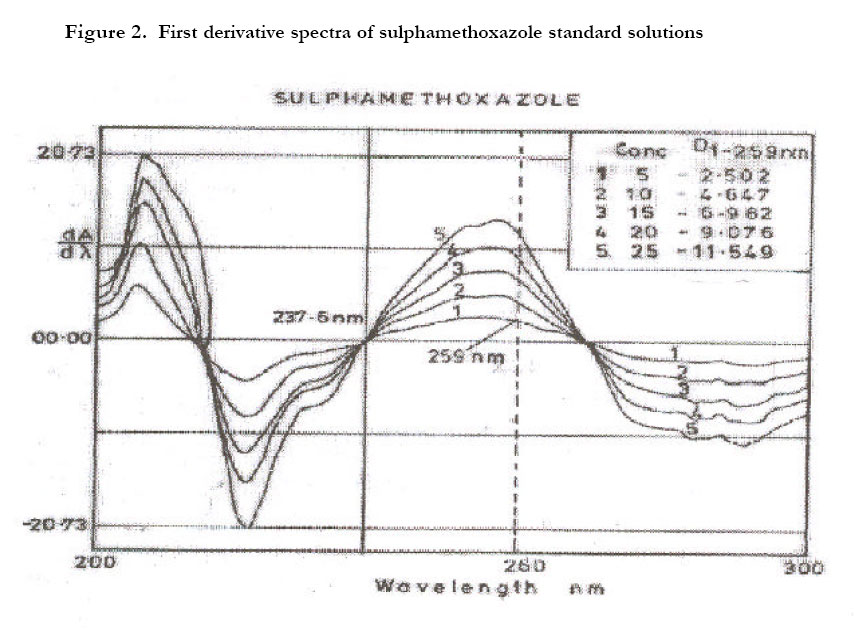
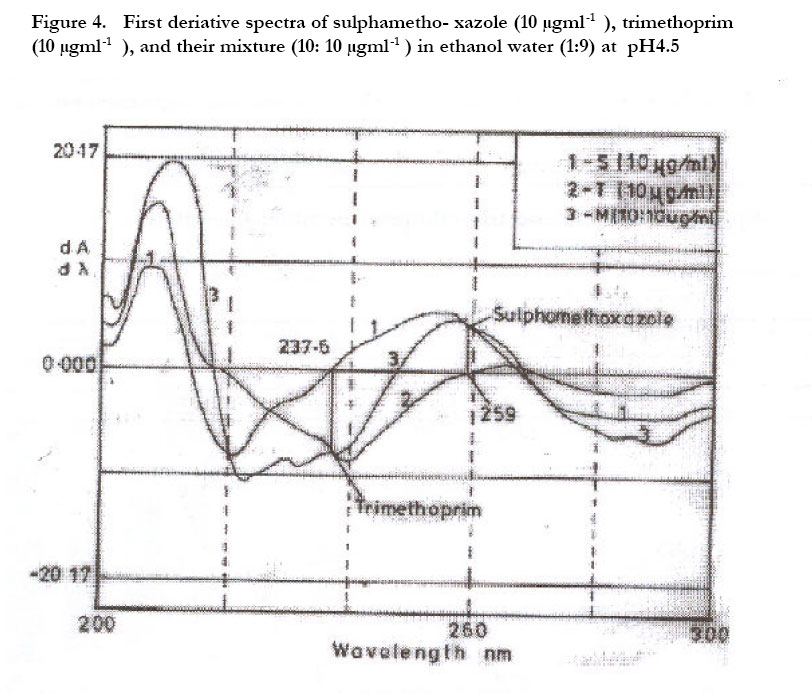
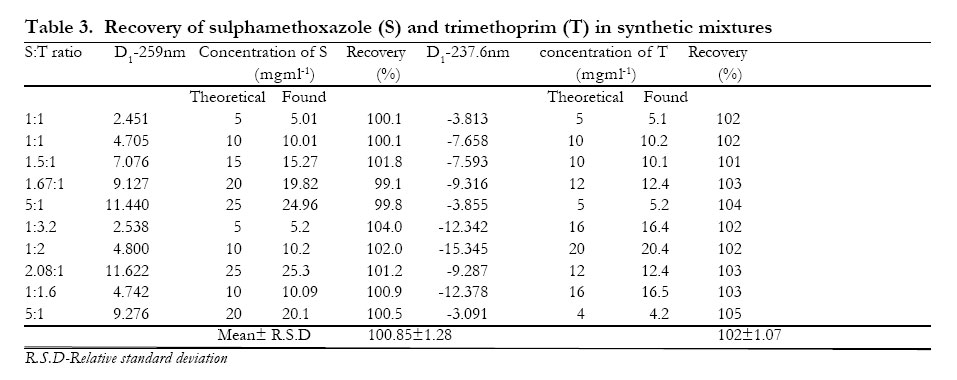
In Table 2, the average derivative values produced when the different concentrations of sulphamethoxazole and Trimethaprim were scanned are indicated. Plotting these derivative values against the respective concentrations, the curves yielded the equation D1-259=0.4505C+0.1943 (correlation coefficient of 0.9996) for sulphamethoxazole and D1237.6=0.7554C-0.0918 (correlation coefficient of 0.9996) for trimethoprim. Absorption measurements made by scanning the solution of S, T and the mixture of S and T on zero order are presented. Their overlapping spectral bands are shown in Fig. 1. Derivative spectral bands for the individual components S and T (in serial dilution concentrations) are shown in Figs. 2 and 3 respectively. In Figure 4, first derivative spectra (D1) are represented by Figures 1, for S, 2 for T and 3 for the mixture. D1 of the S shows a peak at 259nm, where the dA/dλ , for T is zero, so S can be specifically measured at this wavelength. T on the other hand, has a near trough at 237.6nm where dA/dλ, for S is zero; hence T is exclusively measured at that wavelength. The figure also shows that other zero crossings of the two compounds do appear. However, they appear either at lower wavelengths, where there is possibility of interference absorptions, or are too close for any accurate measurements to be done. To prove the validity and applicability of the proposed method, synthetic mixtures of different ratios in the concentration ranges stated in Table 2 were assayed. The results were computed against the previously constructed standard curve. Table 3 presents the results of the assay of the mixtures. As can be seen, satisfactory results were obtained with a mean recovery of 100.85±1.28 and 102.70±1.07 for Sulphamethoxazole and Trimethoprim respectively. Commercial tablet similar method as above was applied to the determination of sulphamethoxazole and trimethoprim in a commercial tablet preparation. Table 4 gives the results of this application. The results obtained were in satisfactory agreement with the label claims, within the acceptable USP limits. DISCUSSION
As can be seen in Figure 1, absorption measurements of each antimicrobial in a binary mixture appears to be quite impossible because of the total overlap of bands. The band overlap might be solved by Vierordt’s simultaneous equation method14. However this may be influenced by differences between the sample and reference, or by the matrix in the pharmaceutical formulations leading to erroneous results. Since the mid seventies (1970s), workers like O’Haver 6and Fell7 found that to resolve the problem of closely overlapping spectra, derivative spectroscopy, with digital processing together with zero crossing, offered the best option. This technique involves the differentiation of the normal spectrum with respect to the wavelength. The first derivative, D1, of the sulphamethoxazole spectrum shows a peak at 259nm, where the dA/dλ, for trimethoprim is zero, so sulphamethoxazole can be specifically measured at that wavelength. Trimethoprim on the other hand, has a near trough at 237.6nm where dA/ dλ , for sulphamethoxazole is zero; hence trimethoprim is specifically measured at that wavelength. In the deriative zero crossing method, it is possible to get two or more ‘zero crossings’. In such a case, meticulous assessment of the best crossing point is possible, basing partly on the strength of the signal. Indeed the present work found other ‘zero-crossings’ of the two compounds. However, they appear either at lower wavelengths, where there is possibility of interference absorptions, or are too close for any accurate measurements to be done. In our setting, the smoothing algorithm of the Camspec-Windows software was used to improve the signal to noise ratio of the derivative spectrum. A scanning data interval of 0.2nm was selected. The instrument automatically sets the scan speed at 135nm/s at this data interval. In addition the Camspec windows programme has four smoothing levels and the highest level was found to be the most appropriate. Higher data intervals, that is 0.5nm or 1.0nm gave spectra with less noise in the signals and therefore better higher order spectra compared to the lower data intervals. However these higher orders, that is second, third and fourth-order spectra didn’t give rise to good zero-crossing points for the concentration ranges studied and therefore were not useful in this study. The linearity of the selected deriative measurements for both antimicrobials was examined. Linear relationships were obtained with the compounds in the concentration ranges cited in Table 2. The stability of ethanolic solutions (10%) of sulphamethoxazole and trimethoprim was studied by recording their absorption spectra. No changes were observed for at least fourteen days when the solutions were stored at 4oC in the dark. In order to prove the validity and applicability of the proposed method, synthetic mixtures of different ratios in the concentration ranges were assayed. Satisfactory results were obtained with a mean recovery of 100.85±1.28 and 102.70±1.07 for sulphamethoxazole and trimethoprim respectively and this is within the required limits since the USP-acceptable limit is not less than 93.0% and not more than 107.0% stated on the labels5. CONCLUSION
In conclusion, the successful application of the proposedmethod confirms that derivative spectrophotometry offers a simple, rapid and direct method of determining this binary mixture, with some advantages over other separation techniques, such as in the official USP-high-performance liquid chromatography. Admittedly, the HPLC method is expensive in both the hardware and chromatographic reagents. ACKNOWLEDGEMENTS The authors thank Mr. Angole Apollo of Rene Industries ltd., Uganda, for providing reference sulphamethoxazole and trimethoprim and Ms. Mary Nantale, Department of Pharmacy, Makerere University. REFERENCES
Copyright 2002 - Makerere Medical School, Uganda The following images related to this document are available:Photo images[hs02040t3.jpg] [hs02040t1.jpg] [hs02040t2.jpg] [hs02040f2.jpg] [hs02040f3.jpg] [hs02040f1.jpg] [hs02040t4.jpg] [hs02040f4.jpg] |
| |||||||||
