 |
| About Bioline | All Journals | Testimonials | Membership | News |
|
||||||
|
||||||
African Health Sciences, Vol. 2, No. 2, April, 2002, pp. 63-68 Monitoring the severity of iodine deficiency disorders in Uganda * Gabriel S Bimenya, Olico-Okui, Dentos Kaviri , Nazarius Mbona and Wilson Byarugaba College of Health Sciences, Makerere University.
P. O. BOX 7072 Kampala, Uganda. Code Number: hs02041 ABSTRACT
Background: Iodine deficiency disorders (IDD) cover a variety
of pathological conditions including goitre, mental retardation and perinatal
mortality in millions of individuals globally. IDD was initially identified
as a problem in 1970 and was confirmed in 1991. In 1993, the Uganda government
introduced a policy of Universal Salt Iodization (USI) requiring all household
salt to be iodized. After 5 years this study evaluates the USI programme. INTRODUCTION It is now widely known that inadequate dietary supply of micronutrients such as iodine, selenium, zinc, and other trace elements is a very important determinant of disease in human society mainly in the poor countries of the world. Deficiency of iodine leads to a global statistic of two million patients with cretinism and 211 million individuals with goitre. As early as 1970 Kajubi and Okel1 reported iodine deficiency in Uganda. In 1990 a world summit sponsored by UNICEF attended by 90 heads of state including the Presendent of Uganda, resolved to eliminate micronutrient malnutrition of iron, vitamin A and iodine in their countries. In 1991 Kakitahi2 and Olico- Okui, and Mugumya Owarwo3 reported that iodine deficiency disorders were a severe public health problem in Uganda. In 1993, the Uganda government introduced a policy that requires all salt entering the country for human and livestock consumption to be iodized. Consequently in 1994, the Ministry of Health (MOH) developed a plan of action for the control of iodine deficiency disorders, through a strategy known as Universal Salt Iodization (USI). The USI was launched to ensure that only adequately iodized salt enters the country. Other functions These results indicate that even with the current level of to create awareness of the problem and its solution as well as chemical testing for iodine in salt for consumption. It is therefore pertinent that micronutrient malnutrition has raised health as well as political concerns. After 5 years of USI action, MOH decided to monitor the project through this study whose objectives were:
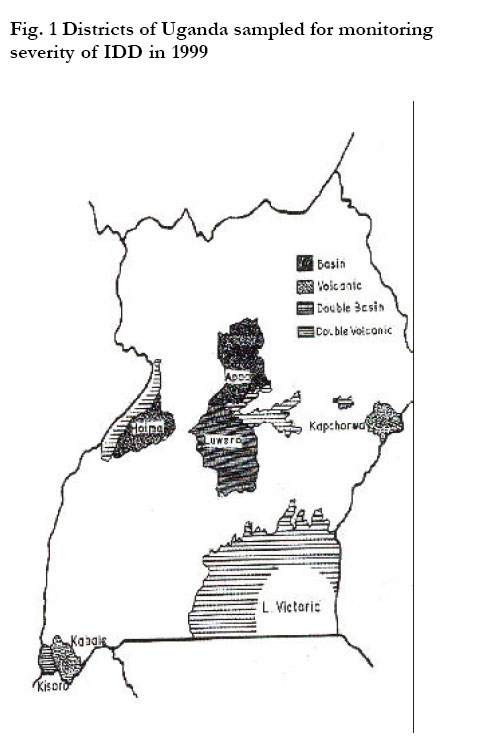
MATERIALS AND METHODS The study design was in line with WHO/ICCIDD guidelines contained in the document WHO/Nut/94.6 of 1994. Study Design This was a descriptive cross-sectional point prevalence population survey based in primary schools. The districts were separate geographic units of study and so was the country. Hence each study district constituted “a sampling universe” according to indications of assessing IDD status. Study sites The districts constituted comparable geographical units of the study (Figure 1) District data were aggregated to give the national picture. Six out of 45 districts (13%) were selected for the study by the MOH. Three of the districts (Kisoro, Kabale and Kapchorwa) are highland, volcanic areas, while the other three (Apac, Hoima and Luwero) are plain, low-lying water-basin areas. Four of these districts (Hoima, Kabale, Kapchorwa and Kisoro) had baseline goitre and urinary iodine data2 in 1991. Study population Children aged 6-12 years attending both public and private schools in the study districts were randomly selected for the study. Their households formed the sample frame for measuring the consumption of iodized salt. Sample size
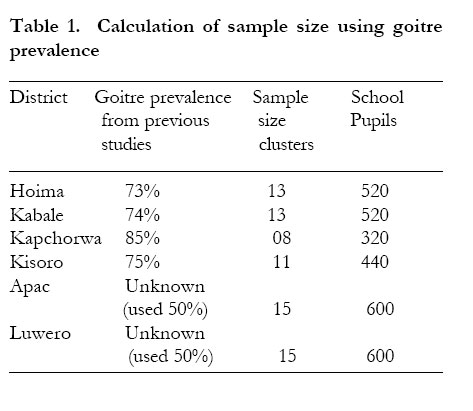
A sample size was determined for each study district using the computer programme “C-size sample calculation” based on Bennet’s formula for cluster surveys in developing countries4. Using goitre prevalences for the various districts from previous studies2,3, 95% confidence level and 7% precision, a design effect of 3 and 40 study units per cluster, the following sample sizes were calculated as shown in Table 1. Sampling procedure The cluster method of “proportionate to population size” was used to select the sample of schools, as follows: A list of all primary schools and their enrolments in each district was obtained from the District Education Officers. The cumulative enrolments of all schools in each district were worked out and the pupils listed. A sampling fraction was calculated by dividing the total cumulative population of all the schools by the number of school clusters required. The first school to be included in the sample was selected using a table of random numbers. The cumulative population of the first chosen school was then added to the sampling fraction and the number of the next pupil to be included in the sample obtained. The school, which contained the number of the pupil, was chosen as the second school cluster. This was repeated until the desired number of clusters was selected. The second stage in the sampling process was to obtain the 40 pupils in each school cluster as the study units. Systematic sampling was used. Using class registers, the number of pupils in the study age bracket in the school was established. Those present that day were then listed. The total was divided by 40 to get a sampling fraction k2. A random start pupil was chosen using random number tables and every k2 th child was chosen until the required pupils were picked. As recommended by WHO5 , 50 urine and 50 salt samples were collected from each district. These were divided equally among the school clusters. Fourty pupils were systematically sampled to get a sub-sample of those to give a spot sample of urine. Whoever gave a spot urine sample was sent home for a salt sample used for cooking the previous day’s meal. A training workshop was held for the study team to standardize procedures for sampling, specimen collection, storage and transportation, palpation for goitre and goitre grading. Sampling of the school clusters for each district was done at this workshop. Pre-visits were then paid to the districts by the study team to:
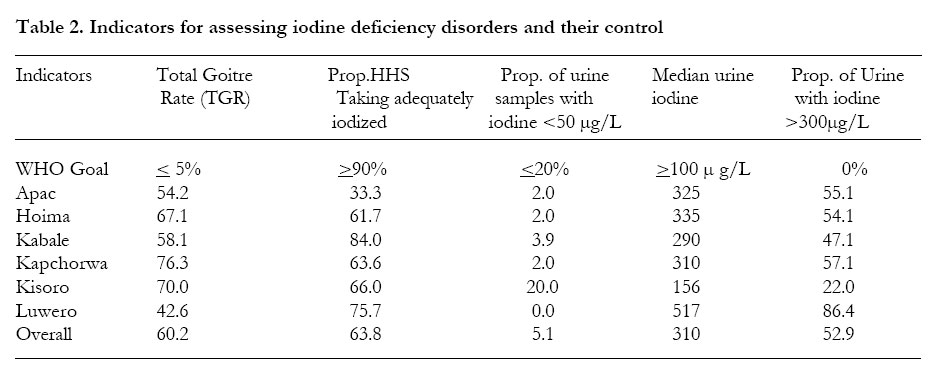
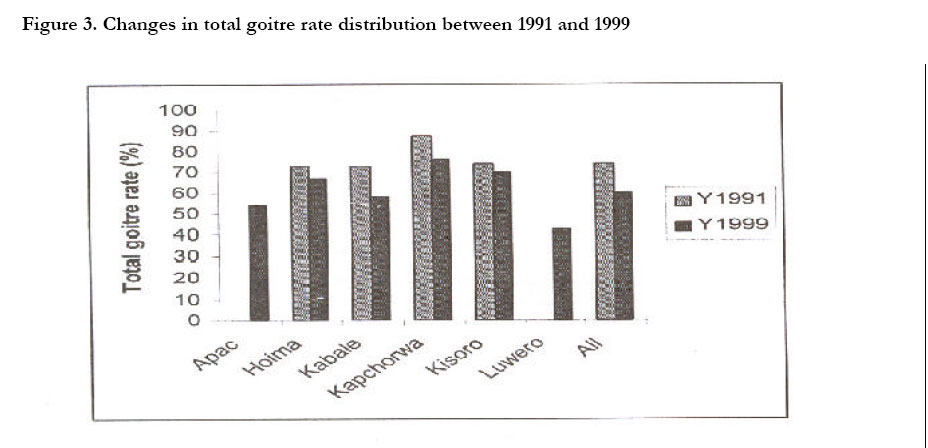
Data collection The 40 sampled children per cluster were interviewed for age, sex and class before physical examination for goitre using the current grading recommended by WHO5 and for aneamia. Urine specimens were collected in plastic bottles with screw caps, and directly labeled with identification codes using permanent markers. Salt specimens were collected into indelibly labeled polythene bags securely tied with rubber bands and packed in indelibly labled, bigger polythene bag. Individual urine specimens from each district were collectively stored in a cold box with slots made to fit the bottles standing upright. The box was sealed for transportation. Salt samples for each district were similarly stored in separate paper boxes, which together with the urine boxes were transported to the participating laboratories within 48 hours. Iodine determination Salt samples were titrated for their iodine with thiosulphate at the Uganda Bureau of Standards (UNBS). Urinary iodine was assayed in the Departent of Biochemistry at Makerere University using the Brucine Method F recommended by ICCIDD (1994)6. Data management Computer EPINFO version 6 and SPSS version 9 were used to process the data RESULTS The indicators for assessing iodine deficiency disorders and their control through salt iodisation are given in Table 2 which compares our findings with the WHO goals for each indicator (A-E) below. A. Distribution of goitre among school children All the sampled districts have total goitre rate distribution (TGR) above the WHO standard of <5% with the highland districts of Kabale, Kapchorwa and Kisoro having higher TGR than the low-land districts of Apac, Luwero and Hoima; though the TGR of Hoima approaches those of highland districts. B. Household consumption of adequately iodised Salt. The WHO set goal for the proportion of household consuming sufficiently iodised salt > 50µg/L is >90% and in the sampled district none fulfils this criterion which herein ranges from 33.3% (Apac) to 84% (Kabale). C. Urinary Iodine Excretion The set goal is that the proportion of the population excreting low urinary iodine (< 50 µg/L) should not exceed 20% and all the sampled districts, except Kisoro, fulfilled this criterion. D. Median Urinary Iodine Excretion The desirable median urinary iodine of 100 µg/L was exceeded by all the districts with Kisoro district having the lowest of 150 µg/L and Luwero district having the highest of 517 µg/L . E. Excess Urinary Iodine The upper safe limit of urinary iodine excretion is 300 µg/L. All the districts in the study had levels exceeding this, except Kabale and Kisoro. However, even in these, there were individual pupils excreting in excess of 300 µg/L. F. Changes in distribution of VGR In Figure 3, the distribution of visible goitre rates among the school children in the districts in 1999 is compared with that of 1991. Overall, visible goitre rate decreased by 9.2%. Whereas individually Kabale and Kapchorwa had significant falls of 14.7% and 20.1% respectively, Hoima and Kisoro had a slight and significant increase in visible goitre rates respectively (4.4% & 7.2%), suggesting persistent severe iodine deficiency in the latter two districts. Apac and Luwero had no previous data. G. Changes in distribution of TGR In Figure 3, distributions of total goitre rates in the districts are compared for the years 1999 and 1991 where there has been statistically significant reduction in TGR in all the districts, except Kisoro. Significant reduction is more marked in Kabale and Kapchorwa districts where even goitre sizes, as evidenced by reduction in percent pupils with visible goitre, was recorded. This implies significantly reduced severity of iodine deficiency. DISCUSSION A goitre prevalence of 5% is taken as the maximum above which iodine deficiency is designated as a public health problem. All the districts evaluated in this study had a prevalence much more than 5%. The persistence of high TGR and VGR figures is probably because USI is only a few years old. Amidst this general poor performance, Kabale district had a TGR much below and out of pattern with similar highland places of Kapchorwa and Kisoro. This ties up with her performance in the USI implementation policy as discussed below. The comparatively low goitre prevalence in Apac and Luwero districts may reflect their low land situation which receives alluvial iodine from the hills and mountains (Figure 1), otherwise household salt/iodine consumption does not reflect an exceptional source of iodine in the two districts. Although the USI general principle was to replete household iodine intake, the evaluation results indicate that some localities still have less than the expected amounts. Even if 5 out of the 6 districts had more than 50% of households consuming salt iodated to >50 ppm, no district met the WHO safety standard of 90% households consumption rate. Apac was a particularly bad consumer of salt iodine, with just a third of its households taking in adequately iodated salt (>50 ppm). There are no obvious reasons to explain this result, but it may mean that either the policy was not well received or the distribution infrastructure is not well developed probably due to political instability and the remoteness of some areas of the district. Kabale did well with 84% of its investigated households consuming salt iodine >50 ppm. This was close to the WHO safety standard of 90%. Kabale is a highland area exposed (Figure 1) to vulnerable and intensive iodine leaching, yet she scored so highly. This means that USI policy was well implemented in the district to offset the natural shortage with only a few households consuming no iodine at all in the salt. Urinary iodine excretion may be regarded as an ultimate indicator for the effective amount of the micronutrient recently eaten since the kidneys are the major excretion outlets7. The low median urinary iodine excretion in Kisoro district reflects the worst situation in the study; possibly in the country; contributed by low salt iodine consumption and effects of high altitude on iodine loss (Table 2). Kapchorwa another highland district (Figure 1) closely trails Kisoro with low minimum and low maximum values of urinary iodine concentrations. These results indicate that even with the current level of supplementation there are still areas in Uganda, like Kapengati in Kenya, in which iodine consumption is still below the daily requirements7. Another reason could be poor sanitation leading to contaminating potable water with coliforms 8,9. Luwero’s minimum urine concentration is about 3 fold the lowest values in other districts and is greater than the WHO recommended standard of 100µg/L. This area therefore consumes too much iodine. Luwero is closest to the capital Kampala, only 40 km away, and this proximity may lead to efficient USI implementation. Paradoxically it has a visible goitre rate in about half of its population and this may be a reflection of iodine-induced hyperthyroidism. Luwero district obviously suffers over consumption of iodine in one form or other and needs to be studied more and urgently too. CONCLUSIONS Goitre prevalence in all study districts is still high, above 30% constituting a severe public health problem. However, the rates have moderately reduced in Kabale and Kapchorwa where consumption of iodized salt has been more widely distributed and apparently for much longer in the life of USI. It is concluded that USI has been responsible for this modest reductions of goitre rates. Given more time and sustained implementation, the gains will be more marked. However, some districts (Hoima & Kisoro) are lagging behind because of poor coverage with iodized salt. The proportion of households consuming adequately iodized salt is still moderately low at 64%. Moreover there are still areas in the country which do not receive iodized salt at all. Such areas are still very goitrous and partly exaggerate the overall district and country picture. Median urinary iodine levels in all the study districts and overall in the country were above the WHO recommended 100µg/L, indicating abnormally high iodine intake in the population. This needs redress. RECOMMENDATIONS This study has demonstrated that the major constraints to sustained elimination of IDD in Uganda are lack of uniform access to iodized salt by all areas, all the time and a weak monitoring system. A surveillance system for salt iodization and urinary iodine excretion be vigorously instituted throughout the country. Sentinel districts regionally and geographically representative be selected for this purpose and to help monitor the incidence of iodine induced hyperthyroidism. Samples of both urine and salt be taken quarterly from the sentinel districts using Lot Quality Assurance Sampling for testing qualitatively and quantitatively at UNBS and Chemical Pathology Section of College of Health Sciences Makerere University, which two centres could be designated as national reference laboratories for this purpose. Goitre prevalence assessment be carried out every three years: ultrasonography be introduced in the next monitoring survey in October-December 2002. Appoint a national multisectoral committee of various stake holders to take control of IDD. Garner political support for IDD activities and intensify USI campaign by involving politicians. Facilitate studies on salt iodine consumption per capita and losses of salt iodine. Enforce salt iodization by local producers such as Lake Katwe salt industries. Review the Uganda set standard of salt iodization for household consumption at 100ppm. ACKNOWLEDGEMENTS The authors gratefully acknowledge UNICEF Kampala, Uganda for funding the study, the MOH for commissioning it, the Directors of District Health Services for their administrative support and the laboratory staff at UNBS and Biochemistry Department Makerere University for their analysing the samples. REFERENCES
Copyright 2002 - Makerere Medical School, Uganda The following images related to this document are available:Photo images[hs02041f2.jpg] [hs02041f1.jpg] [hs02041t1.jpg] [hs02041t2.jpg] [hs02041f3.jpg] |
| |||||||||