 |
| About Bioline | All Journals | Testimonials | Membership | News |
|
||||||
|
||||||
African Health Sciences, Vol 3, No 1, April 2003, pp 2 - 6. ORIGINAL ARTICLES Chloroquine in the Ugandan market fails quality test: a pharmacovigilance study Jasper W. Ogwal-Okeng, Erisa Owino, and Celestino Obua* Department of Pharmacology and Therapeutics, Faculty of Medicine, P. O. Box 7072 Kampala, Uganda * Correspondence to: Celestino Obua, Department of Pharmacology and Therapeutics, Faculty of Medicine, Makerere University, P. O. Box 7072, Kampala Uganda Tel: 256 – 41 – 532945 / 256 – 77 – 665919 E-mail: cobua@med.mak.ac.ug Code Number: hs03002 ABSTRACT Background: Antimalaria treatment failure has been partly attributed to poor quality antimalarials in the drug market. A 1998 survey in Kampala showed that 55 % of tablets and 62 % of injection forms of chloroquine failed the quality test. BACKGROUND The problem of malaria as a public health concern has continued to be highlighted by the high morbidity and mortality, and negative impact on socio-economic development in Africa1 . The main strategy in the control of malaria is by early detection and treatment of cases2 . There have been cases of treatment failures, and some of these have been due to the development of resistance to the antimalarial drugs. However, it is suspected that some failures may be due to poor quality of the drugs3 . Drug efficacy studies done in Uganda have reported an ever-increasing level of P.falciparum resistance to antimalarials especially to chloroquine4, 5 . The current antimalarial drug policy in Uganda recommends a combination of chloroquine and sulfadoxine/pyrimethamine as the first line treatment for malaria. The importance of chloroquine in the Ugandan antimalarial drug policy cannot be overstated. This has been demonstrated by the fact that despite the reported resistance, chloroquine is still an important component of the antimalaria drug policy in Uganda, while other countries have opted to leave out chloroquine altogether6 . Thus, with all this faith in chloroquine, it is important that the drug available to the citizens of this country is of good quality. A 1998 study on the quality of chloroquine obtained from pharmacies around Kampala showed total failure rates of 55 % for chloroquine tablets and 62 % for injection samples that were analysed7 . Since then, the Uganda Government has established the National Drug Quality Control Laboratory (NDQCL) in Kampala that carries out random quality control on all registered drugs, including chloroquine. This study was therefore designed to evaluate the impact of this intervention on the quality of chloroquine in the country three years on. Objectives The general objective of this study was to determine the quality of chloroquine, tablet and injection forms, available in the Uganda drug market. Specifically, the study was intended to determine the following: · The quality of tablet and injection dosage forms of
chloroquine in Uganda. METHODOLOGY Chromatographic and solvent systems The HPLC system consisted of a Hewlett Packard (HP) G1321A isocratic pump equipped with an HP G1314A UV-visible variable wavelength detector, which was set at 343 nm. The column was a Reversed Phase (C18) ODS-Hypersil, 20 cm x 4.6 mm, with 5 mM particle size. The chromatograms were generated using an HP integrator. Chromatographic separations were performed at a controlled temperature of 25 °C using a Cecil Column Oven. Samples were manually injected through a fixed volume (20 ml) peak loop. Analysis was done using liquid chromatographic (HPLC) method according to the USP standard of 1995 8 . Chloroquine phosphate reference standard (MD Cat. No. 11800) was obtained from the USP in Rockville, USA. The Concentrated Hydrochloric acid, and Methanol used to dissolve and dilute the samples were of analytical grade. The mobile phase consisted of an isocratic mixer of Acetonitrile, Methanol and Diethylamine (80:19.5: 0.5 % vol.), obtained from BDH Laboratories (UK). The mixer formula was adapted from the preparation described by Lindstrom et al9. Degassing was achieved by sonicating using a transonic Elmer sonicator, and filtered on line. The flow rate was set at 1 ml/min. Study design This was a descriptive, cross sectional study of the quality of the tablet and injection forms of chloroquine, by content of the active ingredient, present in the Uganda drug market from June November 2001. Sampling Samples of chloroquine tablets (50 tablets per outlet) and injection dosage forms (10 x 5ml ampoules and 1 x 30ml bottles per outlet) were purposefully but anonymously purchased from the pharmacies and drug shops from all four regions of Uganda plus Kampala city which was treated as a region in its own right. A total of 47 chloroquine tablet and 45 chloroquine injection batches were collected. The following towns were purposefully selected to represent the regions: Apac and Lira in the North, Mbale and Tororo in the East, Masaka and Mbarara in the West, Kabale in the South, and Kampala city. Other than in Kampala, all pharmacies in the other regions and some drug shops were sampled. If a drug outlet had more than one brand/batch of chloroquine, then all the different brands and/or batches were sampled. A total of 10 outlets from each region were sampled. The tablets were collected in dry waterproof materials and kept on shelves in a cool dry place in the Laboratory, while the injection forms were stored in a refrigerator at 40° C until analysis. The batch numbers, manufacture and expiry dates of the samples were recorded. Where the tablets were being dispensed from a container, the details of the tablet were obtained by direct questioning of the shop-attendant; otherwise the details were obtained from the labels on the containers (Tins), vials and ampoules. The shop attendants or the pharmacists were also asked to provide information about the local supply source of their drugs. Preparation of chloroquine phosphate (CQ) reference standard Standard solutions of CQ (20 mg/ml) were prepared by dissolving approximately 0.5 mg of the powder in 250 ml of 0.1 M hydrochloric acid in methanol (acidified methanol) in a volumetric flask. This solution was injected in the column to obtain the calibration curve. Preparation of chloroquine phosphate tablet samples Twenty tablets from each batch were individually weighed and the total divided by 20 to obtain the average weight of one tablet. These were then ground into powder. The powder equivalent to the weight of one tablet was dissolved in 100 ml of acidified methanol by shaking for 10 minutes. The solution was then filtered and labeled as solution A. Ten milliliters of solution A was diluted in acidified methanol to 50 ml in a volumetric flask and labeled as solution B. Finally, 1.0 ml of solution B was further diluted to 25 ml in acidified methanol in a volumetric flask and labeled as solution C, resulting in a final concentration of 20 μg/ml of CQ. Four separate injections, 20 μl each, of this final solution were made. Preparation of chloroquine phosphate injection samples Five ampoules of CQ injection were transferred into a suitable container and sonicated to ensure homogeneity. An aliquot (3.1 ml = 124 mg) was transferred into 10 ml volumetric flask and the volume adjusted to the mark with acidified methanol giving a concentration of 12.4 mg/ ml. Further dilutions; 5ml into 50ml; then 2ml into 50ml; then finally 10ml into 25ml, resulting in a solution with a concentration of 19.84 μg/ml. This was then injected into the HPLC in four separate injections. Data analysis The standard drug was used to obtain a calibration curve from which the concentrations of the samples were calculated. The equation describing the linear regression on the calibration curve is given as: Y = α (X) – 0.2451 (1) Where, X is the amount of chloroquine phosphate in the sample per milliliter (μg/ml) and Y is the AUC of the chromatogram; α is the slope function (a constant) = 0.8263, while 0.2451 is theY intercept.
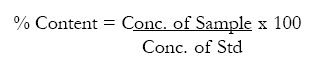
The value of X in equation (1) above was used to calculate the % content of the sample based on that of the standard as follows: % Content = Conc.of sample x Av. Wt of tablet x100 (2) Conc. of Std Wt taken Where, the average weight of a tablet was obtained individually weighing twenty tablets from each batch, then dividing the total weight by twenty to obtain. While the “weight taken” was obtained by grinding the twenty tablets into a fine powder, and then taking a sample of the powder equivalent to the average weight of one tablet as previously determined. Since weight taken was equivalent to the average weight, the formula simplified to:
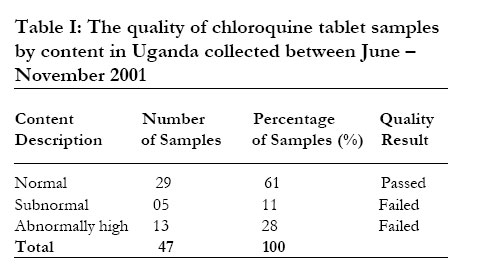
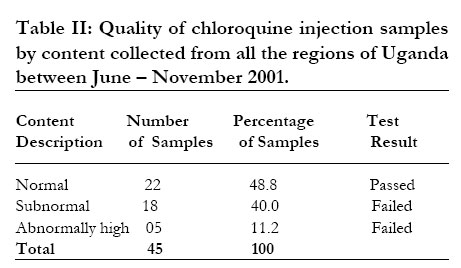
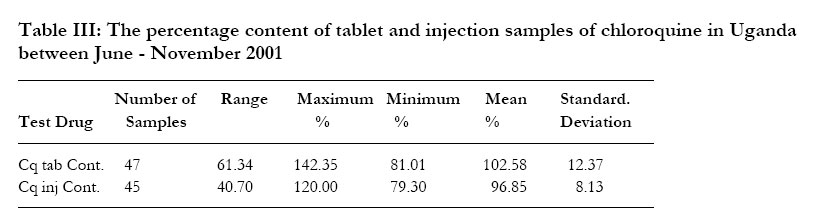
Using this method, the USP specification of the amount of chloroquine phosphate were determined for tablet and injection forms respectively. Data entry and analysis was done using SPSS 10.01 version. RESULTS Tabulating the drugs by country of manufacture showed that Indian pharmaceutical companies dominate the Ugandan drug market for chloroquine with 38 %, followed by China (15 %), then Kenya (13 %), while Uganda accounted for slightly less than 10 %. The rest were from other countries such as Pakistan, Egypt, Hungary and Malta. There was wide variability in the weight of tablets, with the average weight of a tablet ranging from 0.3157 0.5194 g (s.d.= 0.0637) amongst the different batches. The lowest recorded individual weight of a tablet was 0.3087 g, while the highest was 0.5372 g, a range of 0.2285 g. The shelf life of the drugs ranged from three years to six months. No expired samples were found. Most out lets obtained their drug supply from private importers in Kampala, some obtained them from the National Medical Stores, while others from local wholesalers within their towns. There was no significant difference in the failure rates of the drug samples by regions. Of the 47 batches of samples assayed, 18 (39 %) failed the content test. Most samples that failed had too much of the active ingredient. The batch with the highest abnormal content had 213.53 mg/tablet, whilst the batch with the least subnormal content had 121.52 mg/tablet of chloroquine phosphate. The mean content for all the 47 batches was 153.87 mg /tablet. The distribution of the tablet batches by content of the active ingredient is shown in Table I. Likewise, of the 45 samples of injection forms of chloroquine analysed, a total of 23 (51.2 %) samples failed the content test, with most of the failed samples having too little active ingredient. The worst sample contained as low as 31.72 mg/ml, whilst the highest abnormal sample had 48 mg/ml of chloroquine phosphate. The distribution of the injection samples by content of the active ingredient is shown in Table II. The mean content for chloroquine tablets was 102.58 % at 95 % confidence interval between 98.94 – 106.21 %, while that for injection form of chloroquine was 96.85 % at 95 % confidence interval between 94.40 – 99.29 %. The range and the standard deviation of the mean content for both tablet and injection forms are given. The variability of content was greatest among samples of chloroquine tablets as shown in Table III. DISCUSSION The USP specification for the content of chloroquine phosphate in the tablet and injection forms should be in the range of 93 – 107 % and 95 – 105 % respectively. This study has demonstrated high overall failure rates for the dosage forms of chloroquine. Compared to the previous study7, which had 55% and 62% failure rates for tablet and Injection forms, there is a statistically significant 16 % reduction in the total failure rates for chloroquine tablets (p=0.023 at 95 % confidence interval). While for the chloroquine injection form, the reduction in the failure rates by 11 %, failed the statistical significance test (p=0.12 at 95 % confidence interval), indicating that there is still more violation in the content quality of injection form of chloroquine than the tablet form. The lack of randomization in the sampling of the batches could have lead to the over-sampling of a particular batch. However the need to obtain all available batches sold in the selected towns outweighed the risk of this bias, thus the sampling unit became the towns in the respective regions. The clinical use of chloroquine preparations containing less than the optimum amount of the active ingredient may be contributing to the poor treatment outcomes reported in the country. On the other hand, the recommended treatment for uncomplicated malaria in Uganda includes the use of chloroquine tablets10. From the study we see that the majority of the failed samples of chloroquine tablets contained more than the recommended amounts of the active ingredient, thus posing potential toxicity risks to the users. The clinical implications of these findings may remain uncertain for the moment. However, we suspect that some of the adverse effects of chloroquine may be related to these findings, such as where a tablet contained much more than the stipulated amount. The apparent none response of malaria to chloroquine injection could also be as a result of the overall low content of the injection dosage form. Some of the reasons for the wide variations in the content of chloroquine in Uganda could be due to poor manufacturing practices (low quality drugs), long and unfavorable conditions of distribution chains, or just poor storage conditions. The supply routes in Uganda are characterized by adverse conditions for storage and transport, and there is much concern about the quality of pharmaceuticals at the level of end users11. The Uganda Government has set-up a National Drug Quality Control Laboratory that routinely checks on the antimalarial drugs entering the country legally (registered drugs), and we believe that this could have contributed to the slight decrease in the proportion of poor quality chloroquine compared to the 1998 findings7. However, the liberalization of trade and the difficulty of monitoring the porous borders, may still account for the persistence of poor quality chloroquine in the market. Collecting samples with current shelf lives minimized the effect of expiry period. But since there are unconfirmed press reports of relabelling of drugs, some of our samples could have deteriorated due to expiry of shelf lives. CONCLUSION A significant proportion of chloroquine on the Ugandan market does not meet the required quality standards. Given that there is routine inspection and analysis of the incoming drugs for content of the active ingredients and other pharmaceutical properties by the National Drug Authority (NDA), the study has indicated the necessity for more vigilance and routine checks of the drugs on the market. This should include the analysis of subsequent batches that are in the drug market. There are probably many reasons for the existence of poor quality chloroquine in Uganda. However, we suggest that while the NDA checks on the officially imported antimalarial drugs at the time of registration, post distribution surveillance is mandatory. A drug could be officially registered yet some batches may find their way into the country unofficially thereby escaping the pharmacovigilance of the NDA. Given that most samples in Kampala were found to be of good quality, the problem may be due to the characteristics of the supply routes and storage facilities. The suitability of storage facilities for drugs should be ensured before the pharmacy or drug shop premises are licensed. ACKNOWLEDGEMENT We would like to acknowledge UNICEF for having funded the study and providing technical advice for the analysis. Dr. Peter Langi, Manager Malaria Control Program, Mr. Martin Oteba, the Principal pharmacist in-Charge, both from Ministry of Health for encouraging the study. Dr. John C. Lule, Atanasius Kakwemeire and Peter Ssali of the National Drug Authority for the corporation they extended to us during the assay of the samples. Some of the samples were also run at the National Quality Control Laboratory by Samuel Balyejjusa, David Musoke, and Simon P. Alarakol with permission of the Executive Secretary of NDA. REFERENCES
Copyright © 2003 - Makerere Medical School, Uganda The following images related to this document are available:Photo images[hs03002t2.jpg] [hs03002t3.jpg] [hs03002t1.jpg] |
| |||||||||